Antony_NPBFX
NPBFX Representative (unconfirmed)
- Messages
- 1,093
USD/CAD: wave analysis 15.02.2019
Good afternoon, dear forum visitors!
NPBFX offers the latest release of analytics on USD/CAD for a better understanding of the current market situation and more efficient trading.
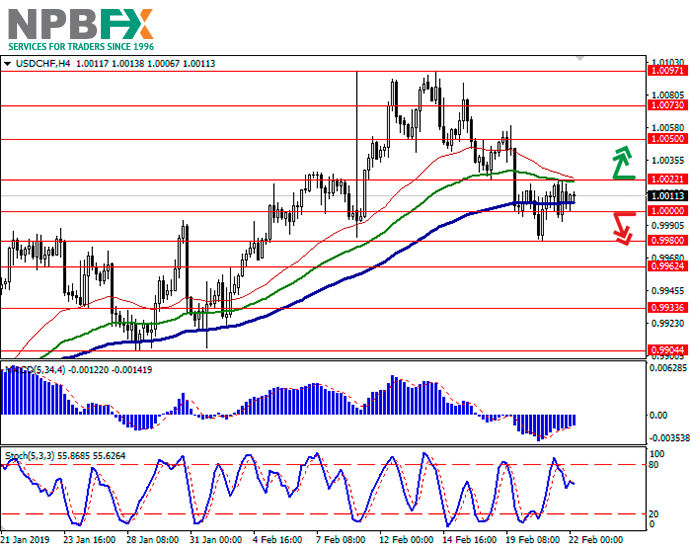
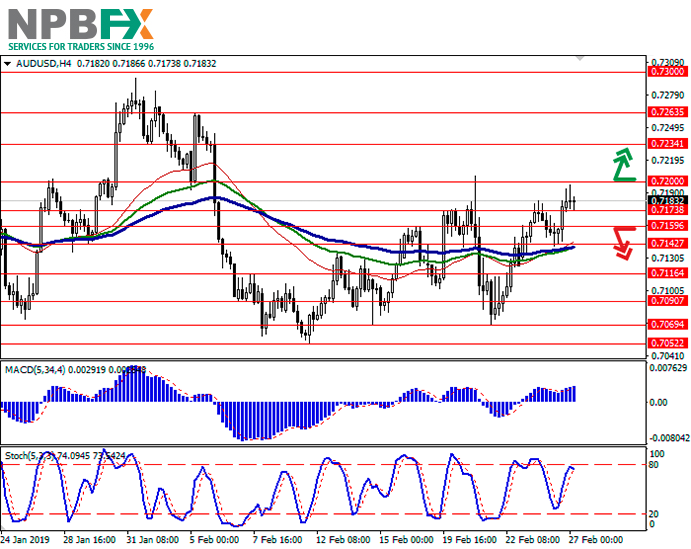
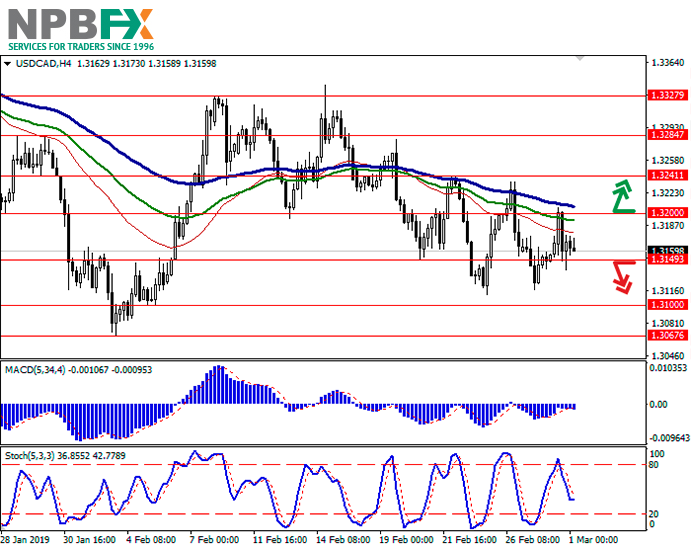
The pair may grow.
On the 4-hour chart, the third wave of the higher level 3 develops, within which the wave ii of 3 ended. Now the entry wave of the lower level (i) of iii of 3 has formed, and a local correction developed as the wave (ii) of iii. If the assumption is correct, the pair will grow to the level of 1.3661. In this scenario, critical stop loss level is 1.3188.
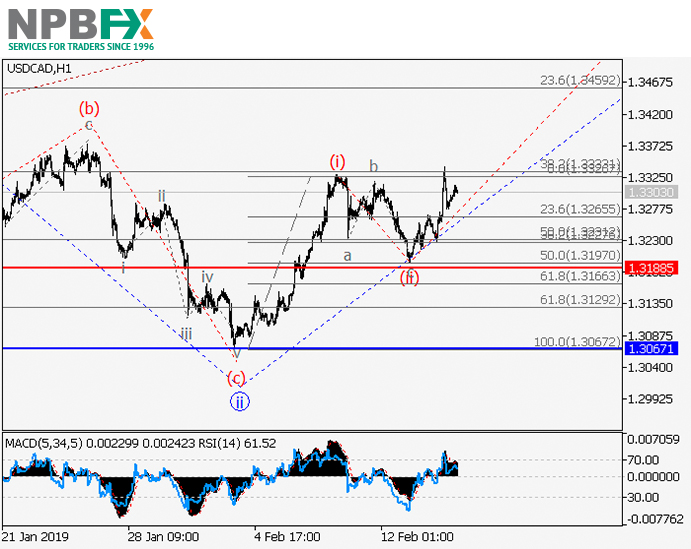
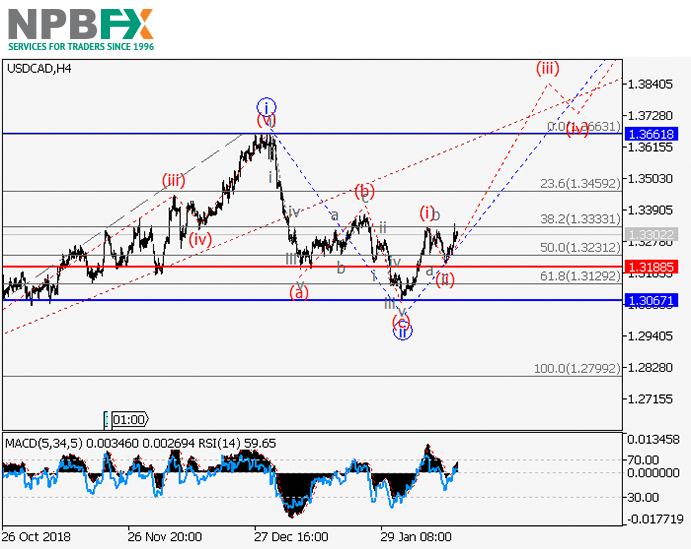
Main scenario
Long positions will become relevant during the correction, above the level of 1.3188 with the target at 1.3661. Implementation period: 7 days and more.
Alternative scenario
The breakdown and the consolidation of the price below the level of 1.3188 will let the pair go down to the level of 1.3067.
Use more opportunities of the NPBFX analytical portal:E-book
If you just recently started to be interested in trading on FOREX and would like to deepen your knowledge, an electronic Beginner's Guide to FOREX Trading will be an excellent helper for you here. The book consists of 5 chapters and reflects fundamental concepts of the foreign exchange market to start successful trading. From the main chapters of the E-book you can learn about the concepts and history of FOREX, currencies and trend lines, technical indicators, types of orders, trading on news, psychology of trading, risk management and much more.
You can read a Beginner's guide to FOREX Trading online or download it free of charge from the NPBFX analytical portal in the "Education" section. In order to get unlimited access to the E-book and other useful instruments on the portal, you need to register on the NPBFX website.
If you have any questions about trading instruments, you can always ask an analyst in the online chat on the portal and get a free consultation of an experienced specialist.
Use the current recommendations of analysts on USD/CAD and trade efficiently with NPBFX.
Good afternoon, dear forum visitors!
NPBFX offers the latest release of analytics on USD/CAD for a better understanding of the current market situation and more efficient trading.
The pair may grow.
On the 4-hour chart, the third wave of the higher level 3 develops, within which the wave ii of 3 ended. Now the entry wave of the lower level (i) of iii of 3 has formed, and a local correction developed as the wave (ii) of iii. If the assumption is correct, the pair will grow to the level of 1.3661. In this scenario, critical stop loss level is 1.3188.
Main scenario
Long positions will become relevant during the correction, above the level of 1.3188 with the target at 1.3661. Implementation period: 7 days and more.
Alternative scenario
The breakdown and the consolidation of the price below the level of 1.3188 will let the pair go down to the level of 1.3067.
Use more opportunities of the NPBFX analytical portal:E-book
If you just recently started to be interested in trading on FOREX and would like to deepen your knowledge, an electronic Beginner's Guide to FOREX Trading will be an excellent helper for you here. The book consists of 5 chapters and reflects fundamental concepts of the foreign exchange market to start successful trading. From the main chapters of the E-book you can learn about the concepts and history of FOREX, currencies and trend lines, technical indicators, types of orders, trading on news, psychology of trading, risk management and much more.
You can read a Beginner's guide to FOREX Trading online or download it free of charge from the NPBFX analytical portal in the "Education" section. In order to get unlimited access to the E-book and other useful instruments on the portal, you need to register on the NPBFX website.
If you have any questions about trading instruments, you can always ask an analyst in the online chat on the portal and get a free consultation of an experienced specialist.
Use the current recommendations of analysts on USD/CAD and trade efficiently with NPBFX.