NPBFX - making money with us since 1996!

EUR/USD: the euro is strengthening 07.08.2019

Good afternoon, dear forum visitors!

NPBFX offers the latest release of analytics on EUR/USD for a better understanding of the current market situation and more efficient trading.

Current trend

EUR showed ambiguous trading against USD yesterday. It maintained an upward trend only at the opening of the afternoon session and increased slightly at the beginning of the American session. The reduction in the pair was due to technical factors, as the news background was almost unchanged. Investors are discussing the aggravation of the US-China trade conflict, which flows into a currency war. CNY fell against USD to its lowest level since 2008, which will weaken the negative effect of Washington's new import duties introduction. The market also expects a possible reduction in the interest rate by the Fed in September.

Tuesday’s macroeconomic statistics from Germany did not support EUR. Factory Orders in June increased significantly by 2.5% MoM after the decline by 2.0% MoM in the previous month, with the forecast of +0.5% MoM. In annual terms, the indicator decreased by 3.6% YoY, which is much better than –8.4% YoY last month.

Support and resistance

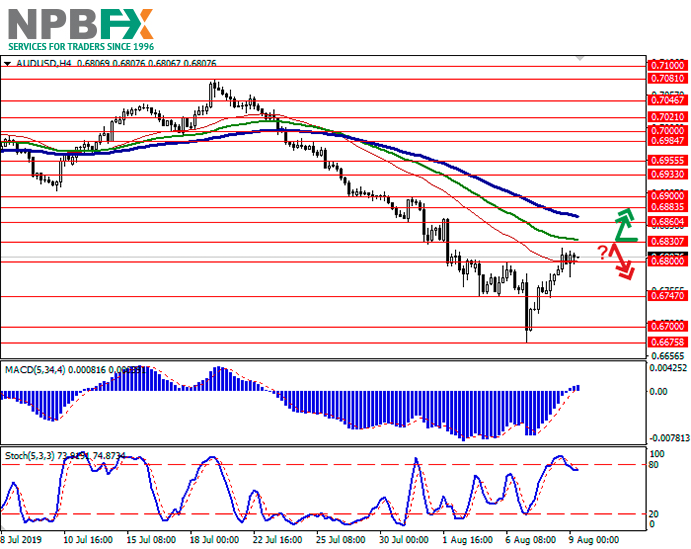
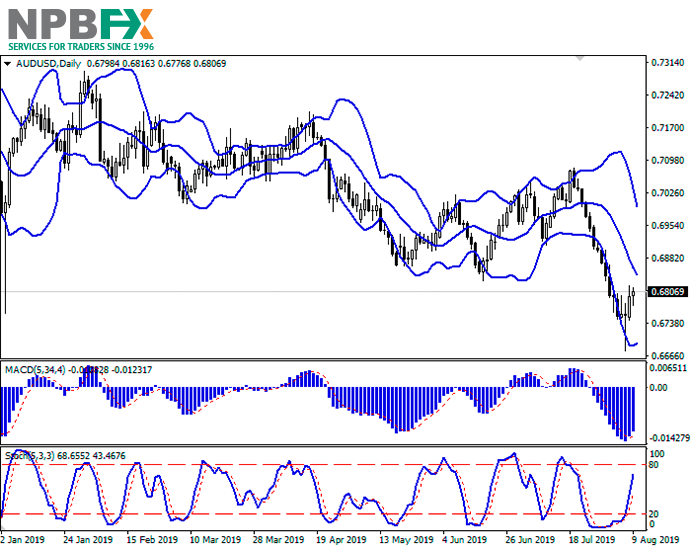
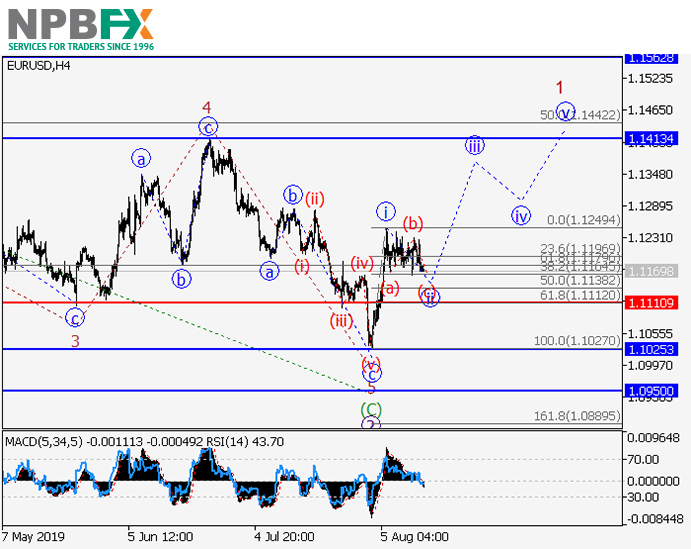
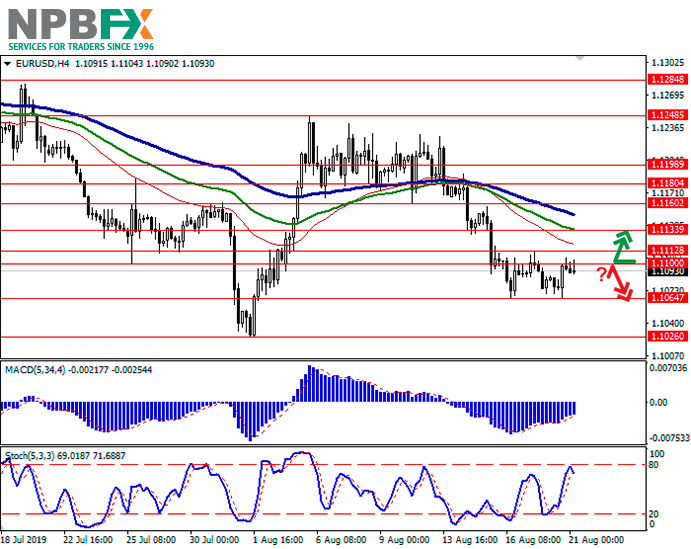
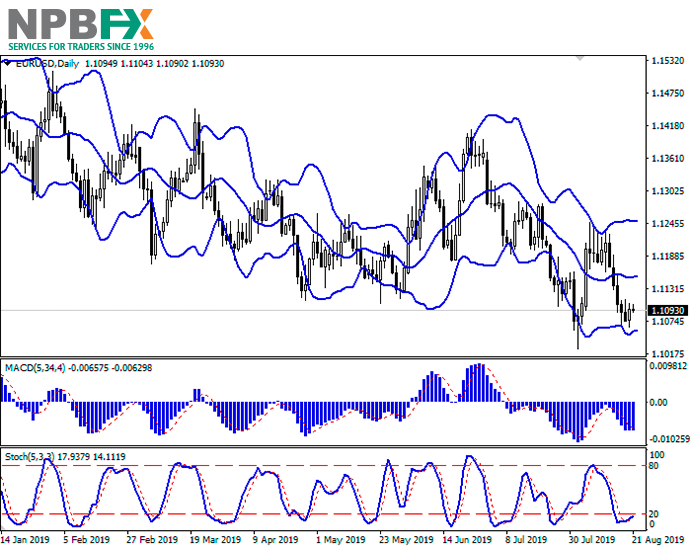
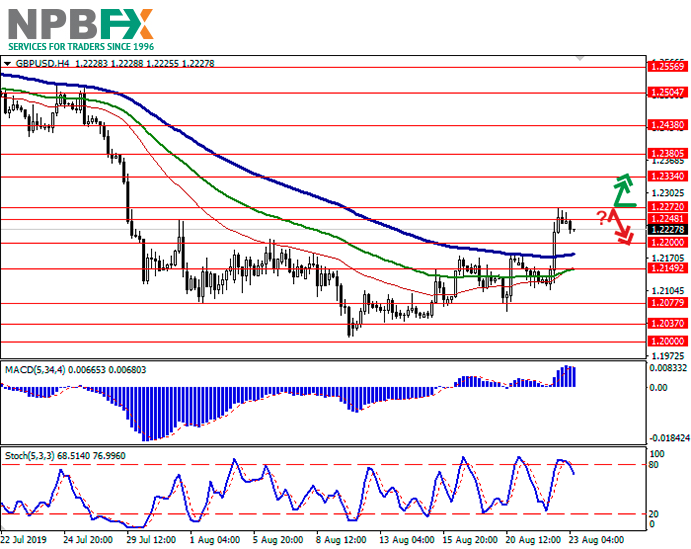
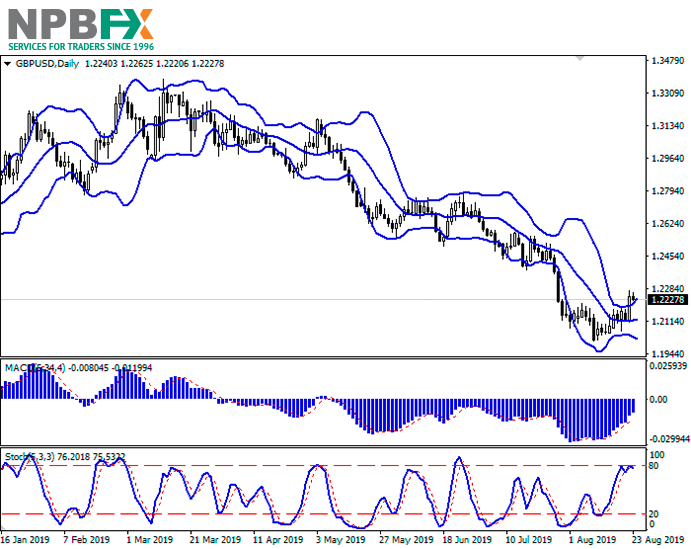
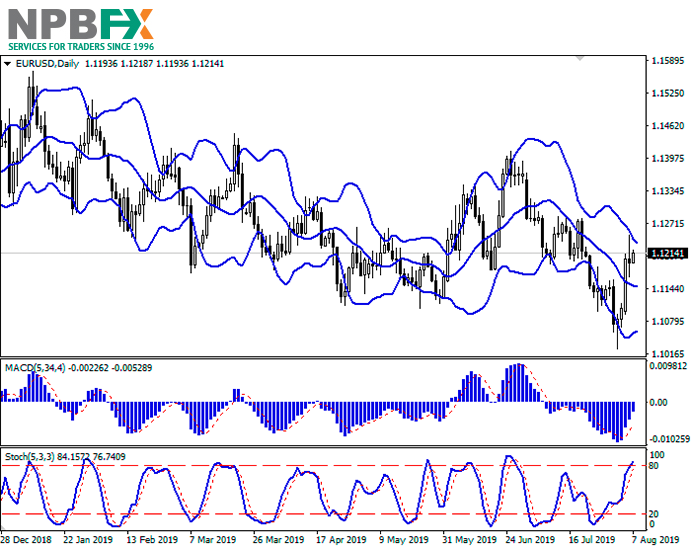
In the D1 chart, Bollinger Bands are reversing horizontally. The price range is narrowing, reflecting a sharp change of trend in the short term. MACD indicator is growing, keeping a stable buy signal (located above the signal line). Stochastic keeps the uptrend, but approaches its highs, which indicates the risks of overbought EUR in the ultra-short term.

Technical indicators do not contradict further development of the uptrend in the short and/or ultra-short term.

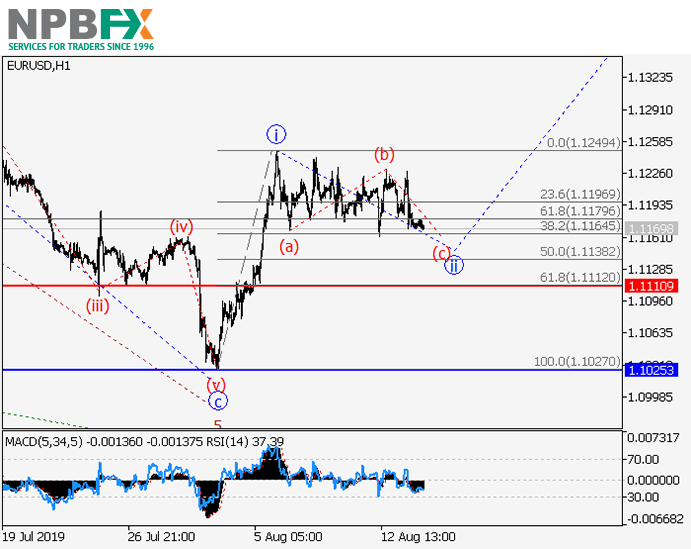
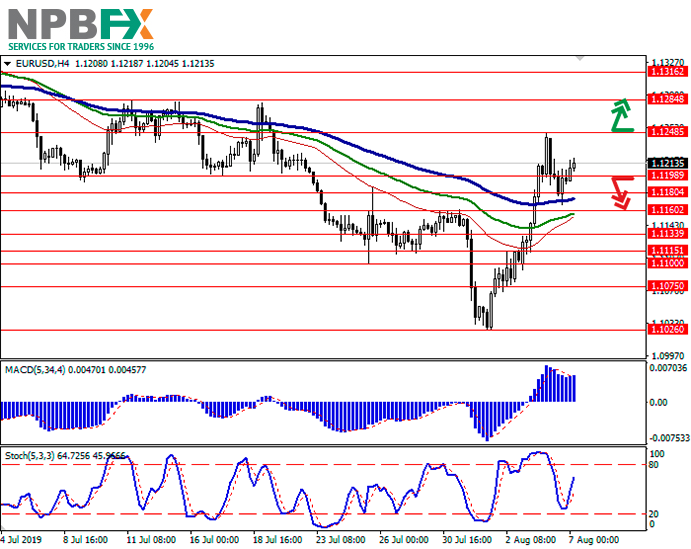
Resistance levels: 1.1248, 1.1284, 1.1316.

Support levels: 1.1198, 1.1180, 1.1160, 1.1133.

eur-3.png


eur-4.png


Trading tips

To open long positions, one can rely on the breakout of 1.1248. Take profit — 1.1316. Stop loss — 1.1220. Implementation time: 1-2 days.

A breakdown of 1.1198 or 1.1180 may be a signal to further sales with target at 1.1115 or 1.1100. Stop loss — 1.1220–1.1240. Implementation time: 2-3 days.

Use more opportunities of the NPBFX analytical portal: economic indicators

Regular monitoring of global economic indicators plays an important role in trading, because of their strong influence on FOREX market and possibility to provoke significant price fluctuations. For the convenience of traders the "Education" section on the NPBFX portal contains the most popular and significant world economic indices with a detailed description, their possible impact on the economy and exchange rates (GDP, consumer price index, unemployment rate, Nonfarm Payrolls (NFP), etc.).

If you have any questions about trading instruments, you can always ask an analyst in the online chat on the portal and get a free consultation of an experienced specialist.

Use the current recommendations of analysts on EUR/USD and trade efficiently with NPBFX.
 
AUD/USD: Australian dollar is correcting 09.08.2019

Good afternoon, dear forum visitors!

NPBFX offers the latest release of analytics on AUD/USD for a better understanding of the current market situation and more efficient trading.

Current trend

The Australian dollar rose significantly against the US currency on Thursday, continuing the development of the correctional impulse formed the day before. The instrument was supported by Chinese trade statistics, which, despite the continuing tensions between the US and China, showed an increase in July.

Today, the pair is trading in both directions. Investors are focused on the speech of the RBA Governor Philip Lowe and the comments of the Australian regulator on monetary policy. No concrete hints were expected from Lowe's speech on further easing of monetary policy, so the reaction of the market to it was very restrained. The head of the RBA noted the insufficiently rapid increase in inflation in the country, as well as the growth of external economic risks, primarily due to the deterioration of trade relations between China and the United States.

Support and resistance

Bollinger Bands in D1 chart demonstrate a stable decrease. The price range is narrowing, reflecting the correctional trend formation in the short term. MACD has reversed to growth having formed a strong buy signal (located above the signal line). Stochastic keeps its upward direction but is approaching its highs rapidly, which reflects risks of the overbought instrument in the ultra-short term.

Existing long positions should be kept until the situation clears up.

Resistance levels: 0.6830, 0.6860, 0.6883, 0.6900.

Support levels: 0.6800, 0.6747, 0.6700, 0.6675.

aud-3-1.png


aud-4-1.png


Trading tips

To open long positions, one can rely on the breakout of 0.6830. Take profit — 0.6933 or 0.6955. Stop loss — 0.6780.

The rebound from 0.6830 as from resistance with the subsequent breakdown of 0.6800 can become a signal to new sales with target at 0.6700 or 0.6675. Stop loss — 0.6840–0.6850.

Implementation time: 2-3 days.

Use more opportunities of the NPBFX analytical portal: weekly FOREX forecast

You can learn more about the current situation on AUD/USD and get acquainted with the weekly analytical forecast in the "Video reviews" section on the NPBFX portal. Weekly video reviews contain trends, key levels, trading recommendations for such popular instruments as EUR/USD, GBP/USD, USD/JPY, AUD/USD. In order to get free and unlimited access to video forecast and other useful instruments on the portal, you need to register on the NPBFX website.

If you have any questions about trading instruments, you can always ask an analyst in the online chat on the portal and get a free consultation of an experienced specialist.

Use the current recommendations of analysts on AUD/USD and trade efficiently with NPBFX.
 
USD/CAD: wave analysis 12.08.2019

Good afternoon, dear forum visitors!

NPBFX offers the latest release of analytics on USD/CAD for a better understanding of the current market situation and more efficient trading.

The pair may grow.

On the 4-hour chart, a downward correction of the higher level developed as the wave (2), and the formation of the wave (3) began. Now, the first wave of the lower level i of 1 of (3) is forming, within which the fifth wave (v) of i is developing. If the assumption is correct, the pair will grow to the levels of 1.3360–1.3432. In this scenario, critical stop loss level is 1.3176.

cad-3-1.png


cad-4-1.png


Main scenario

Long positions will become relevant during the correction, above the level of 1.3176 with the targets at 1.3360–1.3432. Implementation period: 7 days and more.

Alternative scenario

The breakout and the consolidation of the price below the level of 1.3176 will let the pair go down to the levels of 1.3012–1.2910.

Use more opportunities of the NPBFX analytical portal: economic calendar

Be ready for any market changes through global events using the economic calendar on the NPBFX portal. The calendar contains all the most important events of the world economy and prognoses for them. In order to get free and unlimited access to the economic calendar and other useful instruments on the portal, you need to pass a one-time registration on the NPBFX website.

If you have any questions about trading instruments, you can always ask an analyst in the online chat on the portal and get a free consultation of an experienced specialist.

Use the current recommendations of analysts on USD/CAD and trade efficiently with NPBFX.
 
EUR/USD: wave analysis 14.08.2019

Good afternoon, dear forum visitors!

NPBFX offers the latest release of analytics on EUR/USD for a better understanding of the current market situation and more efficient trading.

The pair is in a correction and may grow.

On the 4-hour chart, a downward correction of the higher level developed as the wave 2, within which the wave ( C ) of 2 formed. Now, the development of the third wave of the higher level 3 is beginning, within which the entry wave of the lower level i of 1 has formed, and the local correction ii of 1 is developing. If the assumption is correct, after the end of the correction, the pair will grow to the levels of 1.1413–1.1562. In this scenario, critical stop loss level is 1.1110.

eur-3-1.png


eur-4-1.png


Main scenario

Long positions will become relevant during the correction, above the level of 1.1110 with the targets at 1.1413–1.1562. Implementation period: 7 days and more.

Alternative scenario

The breakout and the consolidation of the price below the level of 1.1110 will let the pair go down to the levels of 1.1025–1.0950.

Use more opportunities of the NPBFX analytical portal: E-book

If you just recently started to be interested in trading on FOREX and would like to deepen your knowledge, an electronic Beginner's Guide to FOREX Trading will be an excellent helper for you here. The book consists of 5 chapters and reflects fundamental concepts of the foreign exchange market to start successful trading. From the main chapters of the E-book you can learn about the concepts and history of FOREX, currencies and trend lines, technical indicators, types of orders, trading on news, psychology of trading, risk management and much more.

You can read a Beginner's guide to FOREX Trading online or download it free of charge from the NPBFX analytical portal in the "Education" section. In order to get unlimited access to the E-book and other useful instruments on the portal, you need to register on the NPBFX website.

If you have any questions about trading instruments, you can always ask an analyst in the online chat on the portal and get a free consultation of an experienced specialist.

Use the current recommendations of analysts on EUR/USD and trade efficiently with NPBFX.
 
AUD/USD: wave analysis 16.08.2019

Good afternoon, dear forum visitors!

NPBFX offers the latest release of analytics on AUD/USD for a better understanding of the current market situation and more efficient trading.

The pair may grow.

On the daily chart, a correction of the higher level develops as the second wave 2 of (5), within which the wave b of 2 formed. Now, the development of the wave c of 2 is beginning, within which the first entry wave of the lower level i of (i) of c and the correction ii of (i) have formed. If the assumption is correct, the pair will grow to the levels of 0.7080–0.7205. In this scenario, critical stop loss level is 0.6674.

aud-3-2.png


aud-4-2.png


Main scenario

Long positions will become relevant during the correction, above the level of 0.6674 with the targets at 0.7080–0.7205. Implementation period: 7 days and more.

Alternative scenario

The breakout and the consolidation of the price below the level of 0.6674 will let the pair go down to the level of 0.6544.

Use more opportunities of the NPBFX analytical portal: analytics

You can find more actual analytical reviews on other popular currency pairs, metals and CFDs on the NPBFX online portal. Daily analytics with charts, current market prognoses and trading scenarios in the Feed section are available. Get free and unlimited access to the online portal after registering on the official website of NPBFX Company.

If you have any questions about trading instruments, you can always ask an analyst in the online chat on the portal and get a free consultation of an experienced specialist.

Use the current recommendations of analysts on AUD/USD and trade efficiently with NPBFX.
 
XAU/USD: gold consolidates 19.08.2019

Good afternoon, dear forum visitors!

NPBFX offers the latest release of analytics on XAU/USD for a better understanding of the current market situation and more efficient trading.

Current trend

On Friday, Gold prices fell, responding to a moderate increase in stock markets. The instrument was under additional pressure by the dollar, which grew despite the publication of controversial macroeconomic statistics and the threat of a recession in the US economy. However, the trade dispute between the United States and China contributed to the upward trend in gold, although the situation is not so clear. In particular, investors were optimistic about Donald Trump's statements that the trade conflict would not last long, since China was directly interested in concluding a final agreement.

Support and resistance

On the daily chart, Bollinger bands are growing steadily. The price range is narrowing, reflecting the emergence of ambiguous dynamics in the short term. The MACD indicator has reversed downwards, having formed a moderate sell signal (the histogram is below the signal line). Stochastic’s dynamic is similar, it retreats from its highs, indicating that the instrument is overbought in the short-term/short-term.

The development of correctional dynamics in the short and/or ultra-short term is possible.

Resistance levels: 1519.77, 1534.74, 1550.00.

Support levels: 1500.00, 1489.90, 1474.61, 1452.66.

xau-3.png


xau-4.png


Trading tips

Long positions can be opened after a rebound from the level of 1500.00 and a breakout of the level of 1519.77 with the target at 1550.00 or 1565.00. Stop loss is 1500.00.

Short positions can be opened after the breakdown of the level of 1500.00 with the target at 1452.66. Stop loss is 1519.77.
Implementation period: 2–3 days.

Use more opportunities of the NPBFX analytical portal: trading signals for commodities.

How can a trader determine if it’s worth buying or selling XAU/USD now or better waiting for a more favorable period? Use trading signals for commodities from the top 10 technical indicators on the NPBFX portal and make the right decisions! All registered users have free and unlimited access to the minutely updated trading signals (MA10, BBands, Ichimoku, Stochastic, ZigZag, etc.) for Gold, Silver, Brent and WTI Crude oil.

If you have any questions about trading instruments, you can always ask an analyst in the online chat on the portal and get a free consultation of an experienced specialist.

Use the current recommendations of analysts on XAU/USD and trade efficiently with NPBFX.
 
EUR/USD: EUR is consolidating 21.08.2019

Good afternoon, dear forum visitors!

NPBFX offers the latest release of analytics on EUR/USD for a better understanding of the current market situation and more efficient trading.

Current trend

The euro showed moderate growth against the US dollar on Tuesday, interrupting the development of the "bearish" trend that formed on August 13. The growth of the European currency was largely technical, since the macroeconomic background remained fairly neutral, and the old drivers remained in the spotlight of investors.

The German data on the producer price index published yesterday reflected a moderate increase of 0.1% MoM after a decrease of 0.4% MoM last month. YoY, production inflation slowed down from 1.2% to 1.1%, which met market expectations. European data on production volumes in the construction sector in June showed zero dynamics in monthly terms after a decline of 0.46% in May. YoY, the indicator grew by 1%, which is slightly worse than the previous dynamics of 2%.

Support and resistance

Bollinger Bands in the D1 chart demonstrate flat dynamics. The price range also remains fixed in a very wide range. MACD is reversing upwards preserving a sell signal (being located under the signal line). Stochastic is showing similar dynamics, preparing to leave its lower area with a buy signal.

One should look at the possibility of developing a full-fledged uptrend at the end of the week.

Resistance levels: 1.1100, 1.1112, 1.1133, 1.1160.

Support levels: 1.1064, 1.1026.

eur-3-2.png


eur-4-2.png


Trading tips

To open long positions, one can rely on the breakout of 1.1100–1.1112. Take profit – 1.1180 or 1.1198. Stop loss – 1.1075–1.1064.
A rebound from 1.1100, as from resistance, followed by a breakdown of 1.1075–1.1064, may become a signal for sales with the target at 1.1000. Stop loss – 1.1100.

Implementation period: 2-3 days.

Use more opportunities of the NPBFX analytical portal: glossary

Beginning traders certainly face a lot of specialized concepts and lexicon on FOREX, which are often not fully been understood. Swap, tick, hedge, margin calls are often unfamiliar to beginning traders. But the lack of knowledge of these fundamentals make a competent market vision impossible. So glossary on the NPBFX analytical portal could be an excellent helper in this case, which contains all the main definitions with explanations in a compact and accessible form. All concepts are arranged in alphabetical order, so that you can easily and quickly find and explore a new concept for yourself.

If you have any questions about trading instruments, you can always ask an analyst in the online chat on the portal and get a free consultation of an experienced specialist.

Use the current recommendations of analysts on EUR/USD and trade efficiently with NPBFX.
 
GBP/USD: GBP is correcting 23.08.2019

Good afternoon, dear forum visitors!

NPBFX offers the latest release of analytics on GBP/USD for a better understanding of the current market situation and more efficient trading.

Current trend

The pound has appreciably strengthened against the US dollar on Thursday, but today again returned to decline. Strong support for the British currency was provided by the comments of German Chancellor Angela Merkel, who recalled that there is time until the end of October to conclude a deal between the UK and the EU. Earlier, French President Emmanuel Macron expressed a tougher stance, emphasizing that the EU does not intend to revise the provision on the backstop of the Irish border. He believes that only minor changes are possible in the text of the final agreement. Additional pressure on the pound on Thursday was put by the published CBI report on retail. Sales in August fell by 49% MoM to their lowest levels since December 2008. Analysts had expected a decline of only 11%.

Support and resistance

Bollinger Bands in the D1 chart demonstrate flat dynamics. The price range is expanding, however, it fails to catch the development of corrective growth. MACD indicator is growing preserving a stable buy signal (the histogram is above the signal line). Stochastic, approaching the level of 80, is again inclined to reverse down, signaling the growing risks of the overbought pound in the ultra-short term.
The showings of the indicators do not contradict the further development of the upward trend in the short and/or ultra-short term.

Resistance levels: 1.2248, 1.2272, 1.2334, 1.2380.

Support levels: 1.2200, 1.2149, 1.2077, 1.2037.

gdp-3.png


gbp-4.png


Trading tips

To open long positions, one can rely on the breakout of 1.2272. Take profit – 1.2400 or 1.2438. Stop loss – 1.2200.

A rebound from 1.2272, as from resistance, followed by a breakdown of 1.2200, may become a signal for returning to the sales with the target at 1.2077 or 1.2037. Stop loss – 1.2250–1.2272.

Implementation period: 2-3 days.

Use more opportunities of the NPBFX analytical portal: economic indicators

Regular monitoring of global economic indicators plays an important role in trading, because of their strong influence on FOREX market and possibility to provoke significant price fluctuations. For the convenience of traders the "Education" section on the NPBFX portal contains the most popular and significant world economic indices with a detailed description, their possible impact on the economy and exchange rates (GDP, consumer price index, unemployment rate, Nonfarm Payrolls (NFP), etc.).

If you have any questions about trading instruments, you can always ask an analyst in the online chat on the portal and get a free consultation of an experienced specialist.

Use the current recommendations of analysts on GBP/USD and trade efficiently with NPBFX.
 
USD/CAD: the pair is trading ambiguously 26.08.2019

Good afternoon, dear forum visitors!

NPBFX offers the latest release of analytics on USD/CAD for a better understanding of the current market situation and more efficient trading.

Current trend

On Friday, the USD/CAD pair fell due to a massive weakening of the US dollar after a speech by Fed Chairman Jerome Powell at the Jackson Hole Symposium. Powell noted the regulator’s readiness for new stimulation measures but stressed that he did not know the timing of their introduction, partially referring to the growth of uncertainty in the global economy.

Macroeconomic publications contributed to the development of negative dynamics in the instrument. Thus, US New Home Sales in July fell by 12.8% MoM after growth of 20.9% mom in June. In turn, the dynamics of retail sales in Canada in June was zero after a decrease of 0.2% mom last month. Analysts had expected a decline of –0.1% MoM. June Retail Sales excluding automobiles increased by 0.9% MoM after a decline of 0.4% MoM last month.

Support and resistance

On the daily chart, Bollinger Bands smoothly reverse in a horizontal plane. The price range is trying to consolidate, reflecting the ambiguous dynamics of trading in the short term. The MACD decreases, keeping a poor sell signal (the histogram is below the signal line). Stochastic reversed in a horizontal plane, located approximately in the center of its working area.

To open new trading positions for the instrument, it is better to wait for new signals from technical indicators.

Resistance levels: 1.3320, 1.3343, 1.3401.

Support levels: 1.3264, 1.3241, 1.3200, 1.3163.

cad-3-2.png


cad-4-2.png


Trading tips

Long positions can be opened after the breakout of 1.3320 or 1.3343 with the target at 1.3401 or 1.3430. Stop loss is 1.3290–1.3280.

Short positions can be opened after the breakdown of 1.3264–1.3241 with the target at 1.3163. Stop loss is no further than 1.3300.

Implementation period: 2–3 days.

Use more opportunities of the NPBFX analytical portal: weekly FOREX forecast

You can learn more about the current situation on USD/CAD and get acquainted with the weekly analytical forecast in the "Video reviews" section on the NPBFX portal. Weekly video reviews contain trends, key levels, trading recommendations for such popular instruments as EUR/USD, GBP/USD, USD/JPY, AUD/USD. In order to get free and unlimited access to video forecast and other useful instruments on the portal, you need to register on the NPBFX website.

If you have any questions about trading instruments, you can always ask an analyst in the online chat on the portal and get a free consultation of an experienced specialist.

Use the current recommendations of analysts on USD/CAD and trade efficiently with NPBFX.
 
XAG/USD: silver prices rise 28.08.2019

Good afternoon, dear forum visitors!

NPBFX offers the latest release of analytics on XAG/USD for a better understanding of the current market situation and more efficient trading.

Current trend

Yesterday, silver prices rose sharply, renewing record highs from April 2017. The growth in demand was facilitated by the departure of investors into shelter assets amid a sharp increase in uncertainty in the process of trade negotiations between the US and China. Earlier this week, Trump announced the imminent resumption of negotiations, stressing that the Chinese side is interested in it. On Tuesday, the market did not receive confirmation of Trump's words, which made traders return to negative forecasts, including the development of a recession in the global economy.

The instrument is also supported by the possibility of further lowering the interest rate of the US Federal Reserve, as the Fed head Jerome Powell reminded, speaking at the Jackson Hole symposium at the end of last week.

Support and resistance

On the daily chart, Bollinger bands grow steadily. The price range actively expands but not as fast as the "bullish" moods develop. MACD grows, keeping a strong buy signal (the histogram is above the signal line). Stochastic reached its highs and reversed into a horizontal plane, signaling that the instrument is strongly overbought in the ultra-short term.

To open new trading positions, it is better to wait until the signals are clear and keep a part of the current long positions in the ultra-short term.

Resistance levels: 18.31, 18.46, 18.62.

Support levels: 18.00, 17.87, 17.65, 17.48, 17.38.

xag-3.png


xag-4.png


Trading tips

Long positions can be opened after the breakout of 18.31–18.46 with the target at 19.00. Stop loss is 18.10–18.00.

Short positions can be opened after a rebound from 18.31 and the breakdown of 18.00 with the targets at 17.48–17.38 or 17.21. Stop loss is 18.31.

Implementation period: 2–3 days.

Use more opportunities of the NPBFX analytical portal: trading signals for commodities

How can a trader determine if it’s worth buying or selling XAG/USD now or better waiting for a more favorable period? Use trading signals for commodities from the top 10 technical indicators on the NPBFX portal and make the right decisions! All registered users have free and unlimited access to the minutely updated trading signals (MA10, BBands, Ichimoku, Stochastic, ZigZag, etc.) for Gold, Silver, Brent and WTI Crude oil.

If you have any questions about trading instruments, you can always ask an analyst in the online chat on the portal and get a free consultation of an experienced specialist.

Use the current recommendations of analysts on XAG/USD and trade efficiently with NPBFX.
 
Back
Top