Antony_NPBFX
NPBFX Representative (unconfirmed)
- Messages
- 1,093
EUR/USD: the euro is strengthening 04.11.2019
Good afternoon, dear forum visitors!
NPBFX offers the latest release of analytics on EUR/USD for a better understanding of the current market situation and more efficient trading.
Current trend
EUR rose against USD on Friday, reacting to the publication of contradictory macroeconomic statistics from the US. Nonfarm Payrolls in October rose by 128K after an increase by 180K in the previous month. Experts expected the growth by 89K only. Average Hourly Earnings in October maintained its previous growth rate of 3% YoY, as experts had predicted. In monthly terms, the indicator increased by 0.2% MoM after zero dynamics in September. Market forecasts suggested growth of 0.3% MoM. The Unemployment Rate in October expectedly increased from 3.5% to 3.6%. Markit Manufacturing PMI fell from 51.5 to 51.3 points in October. ISM Manufacturing PMI grew from 47.8 to 48.3 points, which nevertheless turned out to be worse than the forecast of 48.9 points.
Today, the pair maintains an uptrend. On Monday, investors are focused on European statistics on Markit Manufacturing PMI.
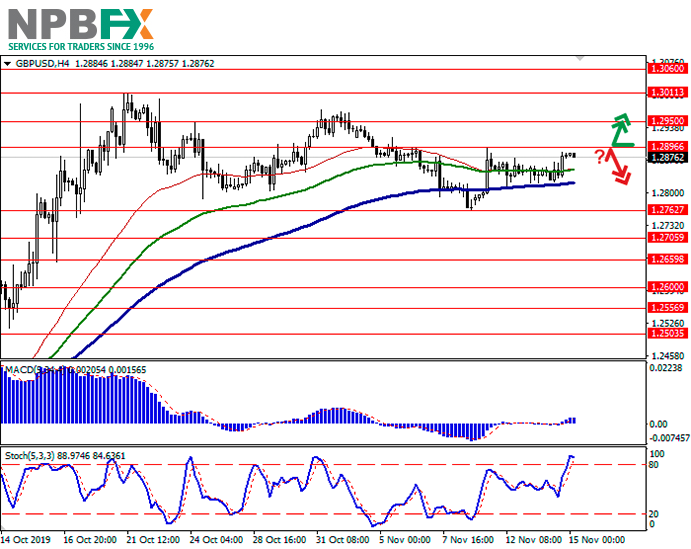
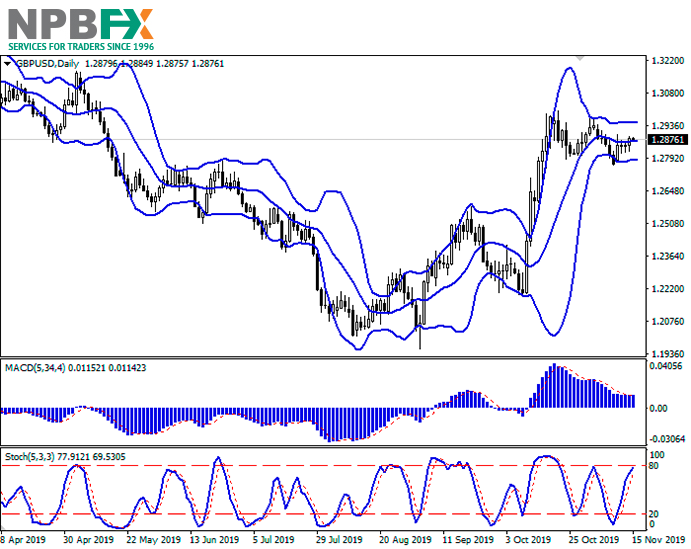
Support and resistance
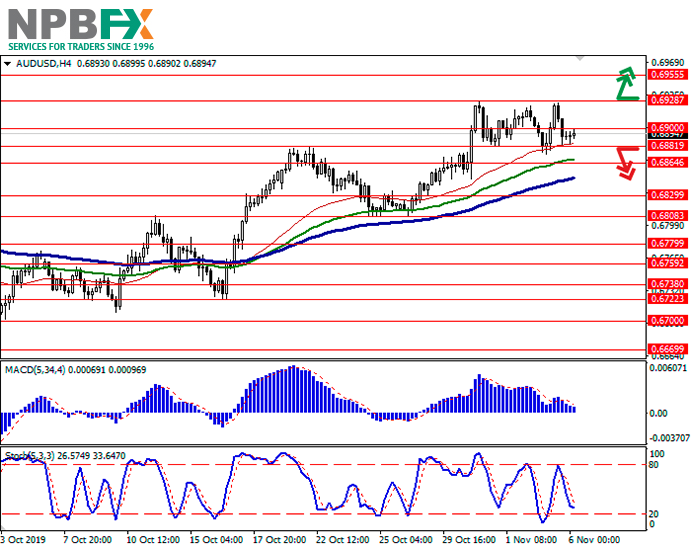
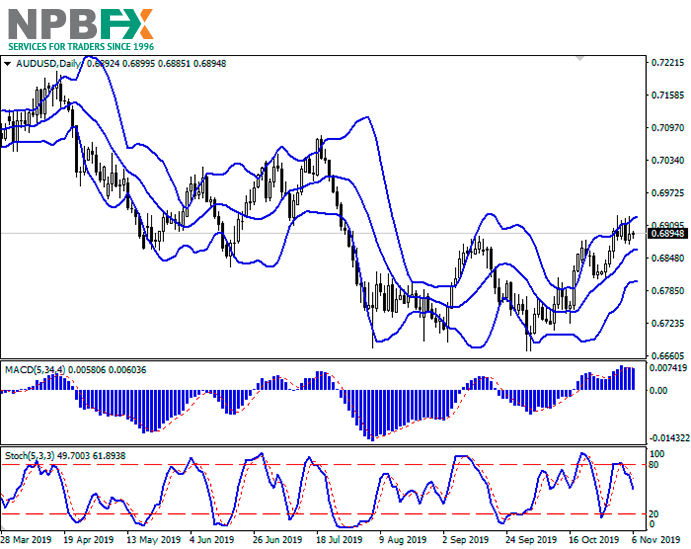
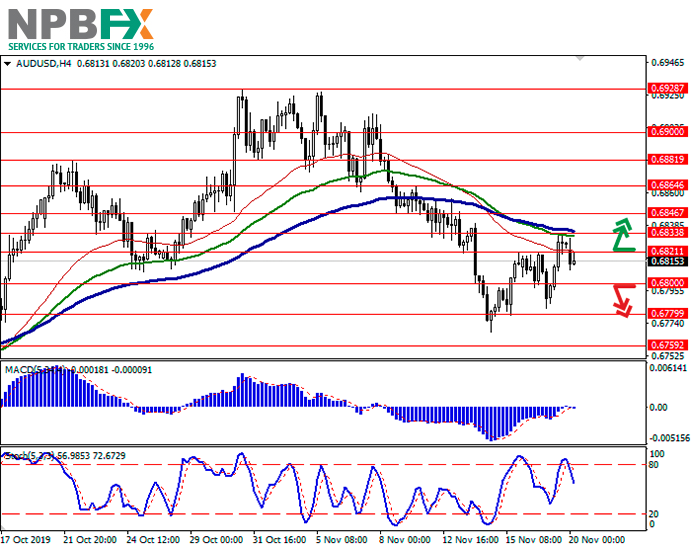
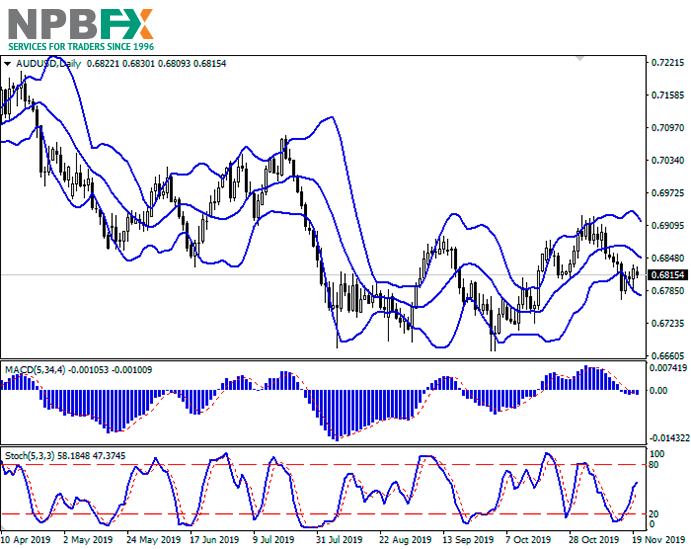
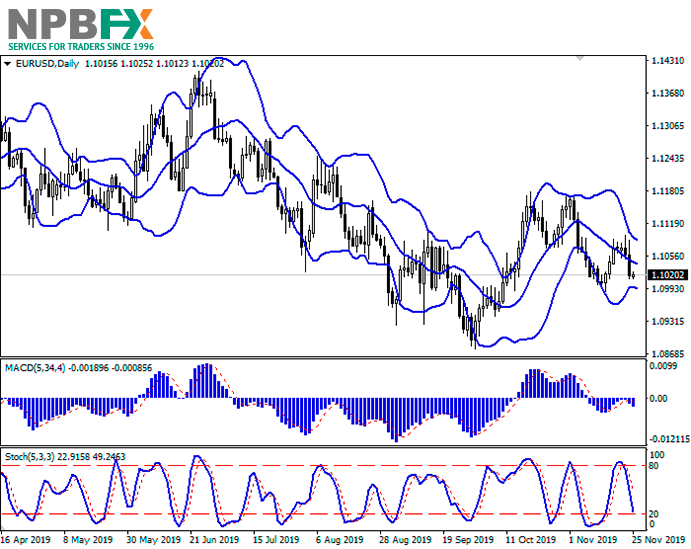
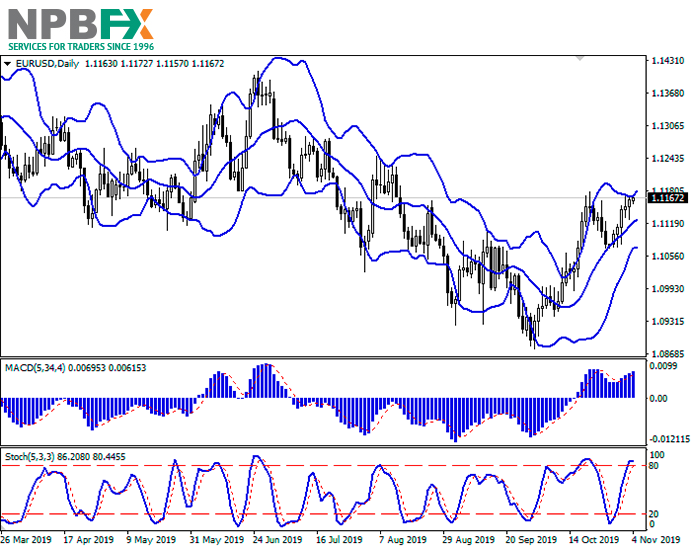
Bollinger Bands in D1 chart show active growth. The price range expands actively, freeing a path to new local highs for the “bulls”. MACD indicator is growing, keeping a stable buy signal (located above the signal line). Stochastic, having approached its highs, reversed into a horizontal plane, indicating the overbought euro in the ultra-short term.
Existing long positions should be kept until the situation clears up.
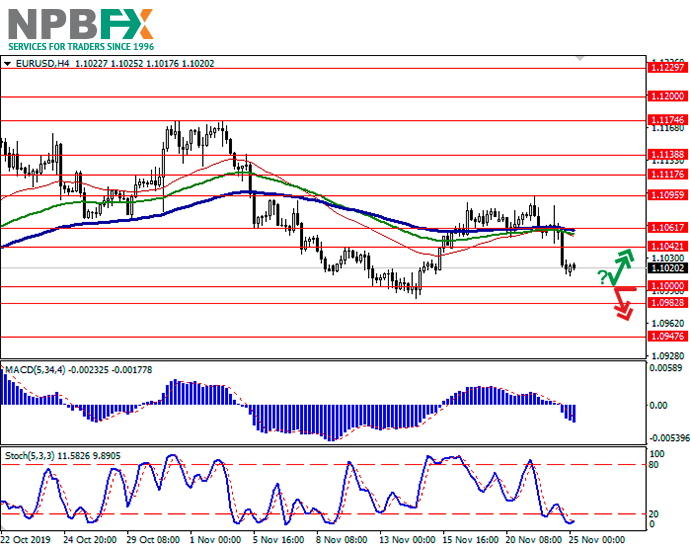
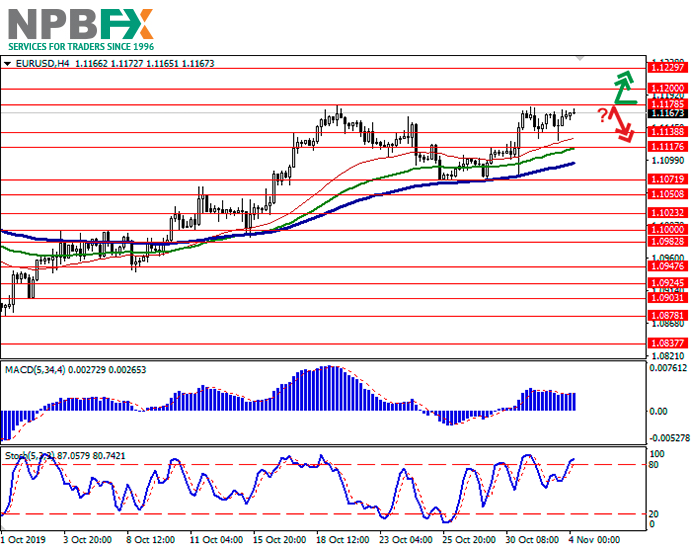
Resistance levels: 1.1178, 1.1200, 1.1229, 1.1248.
Support levels: 1.1138, 1.1117, 1.1071, 1.1050.
Trading tips
To open long positions, one can rely on the breakout of 1.1178. Take profit – 1.1248. Stop loss – 1.1138.
The rebound from 1.1178 as from resistance with the subsequent breakdown of 1.1138 can become a signal to new sales with target at 1.1071 or 1.1050. Stop loss – 1.1178.
Implementation time: 2-3 days.
Use more opportunities of the NPBFX analytical portal: E-book
If you just recently started to be interested in trading on FOREX and would like to deepen your knowledge, an electronic Beginner's Guide to FOREX Trading will be an excellent helper for you here. The book consists of 5 chapters and reflects fundamental concepts of the foreign exchange market to start successful trading. From the main chapters of the E-book you can learn about the concepts and history of FOREX, currencies and trend lines, technical indicators, types of orders, trading on news, psychology of trading, risk management and much more.
You can read a Beginner's guide to FOREX Trading online or download it free of charge from the NPBFX analytical portal in the "Education" section. In order to get unlimited access to the E-book and other useful instruments on the portal, you need to register on the NPBFX website.
If you have any questions about trading instruments, you can always ask an analyst in the online chat on the portal and get a free consultation of an experienced specialist.
Use the current recommendations of analysts on EUR/USD and trade efficiently with NPBFX.
Good afternoon, dear forum visitors!
NPBFX offers the latest release of analytics on EUR/USD for a better understanding of the current market situation and more efficient trading.
Current trend
EUR rose against USD on Friday, reacting to the publication of contradictory macroeconomic statistics from the US. Nonfarm Payrolls in October rose by 128K after an increase by 180K in the previous month. Experts expected the growth by 89K only. Average Hourly Earnings in October maintained its previous growth rate of 3% YoY, as experts had predicted. In monthly terms, the indicator increased by 0.2% MoM after zero dynamics in September. Market forecasts suggested growth of 0.3% MoM. The Unemployment Rate in October expectedly increased from 3.5% to 3.6%. Markit Manufacturing PMI fell from 51.5 to 51.3 points in October. ISM Manufacturing PMI grew from 47.8 to 48.3 points, which nevertheless turned out to be worse than the forecast of 48.9 points.
Today, the pair maintains an uptrend. On Monday, investors are focused on European statistics on Markit Manufacturing PMI.
Support and resistance
Bollinger Bands in D1 chart show active growth. The price range expands actively, freeing a path to new local highs for the “bulls”. MACD indicator is growing, keeping a stable buy signal (located above the signal line). Stochastic, having approached its highs, reversed into a horizontal plane, indicating the overbought euro in the ultra-short term.
Existing long positions should be kept until the situation clears up.
Resistance levels: 1.1178, 1.1200, 1.1229, 1.1248.
Support levels: 1.1138, 1.1117, 1.1071, 1.1050.
Trading tips
To open long positions, one can rely on the breakout of 1.1178. Take profit – 1.1248. Stop loss – 1.1138.
The rebound from 1.1178 as from resistance with the subsequent breakdown of 1.1138 can become a signal to new sales with target at 1.1071 or 1.1050. Stop loss – 1.1178.
Implementation time: 2-3 days.
Use more opportunities of the NPBFX analytical portal: E-book
If you just recently started to be interested in trading on FOREX and would like to deepen your knowledge, an electronic Beginner's Guide to FOREX Trading will be an excellent helper for you here. The book consists of 5 chapters and reflects fundamental concepts of the foreign exchange market to start successful trading. From the main chapters of the E-book you can learn about the concepts and history of FOREX, currencies and trend lines, technical indicators, types of orders, trading on news, psychology of trading, risk management and much more.
You can read a Beginner's guide to FOREX Trading online or download it free of charge from the NPBFX analytical portal in the "Education" section. In order to get unlimited access to the E-book and other useful instruments on the portal, you need to register on the NPBFX website.
If you have any questions about trading instruments, you can always ask an analyst in the online chat on the portal and get a free consultation of an experienced specialist.
Use the current recommendations of analysts on EUR/USD and trade efficiently with NPBFX.