NPBFX - making money with us since 1996!

USD/JPY: USD is strengthening 27.11.2019

Good afternoon, dear forum visitors!

NPBFX offers the latest release of analytics on USD/JPY for a better understanding of the current market situation and more efficient trading.

Current trend

USD is strengthening against JPY during today’s Asian session, adding about 0.08%. USD is supported by optimistic news regarding the process of trade negotiations between the US and China, which contribute to increased demand for risky assets. The day before, the Ministry of Commerce of China reiterated that telephone calls between the parties “have made progress in resolving a number of issues”. However, as before, no specific information was received, and the market can only guess when exactly Washington and Beijing plan to sign a preliminary trade agreement.

With the opening of the American session, investors expect the publication of macroeconomic statistics from the United States. Among other things, the market expects the release of data on the dynamics of Personal Consumption, Pending Home Sales, annual data on GDP for Q3 2019 and statistics on Personal Expense and Income for October.

Support and resistance

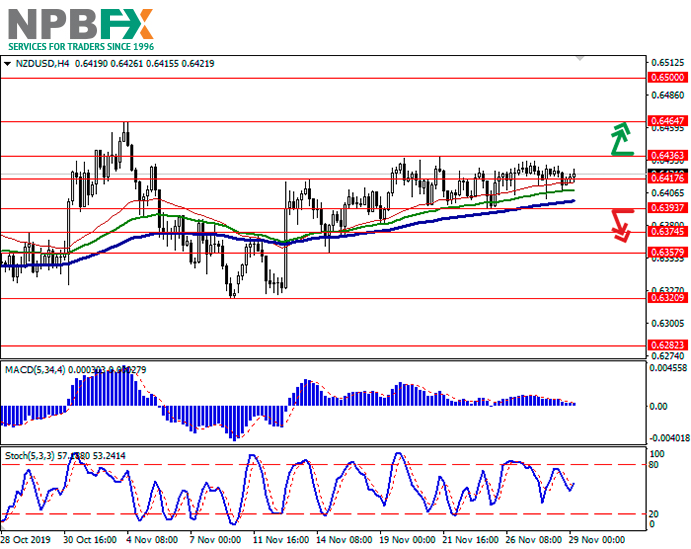
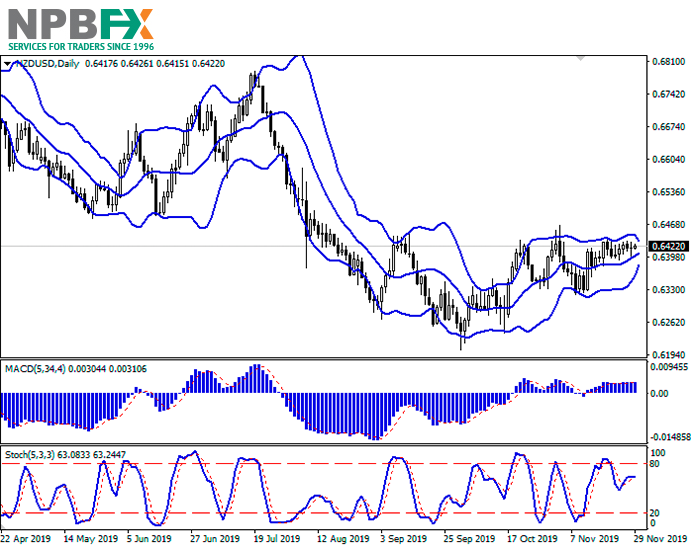
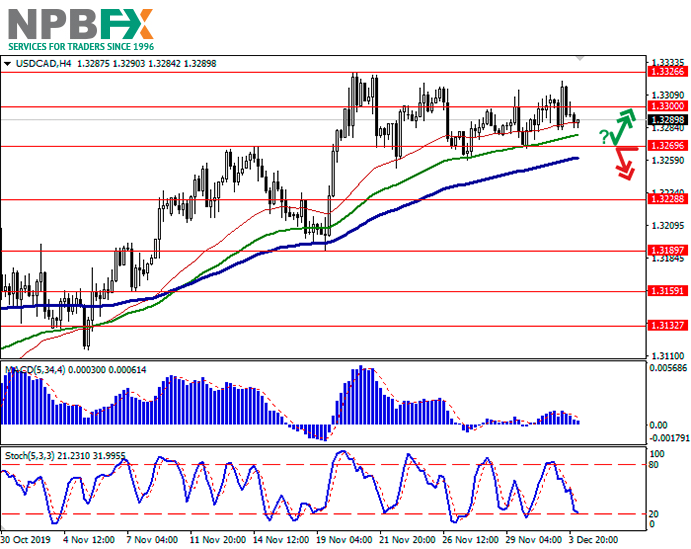
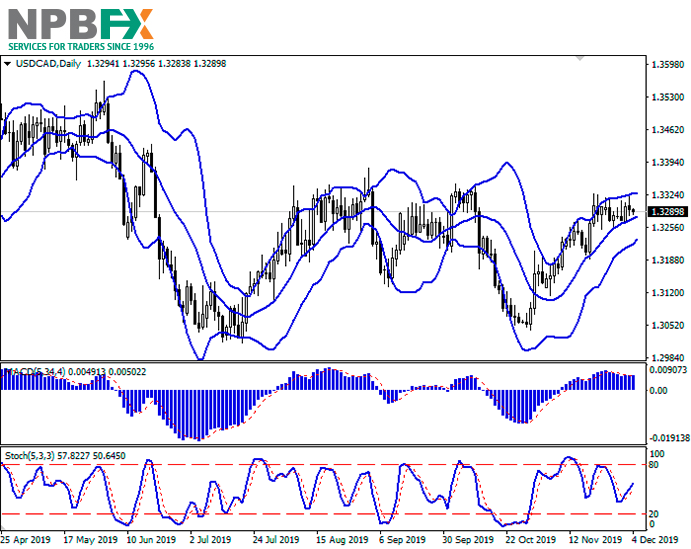
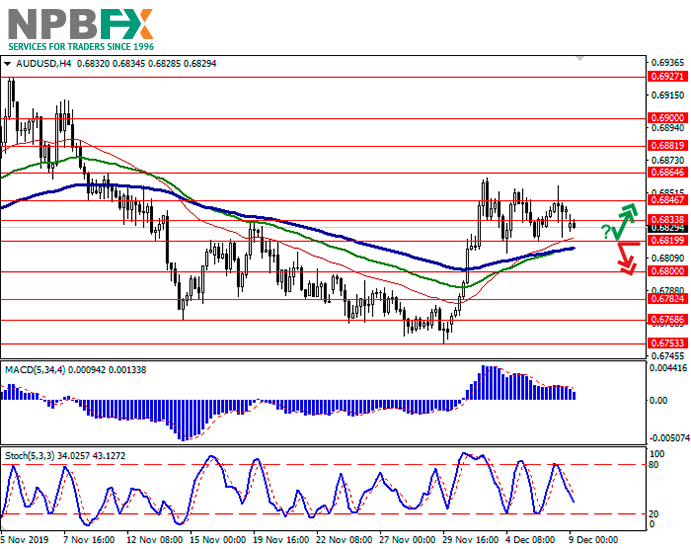
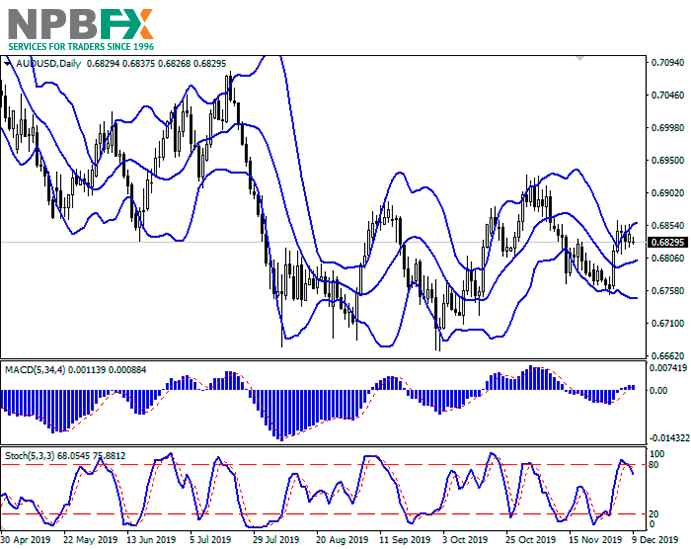
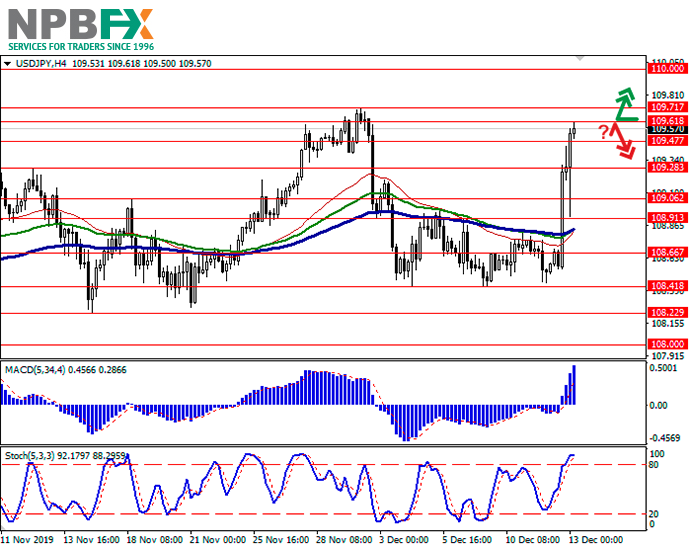
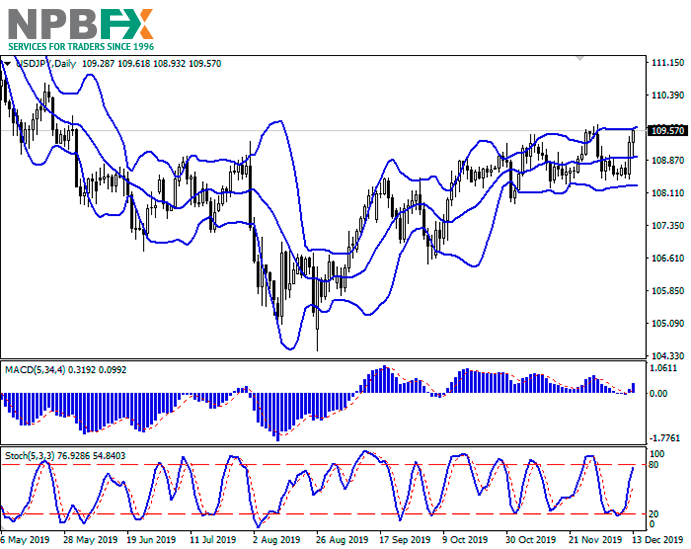
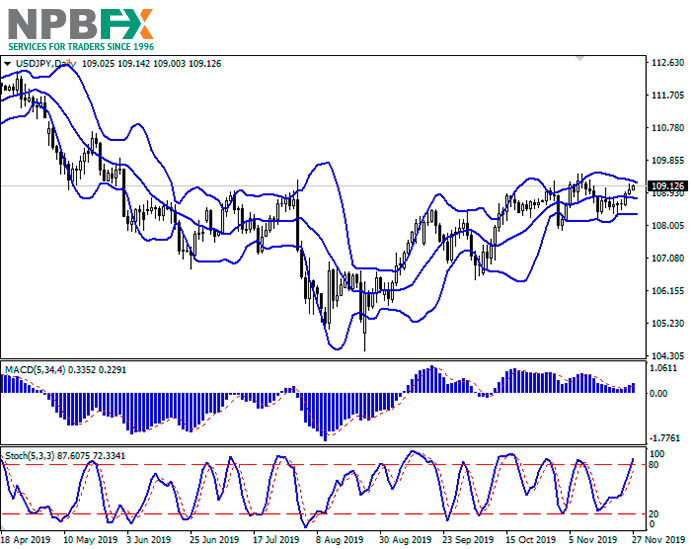
Bollinger Bands in the D1 chart demonstrate flat dynamics. The price range is slightly narrowing, failing to keep up with the development of the “bullish” trend in the short term. MACD indicator is growing preserving a moderate buy signal (located above the signal line). Stochastic retains an uptrend but is located in close proximity to its highs, which indicates the instrument’s overbought in the ultra-short term.

One should keep existing long positions in the short and/or ultra-short term.

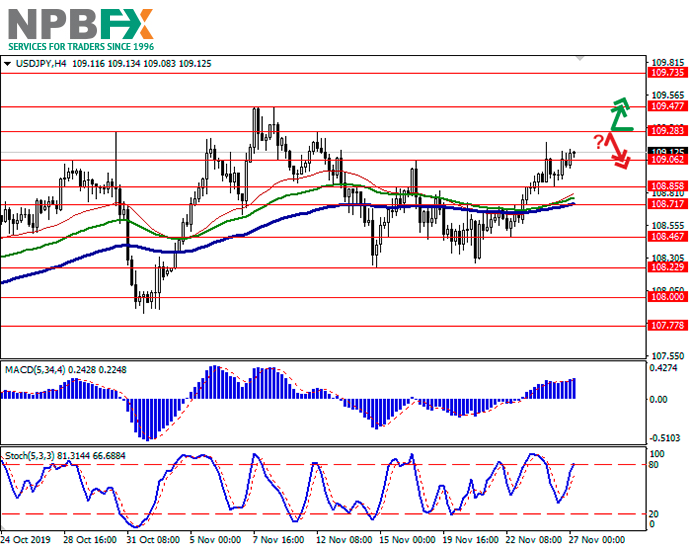
Resistance levels: 109.28, 109.47, 109.73, 110.00.

Support levels: 109.06, 108.85, 108.71, 108.46.

jpy-3-2.png


jpy-4-2.png


Trading tips

To open long positions, one can rely on the breakout of 109.28. Take profit – 109.73 or 110.00. Stop loss – 109.06 or 108.85.

A rebound from 109.28 as from resistance, followed by a breakdown of 109.06 or 109.00 may become a signal to new sales with the target at 108.46. Stop loss – 109.30 or 109.40.

Implementation time: 2-3 days.

Use more opportunities of the NPBFX analytical portal: economic indicators

Regular monitoring of global economic indicators plays an important role in trading, because of their strong influence on FOREX market and possibility to provoke significant price fluctuations. For the convenience of traders the "Education" section on the NPBFX portal contains the most popular and significant world economic indices with a detailed description, their possible impact on the economy and exchange rates (GDP, consumer price index, unemployment rate, Nonfarm Payrolls (NFP), etc.).

If you have any questions about trading instruments, you can always ask an analyst in the online chat on the portal and get a free consultation of an experienced specialist.

Use the current recommendations of analysts on USD/JPY and trade efficiently with NPBFX.
 
NZD/USD: the pair is trading in the flat 29.11.2019

Good afternoon, dear forum visitors!

NPBFX offers the latest release of analytics on NZD/USD for a better understanding of the current market situation and more efficient trading.

Current trend

NZD is trading upwards during today’s Asian session, adding about 0.1%. The growth of the instrument is facilitated by technical factors that are exacerbated by closed due to Thanksgiving markets in the US. At the same time, the news from the USA turns out to be alarming. Donald Trump signed two new laws aimed at supporting civil protest in Hong Kong. The first law limits the supply of weapons to disperse the protesters, and the second one gives the US the right to evaluate and confirm China’s observance of Hong Kong’s special status. Investors fear that these steps may complicate the already tense situation with the negotiations. In addition, Washington may introduce new import duties against China in December if the deal is not signed.

Slight support for the instrument on Friday is provided by the data on Consumer Confidence from New Zealand. According to data from Roy Morgan, in November Consumer Confidence index rose from 118 to 121 points.

Support and resistance

Bollinger Bands in D1 chart grow steadily. The price range is narrowing, reflecting ambiguous trading dynamics in the short term. MACD is slightly declining keeping a weak sell signal (located below the signal line). Stochastic reversed into the horizontal plane after a short growth, indicating an approximate balance of power in the ultra-short term.

To open new positions, it is necessary to wait for the signals from technical indicators to be clarified.

Resistance levels: 0.6436, 0.6464, 0.6500.

Support levels: 0.6417, 0.6393, 0.6374, 0.6357.

nzd-3-1.png


nzd-4-1.png


Trading tips

To open long positions, one can rely on the breakout of 0.6436. Take profit – 0.6500. Stop loss – 0.6400.

A breakdown of 0.6393 may be a signal for new sales with target at 0.6340 or 0.6320. Stop loss – 0.6425.

Implementation time: 2-3 days.

Use more opportunities of the NPBFX analytical portal: weekly FOREX forecast

You can learn more about the current situation on NZD/USD and get acquainted with the weekly analytical forecast in the "Video reviews" section on the NPBFX portal. Weekly video reviews contain trends, key levels, trading recommendations for such popular instruments as EUR/USD, GBP/USD, USD/JPY, AUD/USD. In order to get free and unlimited access to video forecast and other useful instruments on the portal, you need to register on the NPBFX website.

If you have any questions about trading instruments, you can always ask an analyst in the online chat on the portal and get a free consultation of an experienced specialist.

Use the current recommendations of analysts on NZD/USD and trade efficiently with NPBFX.
 
Brent Crude Oil: prices decrease 02.12.2019

Good afternoon, dear forum visitors!

NPBFX offers the latest release of analytics on Brent Crude Oil for a better understanding of the current market situation and more efficient trading.

Current trend

Today, during the Asian session, oil prices are stable, consolidating after declining by almost 4% during the trading session last Friday. The markets reacted violently to the news of the resignation of Iraqi Prime Minister Adil Abdul-Mahdi after several weeks of protests, which significantly influenced forecasts of oil supplies to the world market. However, the resignation of the prime minister does not mean the end of all protests, so the volatility of the "black gold" is likely to remain high.

Investors are also focusing on the upcoming OPEC+ meeting at the end of the week. The cartel is expected to announce the extension of the current agreement to reduce oil production by 1.2 million barrels per day. Negativity to the upcoming meeting adds Russia, whose oil companies are in favor of maintaining current quotas for oil production.

Support and resistance

On the daily chart, Bollinger bands move flat. The price range remains virtually unchanged but is spacious enough for the current level of activity in the market. The MACD indicator goes down, maintaining a strong sell signal (the histogram is below the signal line). Stochastic is declining steadily, quickly approaching its lows, which signals that the instrument is oversold in the ultra-short term.

It is better to keep the current short positions in the short and/or ultra-short term until the market situation is clarified.

Resistance levels: 62.33, 62.95, 63.50, 64.00.

Support levels: 62.00, 61.29, 60.84, 60.00.

oil-3.png


oil-4.png


Trading tips

Long positions may be opened after the breakout of 62.33 with the target at 63.50. Stop loss – 61.50. Implementation period: 2–3 days.

Short positions may be opened after a rebound from 62.33 and a breakdown of 62.00 with the target at 60.84. Stop loss – 62.50–62.60. Implementation period: 1–2 days.

Use more opportunities of the NPBFX analytical portal: trading signals for commodities

How can a trader determine if it’s worth buying or selling Brent Crude Oil now or better waiting for a more favorable period? Use trading signals for commodities from the top 10 technical indicators on the NPBFX portal and make the right decisions! All registered users have free and unlimited access to the minutely updated trading signals (MA10, BBands, Ichimoku, Stochastic, ZigZag, etc.) for Gold, Silver, Brent and WTI Crude oil.

If you have any questions about trading instruments, you can always ask an analyst in the online chat on the portal and get a free consultation of an experienced specialist.

Use the current recommendations of analysts on Brent Crude Oil and trade efficiently with NPBFX.
 
USD/CAD: the pair is adjusted 04.12.2019

Good afternoon, dear forum visitors!

NPBFX offers the latest release of analytics on USD/CAD for a better understanding of the current market situation and more efficient trading.

Current trend

Today, during the Asian session, the USD/CAD pair is falling, losing about 0.05%. The instrument is developing a “bearish” impulse, formed yesterday under the influence of poor macroeconomic statistics, as well as general correctional sentiments regarding the US currency. Investors are concerned about Washington’s new import duties against Brazil and Argentina, as well as the possible delay in signing a trade agreement with China to November 2020, when the US presidential election will be held.

During the day, traders expect the publication of business activity indexes in the US services sector for November. Following the poor Manufacturing PMI data released on Monday, forecasts for the growth of the US dollar on Service PMI data are very restrained. Also, the market is focused on the monetary policy decision of the Bank of Canada with accompanying comments. It is expected that the interest rate will be maintained at the current level of 1.75%.

Support and resistance

On the daily chart, Bollinger bands grow moderately. The price range narrows, reflecting the appearance of ambiguous dynamics in the short term. MACD falls, having formed a poor sell signal (the histogram is below the signal line). Stochastic, by contrast, moderately grows and practically does not respond to the appearance of correctional dynamics.

To open new trading positions, it is better to wait until the situation is clear.

Resistance levels: 1.3300, 1.3326, 1.3347.

Support levels: 1.3269, 1.3228, 1.3189, 1.3159.

cad-3.png


cad-4.png


Trading tips

Long positions may be opened after a rebound from 1.3269 and a breakout of 1.3300 with the targets at 1.3347–1.3360. Stop loss – 1.3269.

Short positions may be opened after the breakdown of 1.3269 with the targets at 1.3228–1.3200. Stop loss – 1.3300.

Implementation period: 2–3 days.

Use more opportunities of the NPBFX analytical portal: economic calendar

Be ready for any market changes through global events using the economic calendar on the NPBFX portal. The calendar contains all the most important events of the world economy and prognoses for them. In order to get free and unlimited access to the economic calendar and other useful instruments on the portal, you need to pass a one-time registration on the NPBFX website.

If you have any questions about trading instruments, you can always ask an analyst in the online chat on the portal and get a free consultation of an experienced specialist.

Use the current recommendations of analysts on USD/CAD and trade efficiently with NPBFX.
 
XAU/USD: gold prices have stabilized 06.12.2019

Good afternoon, dear forum visitors!

NPBFX offers the latest release of analytics on XAU/USD for a better understanding of the current market situation and more efficient trading.

Current trend

Gold prices are stable during today’s Asian session, trading near 1475.00. Gold quotes have changed little recently since investors expect the situation to develop in a trade conflict between the United States and China. Earlier this week, information appeared that the conclusion of the agreement may have to be postponed to November 2020, when the next presidential election will be held in the United States. Donald Trump later reiterated that “negotiations are going well,” and moderate optimism gradually began to return to the markets. However, there is little time left until December 15, and new import duties, if they are introduced by the USA, will almost certainly put an end to the current progress in the negotiations and everything will have to be started from scratch.

Support and resistance

In the D1 chart, Bollinger Bands are reversing horizontally. The price range remains virtually unchanged, limiting the development of the “bullish” sentiment in the ultra-short term. MACD indicator is growing preserving a weak buy signal (located above the signal line). Stochastic, having reached the level of “80”, demonstrates weak correctional dynamics, indicating the possibility of developing a full-fledged downtrend in the nearest time intervals.

It is necessary to wait for the additional signals from technical indicators to open short positions.

Resistance levels: 1481.44, 1486.81, 1493.88, 1500.00.

Support levels: 1471.15, 1464.48, 1455.93, 1449.81.

xau-3.png


xau-4.png


Trading tips

To open long positions, one can rely on the breakout of 1481.44. Take profit – 1500.00. Stop loss – 1471.15.

A breakdown of 1471.15 may be a signal for new sales with target at 1455.93 or 1449.81. Stop loss – 1481.44.

Implementation time: 2-3 days.

Use more opportunities of the NPBFX analytical portal: trading signals for commodities

How can a trader determine if it’s worth buying or selling XAU/USD now or better waiting for a more favorable period? Use trading signals for commodities from the top 10 technical indicators on the NPBFX portal and make the right decisions! All registered users have free and unlimited access to the minutely updated trading signals (MA10, BBands, Ichimoku, Stochastic, ZigZag, etc.) for Gold, Silver, Brent and WTI Crude oil.

If you have any questions about trading instruments, you can always ask an analyst in the online chat on the portal and get a free consultation of an experienced specialist.

Use the current recommendations of analysts on XAU/USD and trade efficiently with NPBFX.
 
AUD/USD: the instrument is consolidating 09.12.2019

Good afternoon, dear forum visitors!

NPBFX offers the latest release of analytics on AUD/USD for a better understanding of the current market situation and more efficient trading.

Current trend

AUD is trading near the opening level (0.6829) against USD during today's Asian session. Investors are in no hurry to open new trading positions, preferring to wait for new drivers to appear at the market. Monday's macroeconomic background is rather scarce, but on Tuesday there will be a lot of interesting statistics from Australia and China. On Wednesday, the United States will be in the spotlight with the publication of November statistics on Consumer Inflation and the Fed meeting.

In the meantime, investors are taking a lead from the publication of a strong US labor market report for November last Friday. Nonfarm Payrolls in November increased by 266K after the growth by 156K in the previous month. Analysts had expected an increase of 180K.

Support and resistance

Bollinger Bands in D1 chart show moderate growth. The price range expands slightly, freeing a path to new local highs for the “bulls”. MACD indicator is growing preserving a weak buy signal (located above the signal line). Stochastic reversed downwards, pointing to the risks of a corrective decline in the ultra-short term.

It is worth looking into the possibility of corrective decline in the short and/or ultra-short term.

Resistance levels: 0.6833, 0.6846, 0.6864, 0.6881.

Support levels: 0.6819, 0.6800, 0.6782, 0.6768.

aud-3.png


aud-4.png


Trading tips

To open long positions, one can rely on the rebound from the support level of 0.6819, with the subsequent breakout of 0.6833. Take profit – 0.6864 or 0.6881. Stop loss – 0.6810 or 0.6800.

A breakdown of 0.6819 may be a signal for new sales with target at 0.6782 or 0.6768. Stop loss – 0.6846.

Implementation time: 2-3 days.

Use more opportunities of the NPBFX analytical portal: E-book

If you just recently started to be interested in trading on FOREX and would like to deepen your knowledge, an electronic Beginner's Guide to FOREX Trading will be an excellent helper for you here. The book consists of 5 chapters and reflects fundamental concepts of the foreign exchange market to start successful trading. From the main chapters of the E-book you can learn about the concepts and history of FOREX, currencies and trend lines, technical indicators, types of orders, trading on news, psychology of trading, risk management and much more.

You can read a Beginner's guide to FOREX Trading online or download it free of charge from the NPBFX analytical portal in the "Education" section. In order to get unlimited access to the E-book and other useful instruments on the portal, you need to register on the NPBFX website.

If you have any questions about trading instruments, you can always ask an analyst in the online chat on the portal and get a free consultation of an experienced specialist.

Use the current recommendations of analysts on AUD/USD and trade efficiently with NPBFX.
 
EUR/USD: EUR is corrected 11.12.2019

Good afternoon, dear forum visitors!

NPBFX offers the latest release of analytics on EUR/USD for a better understanding of the current market situation and more efficient trading.

Current trend

EUR is relatively stable against USD during today’s Asian session. The instrument is trading near the level of 1.1096, a local high of December 6 updated the day before. Moderate growth of the instrument on Tuesday was facilitated by rather optimistic European macroeconomic statistics. ZEW Economic Sentiment in December increased from –1 to 11.2 points, which turned out to be much better than expectations (–17.7 points). Investors were pleased with the German data from ZEW. German ZEW Current Conditions in December rose from –24.7 to –19.9 points, which turned out to be better than the forecasts at –22.3 points. German ZEW Economic Sentiment for the same period rose from –2.1 to 10.7 points, while the growth forecast was only to zero.

Today, investors expect the publication of statistics from the US on consumer inflation. The key event on Wednesday will be the Fed meeting on interest rates followed by a press conference.

Support and resistance

Bollinger Bands in D1 chart show moderate growth. The price range expands from above, freeing a path to new local highs for the “bulls”. MACD indicator is growing preserving a moderate buy signal (located above the signal line). Stochastic is reversing upwards after quite an active decline at the end of last week.

Technical indicators do not contradict the further development of the uptrend in the short and/or ultra-short term.

Resistance levels: 1.1096, 1.1115, 1.1139.

Support levels: 1.1080, 1.1062, 1.1038, 1.1024.

eur-3.png


eur-4.png


Trading tips

To open long positions, one can rely on the breakout of 1.1096. Take profit – 1.1139 or 1.1150. Stop loss – 1.1062.

The rebound from 1.1096 as from resistance, with the subsequent breakdown of 1.1080 can become a signal to new sales with target at 1.1038 or 1.1024. Stop loss – 1.1105 or 1.1115.

Implementation time: 2-3 days.

Use more opportunities of the NPBFX analytical portal: analytics

You can find more actual analytical reviews on other popular currency pairs, metals and CFDs on the NPBFX online portal. Daily analytics with charts, current market prognoses and trading scenarios in the Feed section are available. Get free and unlimited access to the online portal after registering on the official website of NPBFX Company.

If you have any questions about trading instruments, you can always ask an analyst in the online chat on the portal and get a free consultation of an experienced specialist.

Use the current recommendations of analysts on EUR/USD and trade efficiently with NPBFX.
 
USD/JPY: USD is strengthening 13.12.2019

Good afternoon, dear forum visitors!

NPBFX offers the latest release of analytics on USD/JPY for a better understanding of the current market situation and more efficient trading.

Current trend

USD is growing during today’s Asian session, continuing the development of the “bullish” impulse formed yesterday. USD is adding about 0.28%, receiving support from the growing optimism regarding the prospects for a trade agreement between the US and China. Also, investors are reacting to the publication of the preliminary results of the British Parliamentary elections, where Boris Johnson’s party wins, which will allow to ratify the agreement with the EU in the near future.

JPY is under pressure from uncertain Japanese macroeconomic statistics. Industrial Production in Japan in October fell by 7.7% YoY after falling by 7.4% YoY in September. In monthly terms, production decreased by 4.5% MoM after a decrease of 4.2% a month earlier. Tankan Large Manufacturers Index in Q4 2019 fell from 5 to 0 points, with the forecast of 2 points.

Support and resistance

Bollinger Bands in D1 chart show insignificant growth. The price range is expanding from above, struggling to keep up with a surge of “bullish” sentiment. MACD indicator is growing preserving a stable buy signal (located above the signal line). Stochastic keeps a confident upward direction but is rapidly approaching its highs, which indicates the risks of overbought instrument in the ultra-short term.

Technical indicators do not contradict the further growth of the instrument in the short and/or ultra-short term.

Resistance levels: 109.61, 109.71, 110.00.

Support levels: 109.47, 109.28, 109.06, 108.91.

jpy-3.png


jpy-4.png


Trading tips

To open long positions, one can rely on the breakout of 109.61 or 109.71. Take profit – 110.00. Stop loss – 109.47 or 109.40. Implementation time: 1-2 days.

The rebound from 109.61 as from resistance, with the subsequent breakdown of 109.47, can become a signal to new sales with target at 109.06 or 108.91. Stop loss – 109.71. Implementation time: 2-3 days.

Use more opportunities of the NPBFX analytical portal: glossary

Beginning traders certainly face a lot of specialized concepts and lexicon on FOREX, which are often not fully been understood. Swap, tick, hedge, margin calls are often unfamiliar to beginning traders. But the lack of knowledge of these fundamentals make a competent market vision impossible. So glossary on the NPBFX analytical portal could be an excellent helper in this case, which contains all the main definitions with explanations in a compact and accessible form. All concepts are arranged in alphabetical order, so that you can easily and quickly find and explore a new concept for yourself.

If you have any questions about trading instruments, you can always ask an analyst in the online chat on the portal and get a free consultation of an experienced specialist.

Use the current recommendations of analysts on USD/JPY and trade efficiently with NPBFX.
 
Brent Crude Oil: oil prices rise 16.12.2019

Good afternoon, dear forum visitors!

NPBFX offers the latest release of analytics on Brent Crude Oil for a better understanding of the current market situation and more efficient trading.

Current trend

On Friday, oil prices rose moderately, reacting to confirmation of a trade agreement between the United States and China. US President Donald Trump commented on the news on Twitter, noting that the parties had already begun discussions within the framework of the “second stage” of the agreement. In addition, Washington has canceled the introduction of import duties on Chinese goods since December 15.

However, the instrument failed to consolidate in the new local highs, and by the time the afternoon session closed, it had lost most of its positions. The development of correctional dynamics was facilitated by the published Baker Hughes report on active oil platforms in the USA, which reflected the increase in the number of operating rigs in the USA from 663 to 667 units per week.

Support and resistance

On the daily chart, Bollinger bands are growing moderately. The price range is actively expanding, letting “bulls” renew local highs. The MACD indicator is growing, maintaining a poor buy signal (the histogram is above the signal line). Stochastic is reversing upwards after a short downward correction, reacting to the return of "bullish" sentiment to the market at the end of last trading week.

Current readings of the technical indicators do not contradict the further development of upward dynamics in the short and/or ultra-short term.

Resistance levels: 65.56, 66.00, 66.21.

Support levels: 65.00, 64.62, 64.00, 63.50.

oil-3-1.png


oil-4-1.png


Trading tips

Long positions may be opened after the breakout of the level of 65.56 with the targets at 66.21–66.50. Stop loss – 65.00. Implementation period: 1–2 days.

Short positions may be opened after the breakdown of the level of 65.00 with the target at 64.00 or 63.50. Stop loss – 65.56. Implementation period: 2–3 days.

Use more opportunities of the NPBFX analytical portal: trading signals for commodities

How can a trader determine if it’s worth buying or selling Brent Crude Oil now or better waiting for a more favorable period? Use trading signals for commodities from the top 10 technical indicators on the NPBFX portal and make the right decisions! All registered users have free and unlimited access to the minutely updated trading signals (MA10, BBands, Ichimoku, Stochastic, ZigZag, etc.) for Gold, Silver, Brent and WTI Crude oil.

If you have any questions about trading instruments, you can always ask an analyst in the online chat on the portal and get a free consultation of an experienced specialist.

Use the current recommendations of analysts on Brent Crude Oil and trade efficiently with NPBFX.
 
USD/CHF: the dollar remains under pressure 18.12.2019

Good afternoon, dear forum visitors!

NPBFX offers the latest release of analytics on USD/CHF for a better understanding of the current market situation and more efficient trading.

Current trend

Today, during the Asian session, the USD/CHF pair is growing slightly (+0.05%), correcting after a steady yesterday’s decline, which led to the renewal of local lows of August 27. Tuesday’s US macroeconomic statistics failed to provide appreciable support to the instrument, while the franc reacted positively to the appearance of information on the EU trade balance for October.

During the day, investors expect the publication of a block of data on consumer inflation in the EU for November and the release of the quarterly report of the National Bank of Switzerland with a review for the fourth quarter. There will be few key statistics from the United States, and only speeches by representatives of the US Federal Reserve will be in the spotlight, which are unlikely to affect the prospects for the monetary policy of the regulator next year.

Support and resistance

On the daily chart, Bollinger bands steadily decline. The price range narrows, reflecting the slowdown of the “bearish” dynamics in the short term. MACD also slows down the downward trend, while maintaining the sell signal (the histogram is below the signal line). Stochastic, responding to a surge of "bearish" sentiment on Tuesday, maintains a strong downward trend and is close to its lows, which signals that USD is oversold in the very short term.

It is better to keep the current short positions until the situation becomes clear.

Resistance levels: 0.9832, 0.9867, 0.9889, 0.9909.

Support levels: 0.9794, 0.9767, 0.9730.

chf-3.png


chf-4.png


Trading tips

Long positions may be opened after a rebound from 0.9794 and a breakout of 0.9832 with the target at 0.9889 or 0.9909. Stop loss – 0.9794.

Short positions may be opened after the breakdown of 0.9794 with the target at 0.9730. Stop loss – 0.9832.

Implementation period: 2–3 days.

Use more opportunities of the NPBFX analytical portal: economic indicators

Regular monitoring of global economic indicators plays an important role in trading, because of their strong influence on FOREX market and possibility to provoke significant price fluctuations. For the convenience of traders the "Education" section on the NPBFX portal contains the most popular and significant world economic indices with a detailed description, their possible impact on the economy and exchange rates (GDP, consumer price index, unemployment rate, Nonfarm Payrolls (NFP), etc.).

If you have any questions about trading instruments, you can always ask an analyst in the online chat on the portal and get a free consultation of an experienced specialist.

Use the current recommendations of analysts on USD/CHF and trade efficiently with NPBFX.
 
Back
Top