Antony_NPBFX
NPBFX Representative (unconfirmed)
- Messages
- 1,094
USD/JPY: USD maintains an uptrend 07.02.2020
Good afternoon, dear forum visitors!
NPBFX offers the latest release of analytics on USD/JPY for a better understanding of the current market situation and more efficient trading.
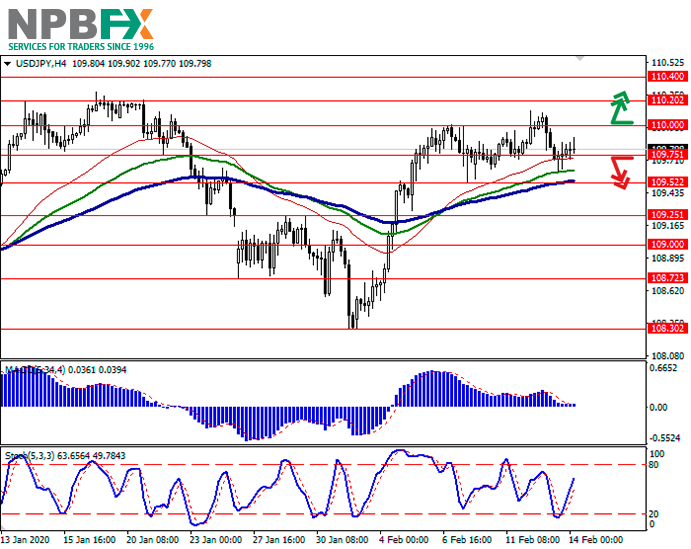
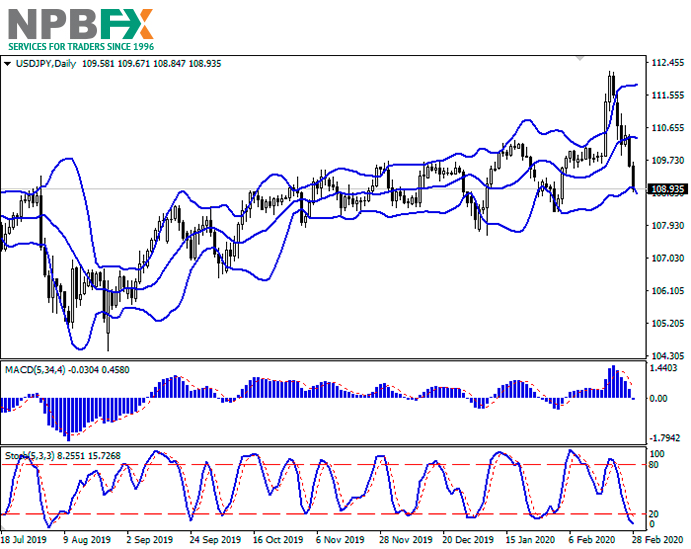
Current trend
USD is showing a slight decline against JPY during today's Asian session, correcting after strong growth since the beginning of the week, which led to the renewal of local highs on the instrument of January 22. USD decline is technical in nature, as traders take their long profits before the weekend.
Meanwhile, macroeconomic statistics from Japan remain mixed. Overall Household Spending in December 2019 decreased by 4.8% YoY after a decrease of 2% YoY in November. Analysts had expected a slight improvement in the dynamics of the indicator and a decrease of only 1.7% YoY. Coincident Index in December remained at the previous level of 94.7 points against the forecast of growth to 95.9 points. Leading Economic Index for the same period increased from 90.8 to 91.6 points, which turned out to be better than neutral market forecasts.
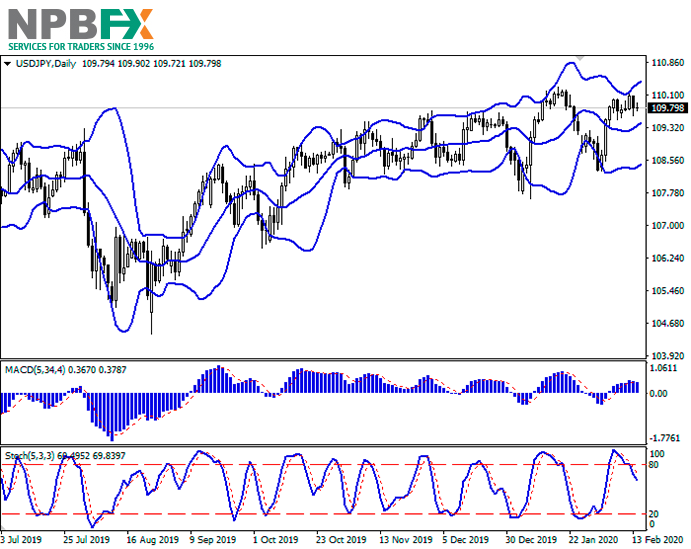
Support and resistance
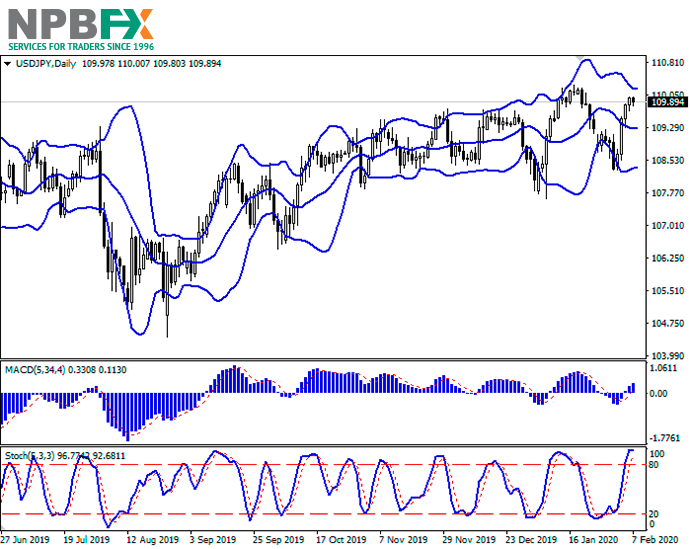
On the D1 chart, Bollinger Bands are reversing horizontally. The price range is trying to consolidate, but remains rather spacious for the current level of activity in the market. MACD indicator is growing preserving a stable buy signal (located above the signal line). Stochastic, having reached the level of 100, reversed into the horizontal plane, indicating strong overbought USD in the ultra-short term.
It is worth looking into the possibility of corrective decline in the short and/or ultra-short term.
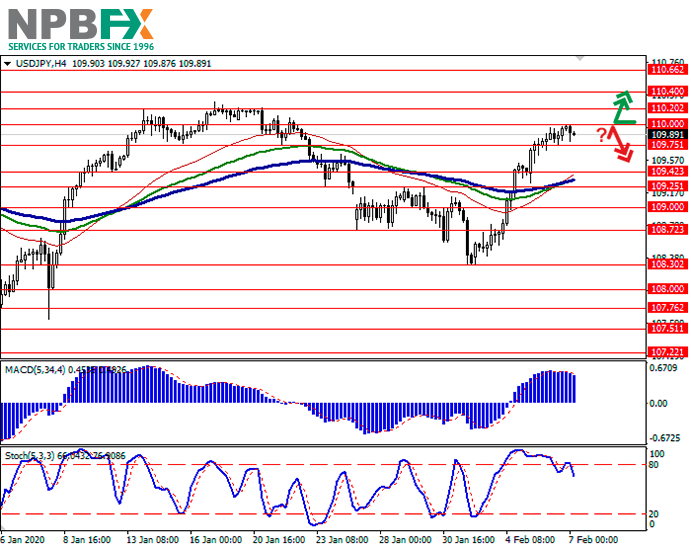
Resistance levels: 110.00, 110.20, 110.40, 110.66.
Support levels: 109.75, 109.42, 109.25, 109.00.
Trading tips
To open long positions, one can rely on the breakout of 110.00. Take profit – 110.40 or 110.50. Stop loss – 109.75 or 109.60. Implementation time: 1-2 days.
The rebound from 110.00 as from resistance, with the subsequent breakdown of 109.75, can become a signal to new sales with target at 109.25 or 109.00. Stop loss – 110.20. Implementation time: 2-3 days.
Use more opportunities of the NPBFX analytical portal: economic calendar
Be ready for any market changes through global events using the economic calendar on the NPBFX portal. The calendar contains all the most important events of the world economy and prognoses for them. In order to get free and unlimited access to the economic calendar and other useful instruments on the portal, you need to pass a one-time registration on the NPBFX website.
If you have any questions about trading instruments, you can always ask an analyst in the online chat on the portal and get a free consultation of an experienced specialist.
Use the current recommendations of analysts on USD/JPY and trade efficiently with NPBFX.
Good afternoon, dear forum visitors!
NPBFX offers the latest release of analytics on USD/JPY for a better understanding of the current market situation and more efficient trading.
Current trend
USD is showing a slight decline against JPY during today's Asian session, correcting after strong growth since the beginning of the week, which led to the renewal of local highs on the instrument of January 22. USD decline is technical in nature, as traders take their long profits before the weekend.
Meanwhile, macroeconomic statistics from Japan remain mixed. Overall Household Spending in December 2019 decreased by 4.8% YoY after a decrease of 2% YoY in November. Analysts had expected a slight improvement in the dynamics of the indicator and a decrease of only 1.7% YoY. Coincident Index in December remained at the previous level of 94.7 points against the forecast of growth to 95.9 points. Leading Economic Index for the same period increased from 90.8 to 91.6 points, which turned out to be better than neutral market forecasts.
Support and resistance
On the D1 chart, Bollinger Bands are reversing horizontally. The price range is trying to consolidate, but remains rather spacious for the current level of activity in the market. MACD indicator is growing preserving a stable buy signal (located above the signal line). Stochastic, having reached the level of 100, reversed into the horizontal plane, indicating strong overbought USD in the ultra-short term.
It is worth looking into the possibility of corrective decline in the short and/or ultra-short term.
Resistance levels: 110.00, 110.20, 110.40, 110.66.
Support levels: 109.75, 109.42, 109.25, 109.00.
Trading tips
To open long positions, one can rely on the breakout of 110.00. Take profit – 110.40 or 110.50. Stop loss – 109.75 or 109.60. Implementation time: 1-2 days.
The rebound from 110.00 as from resistance, with the subsequent breakdown of 109.75, can become a signal to new sales with target at 109.25 or 109.00. Stop loss – 110.20. Implementation time: 2-3 days.
Use more opportunities of the NPBFX analytical portal: economic calendar
Be ready for any market changes through global events using the economic calendar on the NPBFX portal. The calendar contains all the most important events of the world economy and prognoses for them. In order to get free and unlimited access to the economic calendar and other useful instruments on the portal, you need to pass a one-time registration on the NPBFX website.
If you have any questions about trading instruments, you can always ask an analyst in the online chat on the portal and get a free consultation of an experienced specialist.
Use the current recommendations of analysts on USD/JPY and trade efficiently with NPBFX.