Antony_NPBFX
NPBFX Representative (unconfirmed)
- Messages
- 1,089
USD/CAD: the instrument is consolidating 15.04.2020
Good afternoon, dear forum visitors!
NPBFX offers the latest release of analytics on USD/CAD for a better understanding of the current market situation and more efficient trading.
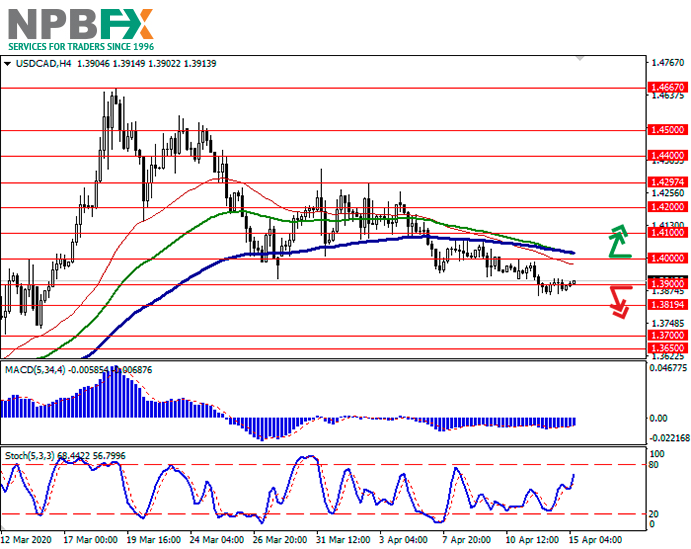
Current trend
USD is showing slight growth during today’s Asian session, trying to retreat from monthly lows updated earlier this week. USD remains under pressure amid some improvement in the prospects for combating coronavirus in Europe, as well as due to the publication of a large number of disappointing macroeconomic statistics from the US.
Today investors are focused on statistics on the dynamics of retail sales and industrial production in the USA in March. A meeting of the Bank of Canada on the interest rate with a follow-up press conference is also expected. The key interest rate is expected to remain unchanged at 0.25%, while Canadian monetary authorities may announce new measures to support the economy.
Support and resistance
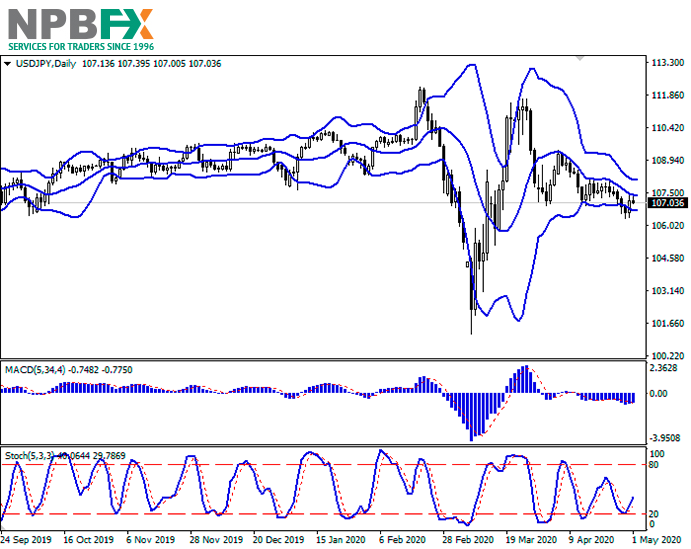
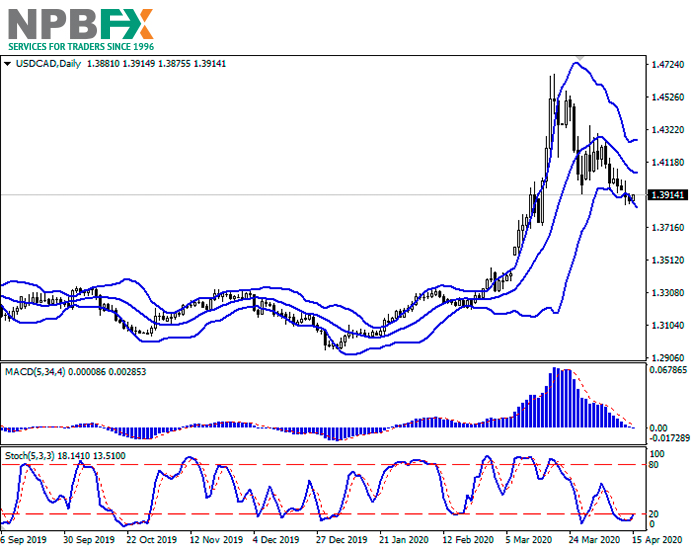
On the D1 chart, the Bollinger Bands are gradually reversing horizontally. The price range is expanding, without hindering the further development of “bearish” sentiment in the short term. MACD is going down preserving a stable sell signal (located below the signal line). In addition, the indicator is trying to consolidate below the zero level. Stochastic has long been located near its lows and signals in favor of the development of corrective growth in the ultra-short term.
One should wait for the situation to develop and new signals from technical indicators to appear.
Resistance levels: 1.3900, 1.4000, 1.4100, 1.4200.
Support levels: 1.3819, 1.3700, 1.3650.
Trading tips
To open long positions, one can rely on the breakout of 1.4000. Take-profit – 1.4200. Stop-loss – 1.3900.
The return of “bearish” trend with the breakdown of 1.3900 or 1.3819 may become a signal for new sales with the target at 1.3700 or 1.3650. Stop-loss – 1.3950 or 1.4000.
Implementation time: 2-3 days.
Use more opportunities of the NPBFX analytical portal: weekly FOREX forecast
You can learn more about the current situation on USD/CAD and get acquainted with the weekly analytical forecast in the "Video reviews" section on the NPBFX portal. Weekly video reviews contain trends, key levels, trading recommendations for such popular instruments as EUR/USD, GBP/USD, USD/JPY, AUD/USD. In order to get free and unlimited access to video forecast and other useful instruments on the portal, you need to register on the NPBFX website.
If you have any questions about trading instruments, you can always ask an analyst in the online chat on the portal and get a free consultation of an experienced specialist.
Use the current recommendations of analysts on USD/CAD and trade efficiently with NPBFX.
Good afternoon, dear forum visitors!
NPBFX offers the latest release of analytics on USD/CAD for a better understanding of the current market situation and more efficient trading.
Current trend
USD is showing slight growth during today’s Asian session, trying to retreat from monthly lows updated earlier this week. USD remains under pressure amid some improvement in the prospects for combating coronavirus in Europe, as well as due to the publication of a large number of disappointing macroeconomic statistics from the US.
Today investors are focused on statistics on the dynamics of retail sales and industrial production in the USA in March. A meeting of the Bank of Canada on the interest rate with a follow-up press conference is also expected. The key interest rate is expected to remain unchanged at 0.25%, while Canadian monetary authorities may announce new measures to support the economy.
Support and resistance
On the D1 chart, the Bollinger Bands are gradually reversing horizontally. The price range is expanding, without hindering the further development of “bearish” sentiment in the short term. MACD is going down preserving a stable sell signal (located below the signal line). In addition, the indicator is trying to consolidate below the zero level. Stochastic has long been located near its lows and signals in favor of the development of corrective growth in the ultra-short term.
One should wait for the situation to develop and new signals from technical indicators to appear.
Resistance levels: 1.3900, 1.4000, 1.4100, 1.4200.
Support levels: 1.3819, 1.3700, 1.3650.
Trading tips
To open long positions, one can rely on the breakout of 1.4000. Take-profit – 1.4200. Stop-loss – 1.3900.
The return of “bearish” trend with the breakdown of 1.3900 or 1.3819 may become a signal for new sales with the target at 1.3700 or 1.3650. Stop-loss – 1.3950 or 1.4000.
Implementation time: 2-3 days.
Use more opportunities of the NPBFX analytical portal: weekly FOREX forecast
You can learn more about the current situation on USD/CAD and get acquainted with the weekly analytical forecast in the "Video reviews" section on the NPBFX portal. Weekly video reviews contain trends, key levels, trading recommendations for such popular instruments as EUR/USD, GBP/USD, USD/JPY, AUD/USD. In order to get free and unlimited access to video forecast and other useful instruments on the portal, you need to register on the NPBFX website.
If you have any questions about trading instruments, you can always ask an analyst in the online chat on the portal and get a free consultation of an experienced specialist.
Use the current recommendations of analysts on USD/CAD and trade efficiently with NPBFX.