NPBFX - making money with us since 1996!

USD/JPY: USD is strengthening 15.02.2021

Good afternoon, dear forum visitors!

NPBFX offers the latest release of analytics on USD/JPY for a better understanding of the current market situation and more efficient trading.

Current trend

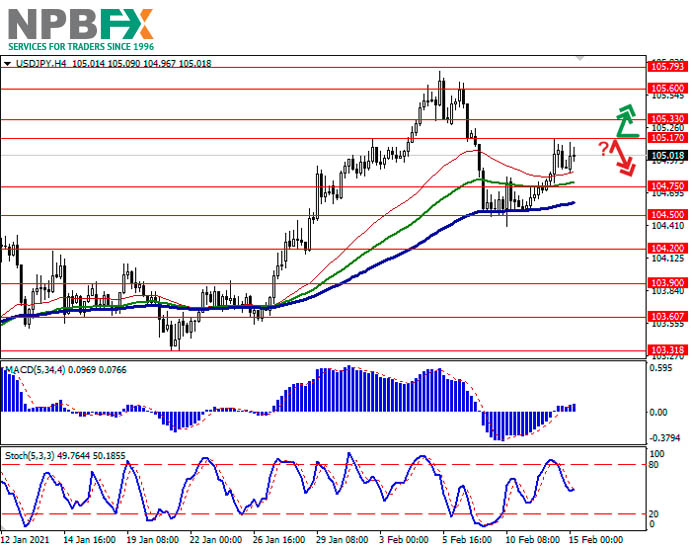
USD has shown strong gains against JPY during today's Asian session, once again trying to consolidate above 105.00.

The focus is on macroeconomic statistics from Japan, which was encouraging for Japanese investors, but still did not lead to a change in the trading direction in the short term. Annual data on Japan's GDP reflected the country's economic growth in Q4 2020 by 12.7% YoY after increasing by 22.7% YoY in the previous period. Experts expected a slowdown in GDP to +9.5% YoY. In quarterly terms, the economy slowed down from +5.3% QoQ to +3% QoQ, which was also better than market expectations at +2.3% QoQ. Industrial production dynamics slightly improved from –3.2% YoY to –2.6% YoY, with market neutral forecasts.

Support and resistance

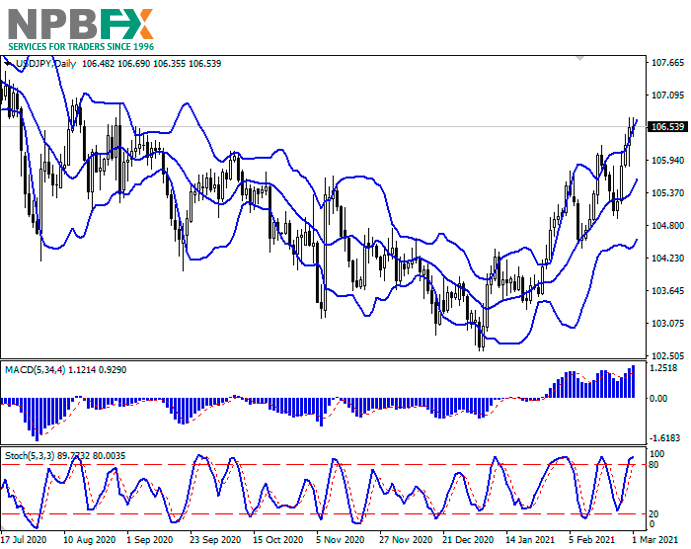
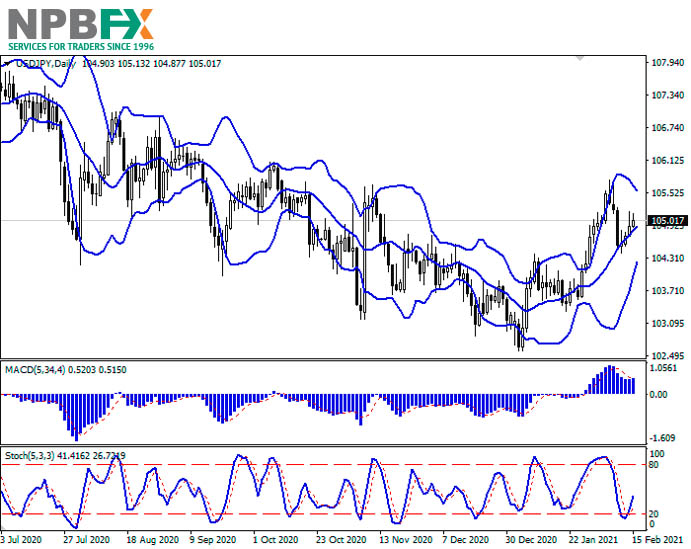
Bollinger Bands in D1 chart show stable growth. The price range is narrowing, reflecting the ambiguous nature of trading in the short/middle term. MACD indicator reverses to growth while forming a new buy signal (the histogram is about to consolidate above the signal line). Stochastic is actively recovering from its lows, indicating the prospects for the development of corrective growth of the instrument in the ultra-short term.

Current showings of the indicators do not contradict the development of the uptrend in the short term.

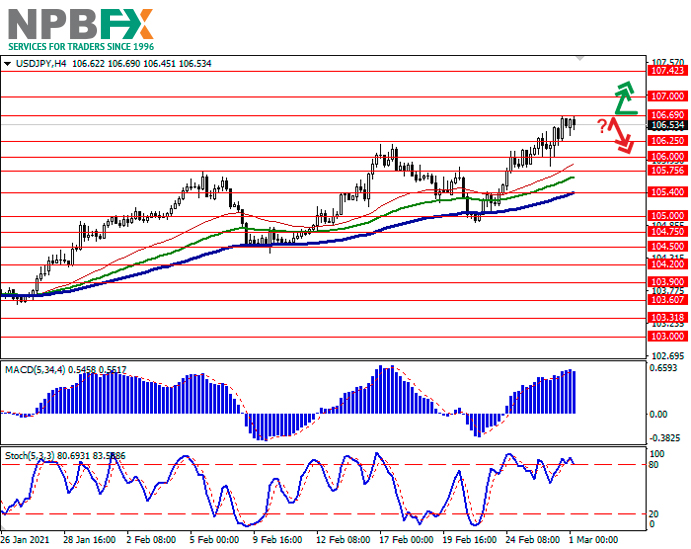
Resistance levels: 105.17, 105.33, 105.60, 105.79.
Support levels: 104.75, 104.50, 104.20, 103.90.

USDJPY150221-33.jpg


USDJPY150221-333.jpg


Trading tips

To open long positions, one can rely on the breakout of 105.17. Take-profit – 105.60–105.79. Stop-loss – 104.85. Implementation time: 1-2 days.

A rebound from 105.17 as from resistance, followed by a breakdown of 104.75 may become a signal for new sales with the target at 104.20. Stop-loss – 105.00.

Use more opportunities of the NPBFX analytical portal: economic indicators

Regular monitoring of global economic indicators plays an important role in trading, because of their strong influence on FOREX market and possibility to provoke significant price fluctuations. For the convenience of traders the "Education" section on the NPBFX portal contains the most popular and significant world economic indices with a detailed description, their possible impact on the economy and exchange rates (GDP, consumer price index, unemployment rate, Nonfarm Payrolls (NFP), etc.).

If you have any questions about trading instruments, you can always ask an analyst in the online chat on the portal and get a free consultation of an experienced specialist.

Use the current recommendations of analysts on USD/JPY and trade efficiently with NPBFX.
 
GBP/USD: GBP is consolidating 17.02.2021

Good afternoon, dear forum visitors!

NPBFX offers the latest release of analytics on GBP/USD for a better understanding of the current market situation and more efficient trading.

Current trend

GBP declines slightly against USD this morning session, trading below the psychological level of 1.3900. The day before, the instrument failed to consolidate at new record highs, and by the end of the afternoon session, it retreated to the opening levels. The reason for the decline was the correctional sentiment in favor of USD, while the fundamental picture is changing slightly.

GBP is feeling strong support from the conclusion of a trade agreement between the UK and the EU, and is also growing with an eye on the imminent lifting of quarantine restrictions by the British authorities in March.

Today, British investors expect the publication of January statistics on consumer inflation and producer price index. It is projected that consumer inflation in the country will show further deceleration, which will put pressure on GBP.

Support and resistance

Bollinger Bands in D1 chart show active growth. The price range expands from above, freeing a path to new local highs for the "bulls". MACD indicator tries to reverse downwards and to form a new sell signal (the histogram has to consolidate below the signal line). Stochastic is showing similar dynamics, retreating from its highs, indicating strongly overbought GBP in the ultra-short term.

The appearance of a full-fledged downtrend is possible in the short and/or ultra-short term.

Resistance levels: 1.3900, 1.3950, 1.4000, 1.4068.
Support levels: 1.3861, 1.3800, 1.3760, 1.3700.

GBPUSD170221-33.jpg


GBPUSD170221-333.jpg


Trading tips

To open new short positions, one can rely on the breakdown of 1.3861. Take-profit – 1.3760. Stop-loss – 1.3920. Implementation time: 2-3 days.

A rebound from 1.3861 as from support followed by a breakout of 1.3900 may become a signal for new purchases with the target at 1.4000. Stop-loss – 1.3845.

Use more opportunities of the NPBFX analytical portal: economic calendar

Be ready for any market changes through global events using the economic calendar on the NPBFX portal. The calendar contains all the most important events of the world economy and prognoses for them. In order to get free and unlimited access to the economic calendar and other useful instruments on the portal, you need to pass a one-time registration on the NPBFX website.

If you have any questions about trading instruments, you can always ask an analyst in the online chat on the portal and get a free consultation of an experienced specialist.

Use the current recommendations of analysts on GBP/USD and trade efficiently with NPBFX.
 
EUR/USD: ambiguous trading 19.02.2021

Good afternoon, dear forum visitors!

NPBFX offers the latest release of analytics on EUR/USD for a better understanding of the current market situation and more efficient trading.

Current trend

EUR is showing ambiguous trading during today's Asian session, consolidating near 1.2100 after the instrument retraced the day before. The reason for yesterday's resumption of "bullish" trend was the disappointing data from the US. Initial Jobless Claims for the week ending February 12 again showed an increase from 848K to 861K, while analysts expected their reduction to 765K. Continuing Jobless Claims for the week ending February 5 fell from 4.558M to 4.494M, which fell short of the most optimistic forecasts of 4.413M. Thus, investors are again convinced that it is still somewhat premature to talk about the beginning of a confident recovery of the American economy. As Jerome Powell said, it will take years for the labor market to return to its previous levels.

The focus of European investors today is statistics on business activity in the manufacturing and services sectors in Germany and the eurozone for February.

Support and resistance

Bollinger Bands in D1 chart demonstrate flat dynamics. The price range is changing slightly, but remains rather spacious for the current level of activity in the market. MACD has reversed towards growth without forming a buy signal (located below the signal line). Stochastic shows similar dynamics, reversing upwards near the level of "20". Current readings of the indicator signal in favor of a corrective growth in the ultra-short term.

Resistance levels: 1.2100, 1.2150, 1.2200.
Support levels: 1.2052, 1.2022, 1.2000, 1.1951.

EURUSD190221-33.jpg


EURUSD190221-333.jpg


Trading tips

To open long positions, one can rely on a confident breakout of 1.2100. Take-profit – 1.2150. Stop-loss – 1.2070. Implementation time: 1-2 days.

A rebound from 1.2100 as from resistance followed by a breakdown of 1.2052 may become a signal for new sales with the target at 1.2000. Stop-loss – 1.2080.

Use more opportunities of the NPBFX analytical portal: glossary

Beginning traders certainly face a lot of specialized concepts and lexicon on FOREX, which are often not fully been understood. Swap, tick, hedge, margin calls are often unfamiliar to beginning traders. But the lack of knowledge of these fundamentals make a competent market vision impossible. So glossary on the NPBFX analytical portal could be an excellent helper in this case, which contains all the main definitions with explanations in a compact and accessible form. All concepts are arranged in alphabetical order, so that you can easily and quickly find and explore a new concept for yourself.

If you have any questions about trading instruments, you can always ask an analyst in the online chat on the portal and get a free consultation of an experienced specialist.

Use the current recommendations of analysts on EUR/USD and trade efficiently with NPBFX.
 
XAU/USD: gold retreats from record lows 22.02.2021

Good afternoon, dear forum visitors!

NPBFX offers the latest release of analytics on XAU/USD for a better understanding of the current market situation and more efficient trading.

Current trend

Gold prices are showing a slight increase during today's trading, developing a corrective impetus that formed at the end of last week. Last Friday, the instrument renewed record lows since early July 2020, but was able to recover due to corrective sentiment in the market and weak positions in USD, which remained under pressure from weak data on the US labor market.

In turn, the general excitement in the market is putting strong pressure on the position of "safe" gold. High yield on US Treasury bonds provokes further growth in demand for risky assets. The improvement of the epidemiological situation in the USA and in the world also helps. Countries are gradually lifting the quarantine restrictions as vaccination campaigns spread and accelerate.

Support and resistance

Bollinger Bands in D1 chart demonstrate a weak downtrend. The price range is changing slightly, but remains rather spacious for the current level of activity in the market. MACD has reversed upwards preserving a sell signal (located below the signal line). Stochastic is acting more aggressively and, having demonstrated a rebound from the lows, is currently signaling in favor of the development of uptrend in the nearest future.

A full-fledged correctional growth is possible in the short and/or ultra-short term.

Resistance levels: 1800.00, 1810.29, 1830.00, 1850.00.
Support levels: 1769.59, 1753.57, 1735.13, 1720.00.

XAUUSD220221-33.jpg


XAUUSD220221-333.jpg


Trading tips

To open long positions, one can rely on the breakout of 1800.00. Take-profit – 1830.00. Stop-loss – 1785.00. Implementation time: 1-2 days.

The return of "bearish" trend with the breakdown of 1769.59 may become a signal for new sales with the target at 1735.13. Stop-loss – 1785.00.

Use more opportunities of the NPBFX analytical portal: trading signals for commodities

How can a trader determine if it’s worth buying or selling XAU/USD now or better waiting for a more favorable period? Use trading signals for commodities from the top 10 technical indicators on the NPBFX portal and make the right decisions! All registered users have free and unlimited access to the minutely updated trading signals (MA10, BBands, Ichimoku, Stochastic, ZigZag, etc.) for Gold, Silver, Brent and WTI Crude oil.

If you have any questions about trading instruments, you can always ask an analyst in the online chat on the portal and get a free consultation of an experienced specialist.

Use the current recommendations of analysts on XAU/USD and trade efficiently with NPBFX.
 
GBP/USD: updating record highs 24.02.2021

Good afternoon, dear forum visitors!

NPBFX offers the latest release of analytics on GBP/USD for a better understanding of the current market situation and more efficient trading.

Current trend

GBP maintains strong upside momentum against USD in the short term, hitting record highs since April 2018 during today's Asian session.

Investors reacted very optimistically to the televised address of British Prime Minister Boris Johnson, who announced the lifting of quarantine in the country closer to July. Meanwhile, the UK is steadily increasing the pace of vaccination, currently occupying the third place in the world. To date, more than a quarter of the total population has been vaccinated, and in the near future, the rate of vaccination is likely to only increase.

Today, investors are focused on the Monetary Policy Report Hearings, which is an important factor for the Bank of England's decision to further stimulate the national economy.

Support and resistance

Bollinger Bands in D1 chart show stable growth. The price range is expanding from above, but it fails to catch the surge of "bullish" sentiment at the moment. MACD indicator is growing, preserving a stable buy signal (located above the signal line). Stochastic, having reached its highs, reversed into the horizontal plane, indicating strongly overbought GBP in the ultra-short term.

A full-fledged downward correction for the instrument is possible towards the end of the current trading week.

Resistance levels: 1.4200, 1.4275, 1.4375.
Support levels: 1.4150, 1.4100, 1.4050, 1.4000.

GBPUSD240221-33.jpg


GBPUSD240221-333.jpg


Trading tips

To open corrective sales, one can rely on the instrument's rebound from the current resistance levels, followed by a breakdown of 1.4100. Take-profit – 1.4000. Stop-loss – 1.4160. Implementation time: 2-3 days.

New long positions may be opened after breakout of 1.4200. Take-profit – 1.4350-1.4375. Stop-loss – 1.4130.

Use more opportunities of the NPBFX analytical portal: economic calendar

Be ready for any market changes through global events using the economic calendar on the NPBFX portal. The calendar contains all the most important events of the world economy and prognoses for them. In order to get free and unlimited access to the economic calendar and other useful instruments on the portal, you need to pass a one-time registration on the NPBFX website.

If you have any questions about trading instruments, you can always ask an analyst in the online chat on the portal and get a free consultation of an experienced specialist.

Use the current recommendations of analysts on GBP/USD and trade efficiently with NPBFX.
 
EUR/USD: EUR is under pressure 26.02.2021

Good afternoon, dear forum visitors!

NPBFX offers the latest release of analytics on EUR/USD for a better understanding of the current market situation and more efficient trading.

Current trend

EUR is trading in both directions against USD during today's Asian session. At the opening of trading, the pair was steadily declining; however, EUR managed to win back half of its losses, receiving support from vulnerable positions in USD.

The pressure on USD intensified yesterday after the US Fed Chair Jerome Powell reiterated the regulator's adherence to a soft monetary policy, noting that there are no talks about its correction towards tightening in the near future at all. In turn, USD was supported on Thursday by strong data from the US on the dynamics of jobless claims, which turned out to be much better than projected.

Today, investors are focused on statistics from the USA on the dynamics of personal income and spending in January. In addition, after the opening of the American session, the market will receive data on the PMI in Chicago and the level of consumer sentiment from the University of Michigan for February.

Support and resistance

In the D1 chart, Bollinger Bands are reversing horizontally. The price range is slightly expanding from above, remaining spacious enough for the current activity level in the market. MACD has reversed downwards preserving a buy signal (located above the signal line). Stochastic, having shown a rebound from its highs develops a downtrend, signaling in favor of the development of a corrective decline in EUR in the ultra-short term.

Resistance levels: 1.2200, 1.2234, 1.2271, 1.2300.
Support levels: 1.2150, 1.2100, 1.2052, 1.2022.

EURUSD260221-33.jpg


EURUSD260221-333.jpg


Trading tips

To open short positions, one can rely on the breakdown of 1.2100. Take-profit – 1.2022–1.2000. Stop-loss – 1.2150. Implementation time: 2-3 days.

The return of the "bullish" trend to the market with the breakout of 1.2200 may become a signal for new purchases with the target of 1.2300. Stop-loss – 1.2150.

Use more opportunities of the NPBFX analytical portal: glossary

Beginning traders certainly face a lot of specialized concepts and lexicon on FOREX, which are often not fully been understood. Swap, tick, hedge, margin calls are often unfamiliar to beginning traders. But the lack of knowledge of these fundamentals make a competent market vision impossible. So glossary on the NPBFX analytical portal could be an excellent helper in this case, which contains all the main definitions with explanations in a compact and accessible form. All concepts are arranged in alphabetical order, so that you can easily and quickly find and explore a new concept for yourself.

If you have any questions about trading instruments, you can always ask an analyst in the online chat on the portal and get a free consultation of an experienced specialist.

Use the current recommendations of analysts on EUR/USD and trade efficiently with NPBFX.
 
USD/JPY: consolidation pending new drivers 1.03.2021

Good afternoon, dear forum visitors!

NPBFX offers the latest release of analytics on USD/JPY for a better understanding of the current market situation and more efficient trading.

Current trend

USD is flat against JPY in Asian trading today, consolidating near its record highs since August 2020. USD received a powerful impetus to growth at the end of the last trading week, as investors were actively selling risky assets amid correction in the bond market. The instrument was additionally supported by good macroeconomic statistics from the USA, which was quite close to its forecasts.

Today, JPY is in demand after the publication of data from Japan. Jibun Bank Manufacturing PMI in February rose from 50.6 to 51.4 points, which turned out to be better than market forecasts. Tomorrow, Japanese investors are expecting the release of the January data on the labor market, in particular, the unemployment rate.

Support and resistance

Bollinger Bands in D1 chart show stable growth. The price range is expanding from above, but it fails to catch the surge of "bullish" sentiment at the moment. MACD indicator is growing preserving a moderate buy signal (located above the signal line). Stochastic, having approached its highs is reversing into a horizontal plane, indicating risks of overbought USD in the ultra-short term.

Existing long positions should be kept in the short and/or ultra-short term until the signals from technical indicators clear up.

Resistance levels: 106.69, 107.00, 107.42, 107.78.
Support levels: 106.25, 106.00, 105.75, 105.40.

USDJPY010321-33.jpg


USDJPY010321-333.jpg


Trading tips

To open long positions, one can rely on a confident breakout of 106.69. Take-profit – 107.78. Stop-loss – 106.00. Implementation time: 2-3 days.

A rebound from 106.69 as from resistance, followed by a breakdown of 106.25 may become a signal for new sales with the target at 105.40. Stop-loss – 106.69.

Use more opportunities of the NPBFX analytical portal: economic indicators

Regular monitoring of global economic indicators plays an important role in trading, because of their strong influence on FOREX market and possibility to provoke significant price fluctuations. For the convenience of traders the "Education" section on the NPBFX portal contains the most popular and significant world economic indices with a detailed description, their possible impact on the economy and exchange rates (GDP, consumer price index, unemployment rate, Nonfarm Payrolls (NFP), etc.).

If you have any questions about trading instruments, you can always ask an analyst in the online chat on the portal and get a free consultation of an experienced specialist.

Use the current recommendations of analysts on USD/JPY and trade efficiently with NPBFX.
 
NZD/USD: ambiguous trading dynamics 3.03.2021

Good afternoon, dear forum visitors!

NPBFX offers the latest release of analytics on NZD/USD for a better understanding of the current market situation and more efficient trading.

Current trend

NZD is showing ambiguous trading dynamics against USD, hovering around 0.7300. The market is again seeing a rise in demand for safe assets as bond market yields rise, which have been the subject of the fiercest discussions recently. In particular, the ECB noted yesterday that the recent surge in securities yields was largely unfounded, and the regulator will try to adjust its quantitative easing program. Earlier, the RBA announced similar plans.

In turn, the published macroeconomic statistics are increasingly ambiguous. Building Permits in New Zealand in January slowed down from +5.1% MoM to +2.1% MoM, which turned out to be worse than average expectations. ANZ Commodity Price in February corrected from +3.6% MoM to +3.3% MoM. Statistics from China were also disappointing. In February, the Caixin Services PMI slowed from 52 to 51.5 points.

Support and resistance

Bollinger Bands in D1 chart show unsteady growth. The price range is narrowing from below, reflecting the emergence of ambiguous dynamics of trading in the short term. MACD is declining keeping a weak sell signal (located below the signal line). Stochastic, having reached the level of "20", reversed into an upward plane, indicating the prospects for the development of corrective growth in the nearest future.

Resistance levels: 0.7305, 0.7350, 0.7393, 0.7435.
Support levels: 0.7250, 0.7222, 0.7200, 0.7150.

NZDUSD030321-33.jpg


NZDUSD030321-333.jpg


Trading tips

To open long positions, one can rely on the breakout of 0.7305. Take-profit – 0.7393. Stop-loss – 0.7250. Implementation time: 2-3 days.

A rebound from 0.7305 as from resistance, followed by a breakdown of 0.7250 may become a signal for new sales with the target at 0.7150. Stop-loss – 0.7305.

Use more opportunities of the NPBFX analytical portal: glossary

Beginning traders certainly face a lot of specialized concepts and lexicon on FOREX, which are often not fully been understood. Swap, tick, hedge, margin calls are often unfamiliar to beginning traders. But the lack of knowledge of these fundamentals make a competent market vision impossible. So glossary on the NPBFX analytical portal could be an excellent helper in this case, which contains all the main definitions with explanations in a compact and accessible form. All concepts are arranged in alphabetical order, so that you can easily and quickly find and explore a new concept for yourself.

If you have any questions about trading instruments, you can always ask an analyst in the online chat on the portal and get a free consultation of an experienced specialist.

Use the current recommendations of analysts on NZD/USD and trade efficiently with NPBFX.
 
USD/CHF: trading at record highs 5.03.2021

Good afternoon, dear forum visitors!

NPBFX offers the latest release of analytics on USD/CHF for a better understanding of the current market situation and more efficient trading.

Current trend

USD is marginally higher against CHF during today's Asian session, consolidating near record highs since July 2020, updated the day before. Investors continue to show high interest in "safe" assets, responding to the controversial situation in the bond market and fearing the introduction of new measures from leading financial regulators.

In particular, the attention of market participants on Thursday was focused on the speech of the US Fed Chair, Jerome Powell. The Chairman of the American regulator made a very optimistic speech, practically without touching upon the urgent topic of growth in the yield of US Treasury bonds. The official noted that the early opening of the economies will lead to a noticeable increase in inflation, which serves as one of the main guidelines for maintaining minimum interest rates. Immediately after Powell's speech, bond yields rallied again, pushing the major Wall Street indices down.

Support and resistance

Bollinger Bands in D1 chart show stable growth. The price range is expanding but it fails to catch the development of "bullish" trend at the moment. MACD indicator is growing preserving a stable buy signal (located above the signal line). Stochastic retains upward direction, but is located near its highs, which indicates risks of overbought USD in the ultra-short term.

Existing long positions should be kept in the short and/or ultra-short term until the signals from technical indicators clear up.

Resistance levels: 0.9300, 0.9350, 0.9400.
Support levels: 0.9250, 0.9200, 0.9163, 0.9126.

USDCHF050321-33.jpg


USDCHF050321-333.jpg


Trading tips

To open long positions, one can rely on the breakout of 0.9300. Take-profit – 0.9400. Stop-loss – 0.9250. Implementation time: 1-2 days.

A rebound from 0.9300 as from resistance followed by a breakdown of 0.9250 may become a signal for new sales with the targets at 0.9126–0.9100. Stop-loss – 0.9320.

Use more opportunities of the NPBFX analytical portal: E-book

If you just recently started to be interested in trading on FOREX and would like to deepen your knowledge, an electronic Beginner's Guide to FOREX Trading will be an excellent helper for you here. The book consists of 5 chapters and reflects fundamental concepts of the foreign exchange market to start successful trading. From the main chapters of the E-book you can learn about the concepts and history of FOREX, currencies and trend lines, technical indicators, types of orders, trading on news, psychology of trading, risk management and much more.

You can read a Beginner's guide to FOREX Trading online or download it free of charge from the NPBFX analytical portal in the "Education" section. In order to get unlimited access to the E-book and other useful instruments on the portal, you need to register on the NPBFX website.

If you have any questions about trading instruments, you can always ask an analyst in the online chat on the portal and get a free consultation of an experienced specialist.

Use the current recommendations of analysts on USD/CHF and trade efficiently with NPBFX.
 
AUD/USD: consolidation at 0.7700 08.03.2021

Good afternoon, dear forum visitors!

NPBFX offers the latest release of analytics on AUD/USD for a better understanding of the current market situation and more efficient trading.

Current trend

AUD shows ambiguous dynamics of trading against USD during today's Asian session, consolidating at 0.7700. The instrument is again under pressure after last Friday's publication of strong data on US employment, which turned out to be significantly better than expectations. In addition, investors were enthusiastic about the success of the US Senate vote on new measures to support the US economy. President Joe Biden's bill was approved in the Senate by a margin of only one vote, but before that senators had made many amendments to the law. Now the American Rescue Plan has to return to the House of Representatives of the US Congress, after which it will be able to get signed by Joe Biden.

Some support for AUD at the beginning of the new week is provided by good macroeconomic indicators from China. In particular, exports from China in February grew by a record 60.6% YoY, which was more than 1.5 times better than expectations.

Support and resistance

Bollinger Bands in D1 chart demonstrate flat dynamics. The price range is slightly expanding, remaining spacious enough for the current activity level in the market. MACD is going down preserving a stable sell signal (located below the signal line). The indicator is trying to consolidate below the zero level. Stochastic, having approached the level of "20", reversed into a horizontal plane, indicating that the instrument is oversold in the nearest future.

Resistance levels: 0.7721, 0.7750, 0.7780, 0.7804.
Support levels: 0.7675, 0.7641, 0.7600, 0.7556.

audusd08032021-55.png


audusd08032021-66.png


Trading tips

To open long positions, one can rely on the breakout of 0.7721. Take-profit – 0.7780–0.7804. Stop-loss – 0.7675. Implementation time: 1-2 days.

A rebound from 0.7721 as from resistance, followed by a breakdown of 0.7675 may become a signal for new sales with the target at 0.7600. Stop-loss – 0.7721.

Use more opportunities of the NPBFX analytical portal: glossary

Beginning traders certainly face a lot of specialized concepts and lexicon on FOREX, which are often not fully been understood. Swap, tick, hedge, margin calls are often unfamiliar to beginning traders. But the lack of knowledge of these fundamentals make a competent market vision impossible. So glossary on the NPBFX analytical portal could be an excellent helper in this case, which contains all the main definitions with explanations in a compact and accessible form. All concepts are arranged in alphabetical order, so that you can easily and quickly find and explore a new concept for yourself.

If you have any questions about trading instruments, you can always ask an analyst in the online chat on the portal and get a free consultation of an experienced specialist.

Use the current recommendations of analysts on EUR/USD and trade efficiently with NPBFX.
 
Back
Top