NPBFX - making money with us since 1996!

GBP/USD: the pound develops corrective decline 24.11.2021

Good afternoon, dear forum visitors!

NPBFX offers the latest release of analytics on GBP/USD for a better understanding of the current market situation and more efficient trading.

Current trend

The British pound is trading lower against the US currency during the morning session, being under pressure since last Friday. The pound finds nothing to counter the rising dollar, despite some very optimistic evidence of the strength of the UK economy. In particular, yesterday investors reacted to the publication of statistics on business activity. In the manufacturing sector, activity in the UK in November rose from 57.8 to 58.2 points, ahead of forecasts of a decline to 57.3 points. Services PMI, in turn, slightly decreased from 59.1 to 58.6 points, but remains at quite acceptable levels.

Positive statistics from the UK allows us to maintain expectations regarding further tightening of monetary policy by the Bank of England. Markets expect the British regulator to make a decision on this matter already at the December meeting.

Investors are focused on macroeconomic statistics from the USA today. Among the most important indicators are the dynamics of durable goods orders in November, annual GDP data for Q3 2021 and statistics on personal income and expenses of American citizens for October.

Support and resistance

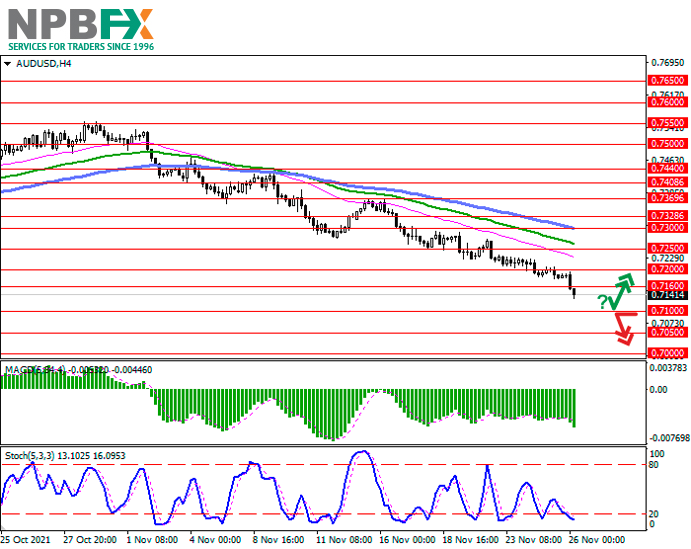
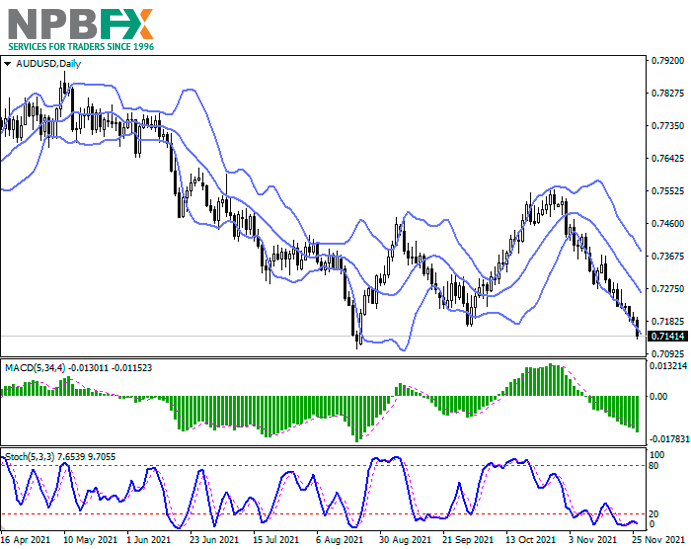
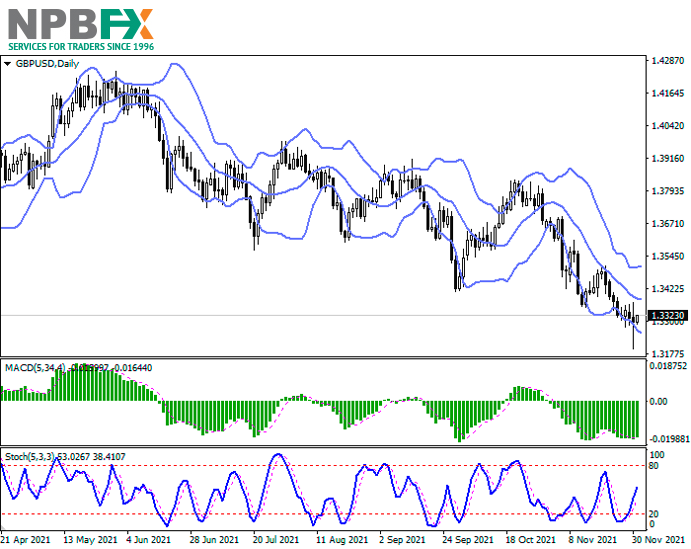
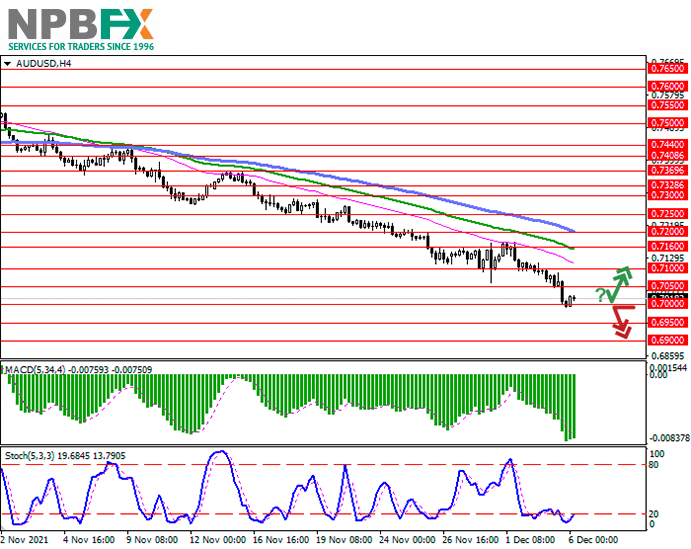
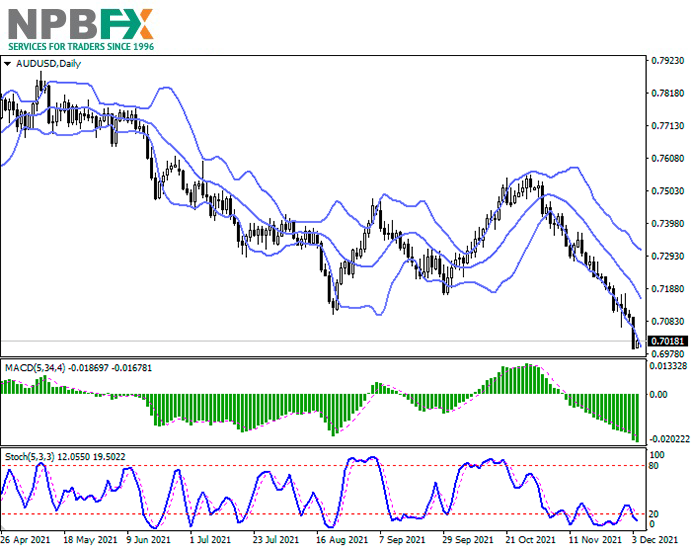
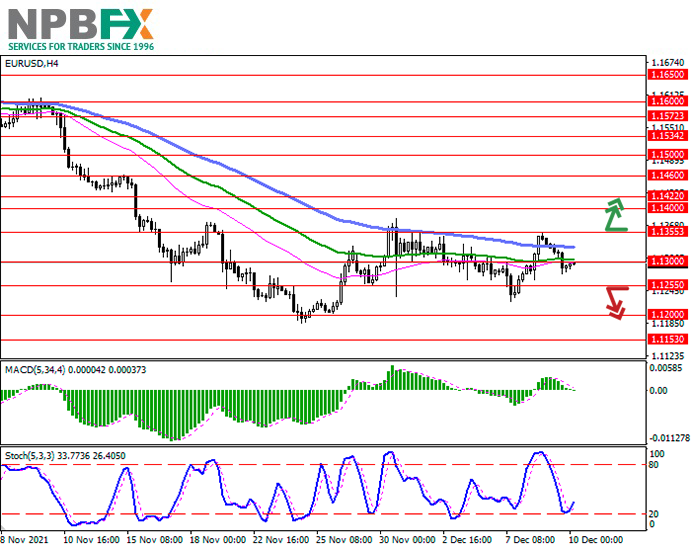
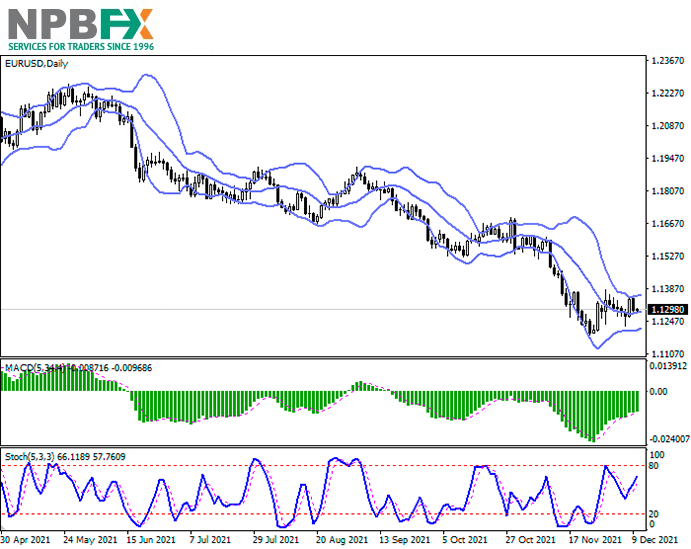
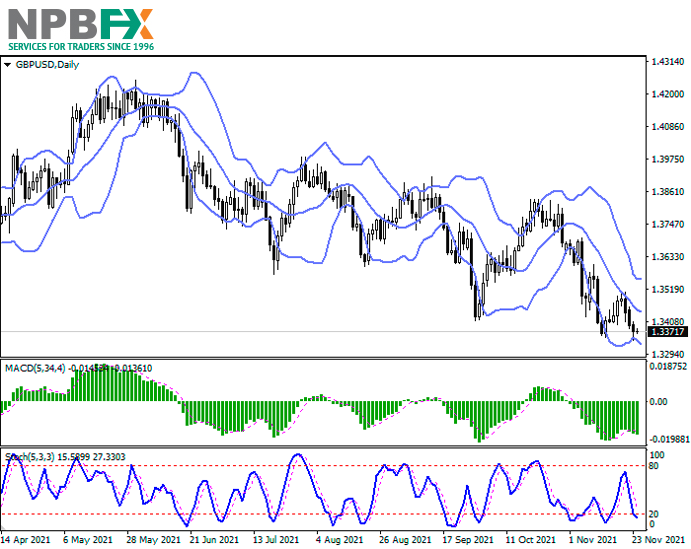
On the D1 chart, Bollinger Bands are gradually reversing horizontally. The price range expands from below, making way for new local lows for the "bears". MACD is declining keeping a weak sell signal (located below the signal line). Stochastic keeps a downward direction but is already approaching its lows, which indicates the risks of oversold GBP in the ultra-short term.

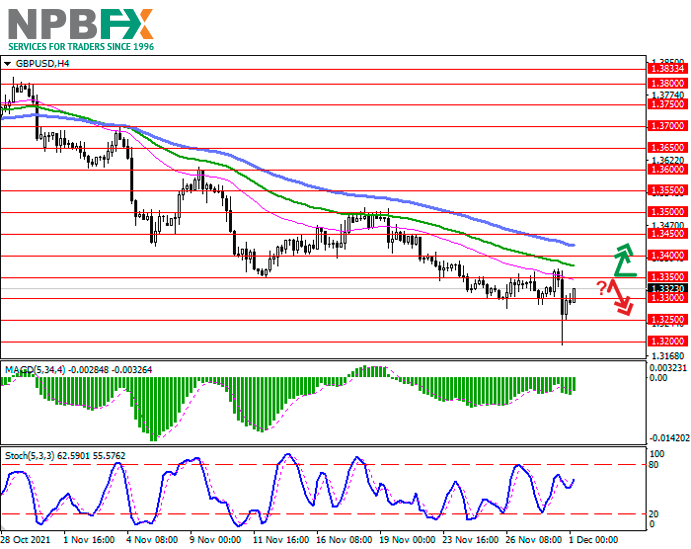
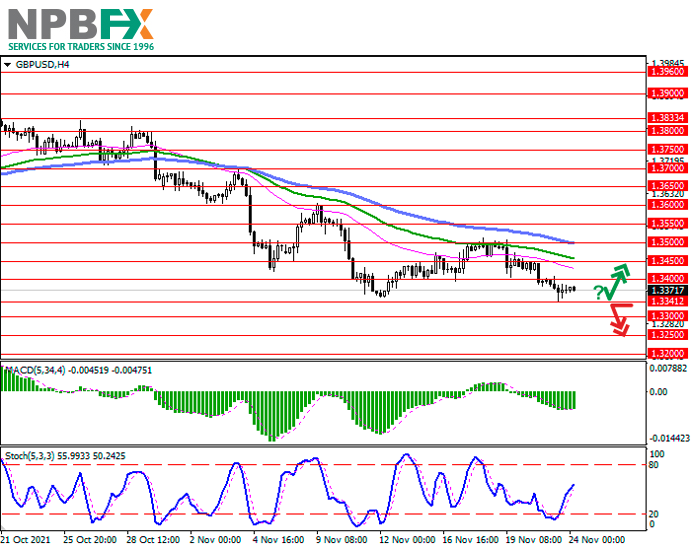
Resistance levels: 1.3400, 1.3450, 1.3500, 1.3550.
Support levels: 1.3341, 1.3300, 1.3250, 1.3200.

GBPUSD241121-33.png


GBPUSD241121-333.png


Trading tips

To open long positions, one can rely on the rebound from the support level of 1.3341 with the subsequent breakout of 1.3400. Take-profit – 1.3500. Stop-loss – 1.3341. Implementation time: 2-3 days.

The breakdown of 1.3341 may serve as a signal for new sales with the target at 1.3250. Stop-loss – 1.3400.

Use more opportunities of the NPBFX analytical portal: glossary

Beginning traders certainly face a lot of specialized concepts and lexicon on FOREX, which are often not fully been understood. Swap, tick, hedge, margin calls are often unfamiliar to beginning traders. But the lack of knowledge of these fundamentals make a competent market vision impossible. So glossary on the NPBFX analytical portal could be an excellent helper in this case, which contains all the main definitions with explanations in a compact and accessible form. All concepts are arranged in alphabetical order, so that you can easily and quickly find and explore a new concept for yourself.

If you have any questions about trading instruments, you can always ask an analyst in the online chat on the portal and get a free consultation of an experienced specialist.

Use the current recommendations of analysts on GBP/USD and trade efficiently with NPBFX.
 
AUD/USD: Australian dollar renews local lows 26.11.2021

Good afternoon, dear forum visitors!

NPBFX offers the latest release of analytics on AUD/USD for a better understanding of the current market situation and more efficient trading.

Current trend

The Australian dollar is showing a steady decline during the Asian session, updating local lows since the end of August and testing 0.7140 for a breakdown.

The instrument is still under pressure after the release of a large block of macroeconomic statistics from the US last Wednesday. Among other things, the data reflected a sharp decline in the number of Initial Jobless Claims from 270K to a new record low of 199K. Analysts' forecasts assumed a reduction to 260K. The dynamics of Personal Income and Spending of American citizens in October were also positive.

In general, the recovery of the American economy exceeded expectations, and therefore the US Fed may accelerate the reduction of the current quantitative easing (QE) program and move faster to the cycle of raising the interest rate.

Today, the instrument almost completely ignores the strong statistics from Australia. October Retail Sales data in Australia showed an increase of 4.9% MoM after increasing 1.3% MoM in September. Analysts had expected growth of 2.5% MoM.

Support and resistance

Bollinger Bands in D1 chart demonstrate a stable decrease. The price range is expanding but it fails to conform to the surge of "bearish" activity at the moment. MACD is going down preserving a stable sell signal (located below the signal line). Stochastic has been near its lows for a long time, indicating the risks of the Australian dollar being oversold in the ultra-short term.

Resistance levels: 0.7160, 0.7200, 0.7250, 0.7300.
Support levels: 0.7100, 0.7050, 0.7000.

AUDUSD261121-33.png


AUDUSD261121-333.png


Trading tips

To open short positions, one can rely on the breakdown of 0.7100. Take-profit – 0.7000. Stop-loss – 0.7160. Implementation time: 1-2 days.

A rebound from 0.7100 as from support followed by a breakout of 0.7160 may become a signal for new purchases with the target at 0.7250. Stop-loss – 0.7100.

Use more opportunities of the NPBFX analytical portal: weekly FOREX forecast

You can learn more about the current situation on AUD/USD and get acquainted with the weekly analytical forecast in the "Video reviews" section on the NPBFX portal. Weekly video reviews contain trends, key levels, trading recommendations for such popular instruments as EUR/USD, GBP/USD, USD/CHF, USD/JPY. In order to get free and unlimited access to video forecast and other useful instruments on the portal, you need to register on the NPBFX website.

If you have any questions about trading instruments, you can always ask an analyst in the online chat on the portal and get a free consultation of an experienced specialist.

Use the current recommendations of analysts on AUD/USD and trade efficiently with NPBFX.
 
USD/JPY: volatile dynamics on the news of a new strain 29.11.2021

Good afternoon, dear forum visitors!

NPBFX offers the latest release of analytics on USD/JPY for a better understanding of the current market situation and more efficient trading.

Current trend

The US dollar is showing mixed dynamics against the Japanese yen during trading in Asia, consolidating near 113.50. At the end of last week, the instrument showed a sharp decline, quickly retreating from its record highs, which became the market's reaction to the discovery of a new, Omicron, strain of coronavirus, which threatens the fragile process of global economic recovery. The World Health Organization (WHO) noted that the virus has undergone changes "of relevance to global public health".

Moderate support for the yen, in turn, was provided by Friday's data on consumer prices in Japan. In November, Tokyo Consumer Price Index rose 0.5% MoM, accelerating from 0.1% MoM growth in October. At the beginning of the new week, buying activity on the yen is supported by upbeat data from Japan on retail sales. In September, sales increased by 1.1% MoM and 0.9% YoY, which turned out to be better than forecasts, since in monthly terms the markets expected a decline in indicators by 1.6% MoM.

Support and resistance

In the D1 chart, Bollinger Bands are reversing horizontally. The price range is changing slightly, but remains rather spacious for the current level of activity in the market. MACD is going down preserving a stable sell signal (located below the signal line). Stochastic keeps a confident downward direction but is already approaching its lows, which indicates the risks of oversold USD in the ultra-short term.

Resistance levels: 114.00, 114.50, 115.00, 115.50.
Support levels: 113.50, 113.00, 112.50, 112.06.

USDJPY291121-33.png


USDJPY291121-333.png


Trading tips

To open long positions, one can rely on the breakout of 114.00 with the target at 115.00. Stop-loss – 113.50. Implementation time: 1-2 days.

The development of "bearish" trend with the breakdown of 113.00 may become a signal for further sales with target at 112.06. Stop-loss – 113.50.

Use more opportunities of the NPBFX analytical portal: E-book

If you just recently started to be interested in trading on FOREX and would like to deepen your knowledge, an electronic Beginner's Guide to FOREX Trading will be an excellent helper for you here. The book consists of 5 chapters and reflects fundamental concepts of the foreign exchange market to start successful trading. From the main chapters of the E-book you can learn about the concepts and history of FOREX, currencies and trend lines, technical indicators, types of orders, trading on news, psychology of trading, risk management and much more.

You can read a Beginner's guide to FOREX Trading online or download it free of charge from the NPBFX analytical portal in the "Education" section. In order to get unlimited access to the E-book and other useful instruments on the portal, you need to register on the NPBFX website.

If you have any questions about trading instruments, you can always ask an analyst in the online chat on the portal and get a free consultation of an experienced specialist.

Use the current recommendations of analysts on USD/JPY and trade efficiently with NPBFX.
 
GBP/USD: pound recovers testing 1.3320 01.12.2021

Good afternoon, dear forum visitors!

NPBFX offers the latest release of analytics on GBP/USD for a better understanding of the current market situation and more efficient trading.

Current trend

The British pound is growing against the US dollar during the morning session, trying to consolidate above 1.3320.

The day before, GBP/USD showed active, but ambiguous trading dynamics, briefly renewing record lows since the end of December 2020. The pressure on the British currency was again exerted by traders' fears about the spread of the new Omicron coronavirus strain. Pharmaceutical companies officials said existing vaccines may show reduced efficacy with a new virus mutation. The market reacted immediately to this data, and given the already extremely low demand for risk, the pound renewed its record lows. Investors also fear that the threat of new restrictions will catalyze a change in the position of the Bank of England on a possible tightening of monetary policy in December. The British regulator is unlikely to completely correct its course, but it may well take a pause for several months until the situation is clarified.

Today, investors will be focused on the speech of the Governor of the Bank of England, Andrew Bailey, who, most likely, will reveal the regulator's plans in the light of new epidemiological shocks.

Support and resistance

In the D1 chart, Bollinger Bands are reversing horizontally. The price range is expanding, making way to new record lows for the "bears". MACD indicator is trying to reverse upwards and form a new buy signal (the histogram has to consolidate above the signal line). Stochastic demonstrates a similar dynamics, signaling in favor of the development of the uptrend in the nearest future.

Resistance levels: 1.3350, 1.3400, 1.3450, 1.3500.
Support levels: 1.3300, 1.3250, 1.3200, 1.3150.

GBPUSD011221-33.png


GBPUSD011221-333.png


Trading tips

To open long positions, one can rely on the breakout of 1.3350 with the target at 1.3450. Stop-loss – 1.3300. Implementation time: 1-2 days.

A rebound from 1.3350 as from resistance followed by a breakdown of 1.3300 may become a signal for new sales with the target at 1.3200. Stop-loss — 1.3350.

Use more opportunities of the NPBFX analytical portal: glossary

Beginning traders certainly face a lot of specialized concepts and lexicon on FOREX, which are often not fully been understood. Swap, tick, hedge, margin calls are often unfamiliar to beginning traders. But the lack of knowledge of these fundamentals make a competent market vision impossible. So glossary on the NPBFX analytical portal could be an excellent helper in this case, which contains all the main definitions with explanations in a compact and accessible form. All concepts are arranged in alphabetical order, so that you can easily and quickly find and explore a new concept for yourself.

If you have any questions about trading instruments, you can always ask an analyst in the online chat on the portal and get a free consultation of an experienced specialist.

Use the current recommendations of analysts on GBP/USD and trade efficiently with NPBFX.
 
USD/CHF: USD is trying to recover 03.12.2021

Good afternoon, dear forum visitors!

NPBFX offers the latest release of analytics on USD/CHF for a better understanding of the current market situation and more efficient trading.

Current trend

The American currency is showing weak gains against the Swiss franc during the Asian session, recovering from local lows since November 10, updated last Tuesday. Market participants expect the November US labor market report to enter the market, which should clarify the outlook for the US Fed's monetary policy. The Chairman of the regulator Jerome Powell agreed with the arguments of the market about the threats of inflationary pressure, noting that to stabilize the situation, officials may have to resort to additional measures. In particular, the market is counting on a possible acceleration in the pace of reduction of the quantitative easing program, after which the US Fed is likely to move to raising the interest rate.

The American macroeconomic statistics published yesterday turned out to be ambiguous. Investors reacted rather restrainedly to the increase in the number of initial jobless claims for the week ended November 26 from 194K to 222K. At the same time, the real dynamics turned out to be 18K better than market expectations. Continuing jobless claims for the first time in a long time fell below the psychological mark of 2M to 1.956M.

Support and resistance

On the D1 chart, Bollinger Bands are gradually reversing into a descending plane. The price range is expanding from below, remaining spacious enough for the current activity level in the market. MACD is going down preserving a rather stable sell signal (located below the signal line). Stochastic, having rebounded from the lows in the middle of the week, maintains an uptrend, signaling in favor of corrective growth in the nearest time intervals.

Resistance levels: 0.9200, 0.9220, 0.9250, 0.9272.
Support levels: 0.9175, 0.9150, 0.9100, 0.9073.

USDCHF031221-33.png


USDCHF031221-333.png


Trading tips

To open long positions, one can rely on the breakout of 0.9220 with the target at 0.9272. Stop-loss – 0.9190. Implementation time: 2-3 days.

A rebound from 0.9220 as from resistance followed by a breakdown of 0.9200 may become a signal for new sales with the target at 0.9150. Stop-loss – 0.9220.

Use more opportunities of the NPBFX analytical portal: E-book

If you just recently started to be interested in trading on FOREX and would like to deepen your knowledge, an electronic Beginner's Guide to FOREX Trading will be an excellent helper for you here. The book consists of 5 chapters and reflects fundamental concepts of the foreign exchange market to start successful trading. From the main chapters of the E-book you can learn about the concepts and history of FOREX, currencies and trend lines, technical indicators, types of orders, trading on news, psychology of trading, risk management and much more.

You can read a Beginner's guide to FOREX Trading online or download it free of charge from the NPBFX analytical portal in the "Education" section. In order to get unlimited access to the E-book and other useful instruments on the portal, you need to register on the NPBFX website.

If you have any questions about trading instruments, you can always ask an analyst in the online chat on the portal and get a free consultation of an experienced specialist.

Use the current recommendations of analysts on USD/CHF and trade efficiently with NPBFX.
 
AUD/USD: the instrument is trying to consolidate above 0.7000 06.12.2021

Good afternoon, dear forum visitors!

NPBFX offers the latest release of analytics on AUD/USD for a better understanding of the current market situation and more efficient trading.

Current trend

The national currency of Australia shows moderate corrective gains against the US dollar during the Asian session, recovering from a noticeable decline last Friday, when AUD/USD hit record lows since early November 2020. Pressure on the instrument's position is still exerted by the fact of investor distrust of risky assets amid the emergence of information regarding the spread of the new Omicron coronavirus strain.

In addition, the surge in "bearish" activity was caused by the release of a controversial report on the US labor market. In November, the American economy failed to meet high expectations for growth in the labor market and demonstrated the creation of only 210K new jobs outside the agricultural sector, while analysts' forecasts assumed an increase of 550K. At the same time, the Unemployment Rate, which collapsed from 4.6% to 4.2%, supported the market's confidence that the US Fed will nevertheless accelerate in terms of reducing existing incentives and move faster to raising interest rates.

Support and resistance

Bollinger Bands in D1 chart demonstrate a stable decrease. The price range is expanding but it fails to conform to the surge of "bearish" activity at the moment. MACD is going down, keeping a fairly stable sell signal (located below the signal line). Stochastic reversed back to the downside at the end of last week, but is located in the immediate vicinity of its zero values, indicating the risks of the oversold Australian dollar in the ultra-short term.

Resistance levels: 0.7050, 0.7100, 0.7160, 0.7200.
Support levels: 0.7000, 0.6950, 0.6900.

audusd-06122021-44.png


audusd-06122021-55.png


Trading tips

To open long positions, one can rely on the rebound from the support level of 0.7000 with the subsequent breakout of 0.7050 with the target at 0.7160. Stop-loss – 0.7000. Implementation time: 2-3 days.

The breakdown of 0.7000 may serve as a signal for new sales with the target at 0.6900. Stop-loss — 0.7050.

Use more opportunities of the NPBFX analytical portal: analytics

You can find more actual analytical reviews on other popular currency pairs, metals and CFDs on the NPBFX online portal. Daily analytics with charts, current market prognoses and trading scenarios in the Feed section are available. Get free and unlimited access to the online portal after registering on the official website of NPBFX Company.

If you have any questions about trading instruments, you can always ask an analyst in the online chat on the portal and get a free consultation of an experienced specialist.

Use the current recommendations of analysts on AUD/USD and trade efficiently with NPBFX.
 
XAU/USD: the price develops a corrective impulse 08.12.2021

Good afternoon, dear forum visitors!

NPBFX offers the latest release of analytics on XAU/USD for a better understanding of the current market situation and more efficient trading.

Current trend

Today, during the Asian session, gold prices grow moderately, developing the correctional impulse formed yesterday, and test the level of 1790.00 for a breakout, waiting for new drivers to appear.

More active positive dynamics are hindered by an increase in optimism in the market since the new strain of coronavirus will not be a significant obstacle to the further recovery of the global economy. Pressure on the instrument is also exerted by the rather strong positions of the American currency, as traders expect that the US Federal Reserve will accelerate the withdrawal of the quantitative easing (QE) program during the December meeting. Earlier, the head of the regulator, Jerome Powell, recognized the risks of systemic inflation and noted that additional efforts might be required to stabilize prices in the country.

The US labor market report for November released last Friday also signaled in favor of a faster monetary tightening. The unemployment rate fell sharply from 4.6% to 4.2%, well ahead of analysts' forecasts of a decline only to 4.5%.

Support and resistance

On the daily chart, Bollinger bands steadily decline. The price range narrows sharply, indicating an ambiguous nature of trading in the short term. The MACD indicator grows, maintaining a poor buy signal (the histogram is above the signal line). Stochastic shows more active growth but rapidly approaches its highs, indicating a limited potential for developing ultra-short-term corrective growth.

Resistance levels: 1790.00, 1800.00, 1812.22, 1822.10.
Support levels: 1778.32, 1769.67, 1760.74, 1750.44.

xauusd-08122021-55.png


xauusd-08122021-66.png


Trading tips

Long positions may be opened after the breakout of 1800.00 with the target at 1822.10. Stop loss – 1790.00. Implementation period: 2–3 days.

Short positions may be opened after the rebound from 1790.00 and the breakdown of 1778.32 with the target at 1760.74. Stop loss – 1790.00.

Use more opportunities of the NPBFX analytical portal: trading signals for commodities

How can a trader determine if it’s worth buying or selling XAU/USD now or better waiting for a more favorable period? Use trading signals for commodities from the top 10 technical indicators on the NPBFX portal and make the right decisions! All registered users have free and unlimited access to the minutely updated trading signals (MA10, BBands, Ichimoku, Stochastic, ZigZag, etc.) for Gold, Silver, Brent and WTI Crude oil.

If you have any questions about trading instruments, you can always ask an analyst in the online chat on the portal and get a free consultation of an experienced specialist.

Use the current recommendations of analysts on XAU/USD and trade efficiently with NPBFX.
 
EUR/USD: euro failed to take advantage of corrective growth 10.12.2021

Good afternoon, dear forum visitors!

NPBFX offers the latest release of analytics on EUR/USD for a better understanding of the current market situation and more efficient trading.

Current trend

The European currency shows ambiguous trading dynamics against the US dollar during the Asian session, consolidating near 1.1300 after a moderate decline the day before.

The pressure on the single currency yesterday was exerted by not the strongest macroeconomic statistics from Germany, as well as further strengthening of the American currency, which secured additional support from the published data on jobless claims.

The number of Initial Jobless Claims for the week ended December 3 decreased from 227K to 184K, which turned out to be significantly better than analysts' forecasts at the level of 215K. Strong data on the labor market serve as an additional argument in favor of a faster cut in the quantitative easing program from the US Fed. Nevertheless, investors are in no hurry to draw conclusions and prefer to wait for today's publication of November statistics on US consumer inflation. Germany will also present its inflation data at the end of the week. In addition, during the day there will be speeches by the President of the European Central Bank Christine Lagarde and two representatives of the regulator, Fabio Panetta and Frank Elderson.

Support and resistance

Bollinger Bands in D1 chart demonstrate flat dynamics. The price range is changing slightly, but remains rather spacious for the current level of activity in the market. MACD indicator is growing preserving a weak buy signal (located above the signal line). Stochastic is showing more confident growth; however, it is located near its highs, which indicates the risks of overbought EUR in the ultra-short term.

Resistance levels: 1.1300, 1.1355, 1.1400, 1.1422.
Support levels: 1.1255, 1.1200, 1.1153, 1.1100.

eurusd-10122021-55.png


eurusd-10122021-66.png


Trading tips

To open long positions, one can rely on the breakout of 1.1355 with the target at 1.1460. Stop-loss – 1.1300. Implementation time: 2-3 days.

The breakdown of 1.1255 may serve as a signal to new sales with the target at 1.1153. Stop-loss – 1.1300.

Use more opportunities of the NPBFX analytical portal: weekly FOREX forecast

You can learn more about the current situation on EUR/USD and get acquainted with the weekly analytical forecast in the "Video reviews" section on the NPBFX portal. Weekly video reviews contain trends, key levels, trading recommendations for such popular instruments as AUD/USD, GBP/USD, USD/CHF, USD/JPY. In order to get free and unlimited access to video forecast and other useful instruments on the portal, you need to register on the NPBFX website.

If you have any questions about trading instruments, you can always ask an analyst in the online chat on the portal and get a free consultation of an experienced specialist.

Use the current recommendations of analysts on EUR/USD and trade efficiently with NPBFX.
 
USD/JPY: USD is recovering its positions 13.12.2021

Good afternoon, dear forum visitors!

NPBFX offers the latest release of analytics on USD/JPY for a better understanding of the current market situation and more efficient trading.

Current trend

The American currency is showing an uptrend against the Japanese yen in Asian trading, recovering after the "bearish" end of last week's trading.

At the moment, the dollar is testing the level of 113.50 for a breakout in anticipation of the upcoming meeting of the US Fed and the actions of the regulator in the matter of tightening monetary policy. Last Friday, the US published inflation statistics, which did not meet investors' expectations, but reflected the fastest rise in consumer prices over the past 40 years. The last US Fed's meeting this year will take place on December 15 and it is likely that the regulator will accelerate the pace of reduction of the current quantitative easing (QE) program in order to move faster to raising interest rates.

The data released in Japan today do not provide additional support to the yen. Machinery Orders in October showed a sharp slowdown from 12.5% to 2.9% in annual terms, which is significantly worse than analysts' forecasts at 4.0%. Tankan Large All Industry Capex in Q4 2021 decreased from 10.1% to 9.3%, while the market expected 9.8%.

Support and resistance

Bollinger Bands in D1 chart demonstrate a moderate decrease. The price range is narrowing, reflecting the emergence of ambiguous dynamics of trading in the short term. MACD indicator is growing preserving a weak buy signal (located above the signal line). Stochastic, on the contrary, maintains a fairly confident downtrend and has not yet reacted to the dollar's attempt at corrective growth at the beginning of the week.

Resistance levels: 113.50, 114.00, 114.50, 115.00.
Support levels: 113.00, 112.50, 112.06.

USDJPY131221-33.png


USDJPY131221-333.png


Trading tips

To open long positions, one can rely on the breakout of 114.00 with the target at 115.00. Stop-loss – 113.50. Implementation time: 2-3 days.

The breakdown of 113.00 may serve as a signal to new sales with the target at 112.06. Stop-loss – 113.50.

Use more opportunities of the NPBFX analytical portal: E-book

If you just recently started to be interested in trading on FOREX and would like to deepen your knowledge, an electronic Beginner's Guide to FOREX Trading will be an excellent helper for you here. The book consists of 5 chapters and reflects fundamental concepts of the foreign exchange market to start successful trading. From the main chapters of the E-book you can learn about the concepts and history of FOREX, currencies and trend lines, technical indicators, types of orders, trading on news, psychology of trading, risk management and much more.

You can read a Beginner's guide to FOREX Trading online or download it free of charge from the NPBFX analytical portal in the "Education" section. In order to get unlimited access to the E-book and other useful instruments on the portal, you need to register on the NPBFX website.

If you have any questions about trading instruments, you can always ask an analyst in the online chat on the portal and get a free consultation of an experienced specialist.

Use the current recommendations of analysts on USD/JPY and trade efficiently with NPBFX.
 
XAU/USD: prices decline ahead of the US Fed meeting 15.12.2021

Good afternoon, dear forum visitors!

NPBFX offers the latest release of analytics on XAU/USD for a better understanding of the current market situation and more efficient trading.

Current trend

Gold prices are near 1770.00 after a noticeable downward correction recorded the day before. Market activity remains subdued as traders await the publication of the minutes of the US Federal Reserve meeting, which as many hope, will indicate a further tightening of the US regulator's rhetoric.

The US Federal Reserve is expected to announce an early completion of the bond purchase program, potentially bringing the next year's interest rate hikes forward. Previously, it was assumed that the regulator will fully complete the quantitative easing program by June 2022, but now it may turn out that the department will have ended it by March. However, skeptics argue that the Chairman of the US Fed, Jerome Powell, began the fight against high inflation too late, and therefore the regulator's plans will be adjusted more than once.

Additional support for the dollar is provided by the statistics on manufacturing inflation released yesterday. In November, the Producer Price Index excluding Food and Energy rose 0.7%, accelerating after rising 0.4% in October.

Support and resistance

Bollinger Bands in D1 chart demonstrate a moderate decrease. The price range is narrowing, pointing at the ambiguous nature of trading in the short term. MACD is declining keeping a weak sell signal (located below the signal line). Stochastic is showing more confident "bearish" dynamics, but is rapidly approaching its lows, indicating growing risks of the instrument being oversold in the ultra-short term.

Resistance levels: 1778.32, 1790.00, 1800.00, 1812.22.
Support levels: 1760.74, 1750.44, 1740.00.

XAUUSD151221-33.png


XAUUSD151221-333.png


Trading tips

To open new short positions, one can rely on the breakdown of 1760.74 with the target at 1740.00. Stop-loss – 1770.00. Implementation time: 1-2 days.

The return of the "bullish" trend to the market with the breakout of 1778.32 may become a signal for new purchases with the target of 1800.00. Stop-loss – 1765.00.

Use more opportunities of the NPBFX analytical portal: trading signals for commodities

How can a trader determine if it’s worth buying or selling XAU/USD now or better waiting for a more favorable period? Use trading signals for commodities from the top 10 technical indicators on the NPBFX portal and make the right decisions! All registered users have free and unlimited access to the minutely updated trading signals (MA10, BBands, Ichimoku, Stochastic, ZigZag, etc.) for Gold, Silver, Brent and WTI Crude oil.

If you have any questions about trading instruments, you can always ask an analyst in the online chat on the portal and get a free consultation of an experienced specialist.

Use the current recommendations of analysts on XAU/USD and trade efficiently with NPBFX.
 
Back
Top