NPBFX - making money with us since 1996!

Alcoa Corp.: technical analysis 29.08.2022

Good afternoon, dear forum visitors!

NPBFX offers the latest release of analytics on Alcoa Corp. for a better understanding of the current market situation and more efficient trading.

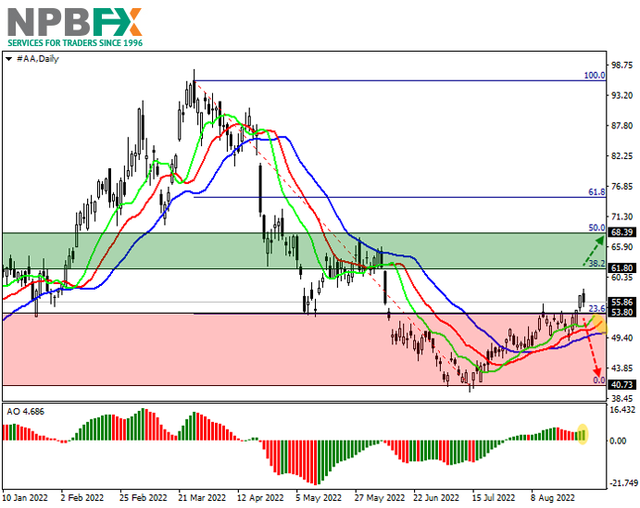
The shares of the American steel company Alcoa Corp. are trading at 56.00.

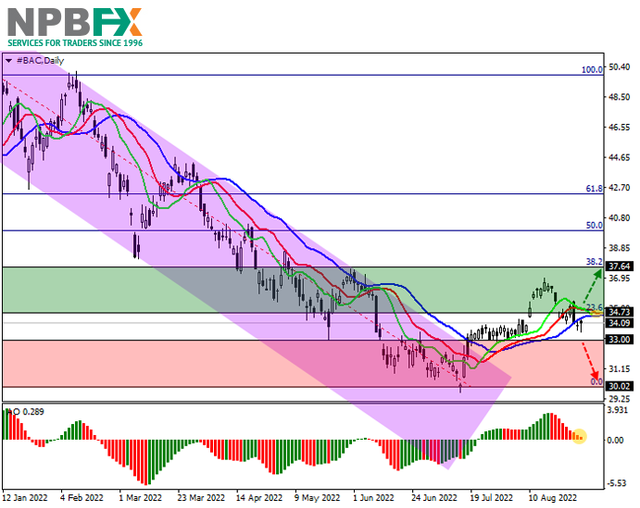
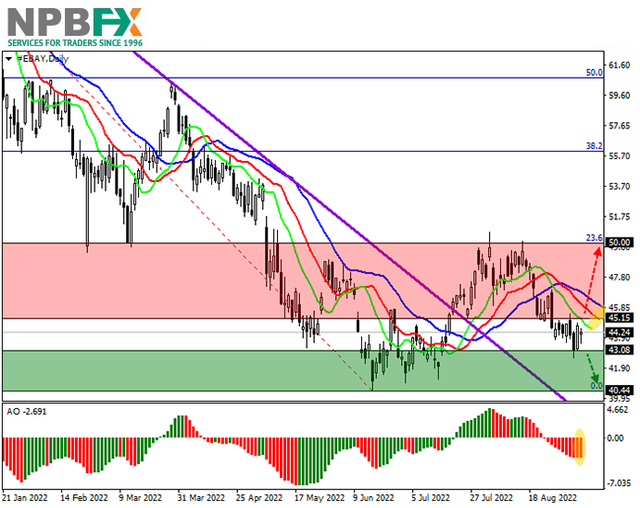
On the daily chart, the price is showing corrective dynamics after a prolonged downtrend, consolidated above the initial 23.6% Fibonacci retracement around 53.80.

On the four-hour chart, further movement of the quotes of the trading instrument will most likely continue in an uptrend since the key marker for the beginning of a full-fledged correction was received after consolidation above 23.6%. The next target is the basic correction of 38.2% Fibonacci around 61.80, the breakout of which will allow the issuer's shares to consolidate higher.

Technical indicators have reversed and keep a stable buy signal: indicator Alligator's EMA oscillation range expands upwards, and the AO oscillator histogram forms upward bars in the buying zone.

AA-290822-22.png


Trading tips

Long positions may be opened after the price rises and consolidates above 61.80 with the target at 68.40. Stop loss — 60.00. Implementation period: 7 days or more.

Short positions may be opened after a reversal, reduction, and consolidation of the price below 53.80 with the target at 40.70. Stop loss — 56.00.

Use more opportunities of the NPBFX analytical portal: analytics

You can find more actual analytical reviews on other popular currency pairs, metals and CFDs on the NPBFX online portal. Daily analytics with charts, current market prognoses and trading scenarios in the Feed section are available. Get free and unlimited access to the online portal after registering on the official website of NPBFX Company.

If you have any questions about trading instruments, you can always ask an analyst in the online chat on the portal and get a free consultation of an experienced specialist.

Use the current recommendations of analysts on Alcoa Corp. and trade efficiently with NPBFX.
 
Bank of America Corp.: technical analysis 31.08.2022

Good afternoon, dear forum visitors!

NPBFX offers the latest release of analytics on Bank of America Corp. for a better understanding of the current market situation and more efficient trading.

The shares of Bank of America Corp., the largest financial conglomerate in the US, are moving within the corrective trend of around 34.00.

On the daily chart, the price has left the global downward channel with dynamic boundaries at 27.00–33.00 and is trying to stay within the corrective trend that began after overcoming the initial 23.6% Fibonacci correction at 34.70.

On the four-hour chart, it is seen that the upward impulse has high prospects for implementation. However, they are relevant only after the quotes reconsolidation above 34.70.

Technical indicators keep a buy signal: indicator Alligator’s EMA oscillation range is directed upwards, although it is narrowing, and the histogram of the AO oscillator forms downward bars in the buying zone.

BAC-310822-11.png


Trading tips

Long positions may be opened after the price rises and consolidates above 34.70 with the target at 37.60. Stop loss — 33.00. Implementation period: 7 days or more.

Short positions may be opened after a reversal, reduction, and consolidation of the price below 33.00 with the target at 30.00. Stop loss — 34.00.

Use more opportunities of the NPBFX analytical portal: analytics

You can find more actual analytical reviews on other popular currency pairs, metals and CFDs on the NPBFX online portal. Daily analytics with charts, current market prognoses and trading scenarios in the Feed section are available. Get free and unlimited access to the online portal after registering on the official website of NPBFX Company.

If you have any questions about trading instruments, you can always ask an analyst in the online chat on the portal and get a free consultation of an experienced specialist.

Use the current recommendations of analysts on Bank of America Corp. and trade efficiently with NPBFX.
 
Johnson & Johnson: technical analysis 02.09.2022

Good afternoon, dear forum visitors!

NPBFX offers the latest release of analytics on Johnson & Johnson for a better understanding of the current market situation and more efficient trading.

The shares of Johnson & Johnson, one of the world's leading retail holdings, are correcting at 165.00.

On the daily chart of the asset, the price is moving within the global downward channel with dynamic boundaries 160.00–176.00 and, having bounced off the support line, is trying to consolidate in the uptrend.

The 4-hour chart of the asset shows that the channel support line is below the 100.0% underlying trend of the Fibonacci extension at 163.00, indicating a valid sell signal. The proximity of another level, 61.8% Fibonacci extension around 170.70, does not exclude the possibility of a slight upward correction.

Technically, the indicators signal in favor of the continuation of the decline: fast EMAs on the Alligator indicator are moving away from the signal line, and the AO oscillator histogram is falling in the sell zone, forming downward bars.

jnj-02092022-22.png


Trading tips

Short positions may be opened after the price drops and consolidates below 161.00 with the target at 151.20. Stop loss – 164.00. Implementation period: 7 days or more.

Long positions may be opened after the price rises and consolidates above 167.20 with the target at 170.70. Stop loss – 166.00.

Use more opportunities of the NPBFX analytical portal: E-book

If you just recently started to be interested in trading on FOREX and would like to deepen your knowledge, an electronic Beginner's Guide to FOREX Trading will be an excellent helper for you here. The book consists of 5 chapters and reflects fundamental concepts of the foreign exchange market to start successful trading. From the main chapters of the E-book you can learn about the concepts and history of FOREX, currencies and trend lines, technical indicators, types of orders, trading on news, psychology of trading, risk management and much more.

You can read a Beginner's guide to FOREX Trading online or download it free of charge from the NPBFX analytical portal in the "Education" section. In order to get unlimited access to the E-book and other useful instruments on the portal, you need to register on the NPBFX website.

If you have any questions about trading instruments, you can always ask an analyst in the online chat on the portal and get a free consultation of an experienced specialist.

Use the current recommendations of analysts on Johnson & Johnson and trade efficiently with NPBFX.
 
USD/CHF: American currency starts the trading week with poor growth 05.09.2022

Good afternoon, dear forum visitors!

NPBFX offers the latest release of analytics on USD/CHF for a better understanding of the current market situation and more efficient trading.

Current trend

During the Asian session, the USD/CHF pair is growing slightly, remaining around local highs since July 14, renewed at the end of last week after the release of the August report on the US labor market.

Non-farm payrolls added 315.0K after rising 526.0K last month, but the data pointed to a slowdown in average hourly wages and showed an increase in the unemployment rate from 3.5% to 3.7%, which reduced the likelihood of an interest rate hike by the US Federal Reserve by 75.0 basis points at the September meeting, but it is still premature to draw unambiguous conclusions.

US markets are closed for Labor Day on Monday, so key data is not expected until tomorrow when S&P and ISM August business statistics are released. In Switzerland, Q2 data on the dynamics of gross domestic product (GDP) will be published on Monday: the figure may decrease from 4.4% to 3% YoY and fall to zero MoM after rising by 0.5% in the first quarter.

Support and resistance

On the daily chart, Bollinger Bands are actively growing: the price range is expanding slightly from above but not as fast as the “bullish” sentiment develops. The MACD indicator is growing, keeping a poor buy signal (the histogram is above the signal line). Stochastic approached its highs and reversed into a horizontal plane, indicating that the US dollar may become overbought in the ultra-short term.

Resistance levels: 0.9859, 0.9930, 1.0000, 1.0050.
Support levels: 0.9807, 0.9762, 0.9700, 0.9650.

usdchf-05092022-55.png


usdchf-05092022-66.png


Trading tips

Long positions may be opened after the breakout of 0.9859 with the target at 1.0000. Stop loss – 0.9770. Implementation period: 2–3 days.

Short positions may be opened after the rebound from 0.9859 and the breakdown of 0.9762 with the target at 0.9650. Stop loss – 0.9830.

Use more opportunities of the NPBFX analytical portal: analytics

You can find more actual analytical reviews on other popular currency pairs, metals and CFDs on the NPBFX online portal. Daily analytics with charts, current market prognoses and trading scenarios in the Feed section are available. Get free and unlimited access to the online portal after registering on the official website of NPBFX Company.

If you have any questions about trading instruments, you can always ask an analyst in the online chat on the portal and get a free consultation of an experienced specialist.

Use the current recommendations of analysts on USD/CHF and trade efficiently with NPBFX.
 
GBP/USD: pound is again approaching the March lows of 2020 - 07.09.2022

Good afternoon, dear forum visitors!

NPBFX offers the latest release of analytics on GBP/USD for a better understanding of the current market situation and more efficient trading.

Current trend

The British pound is moderately declining, leveling the attempts of the "bulls" to show corrective growth at the beginning of the week. The GBP/USD pair is testing the level of 1.1450 for a breakdown, approaching the all-time lows of March 2020, updated last Monday.

Support for the US currency was provided by strong macroeconomic statistics from the US, published the day before. The ISM Services Employment Index in August strengthened from 49.1 points to 50.2 points, while the forecast was for a decline to 48.2 points, and the ISM Services PMI over the same period increased from 56.7 points to 56.9 points against the background of preliminary estimates of experts on the decline to 55.1 points. In turn, the ISM Services New Orders Index corrected from 59.9 points to 61.8 points, while analysts had expected a reduction to 57.0 points. The data again reflected the resilience of the US economy, which allows the US Federal Reserve to continue the "hawkish" monetary policy to combat high inflation, especially given the further rise in energy prices.

Today, the focus of investors will be hearing the report on inflation, as well as a number of speeches by representatives of the Bank of England, including its Governor Andrew Bailey.

Traders continue to evaluate the results of the election of the leader of the Conservative Party and Prime Minister of Great Britain, which was won by Liz Truss. The official and the new government will have to focus on problems in the national economy, which, having failed to fully recover from the coronavirus pandemic, is under pressure from recession risks, as inflation updates new anti-records, and the national currency has accelerated the fall against the US dollar to the lows of 1985. In addition, the situation is aggravated against the backdrop of a rapidly developing energy crisis: due to the rise in prices for "blue fuel" after the start of the military conflict in Eastern Europe, consumer prices in the country, according to forecasts by analysts from the investment bank Goldman Sachs Group Inc. may exceed 22.0%, and the economy in this case will shrink by 3.4%.

Support and resistance

Bollinger Bands in D1 chart demonstrate a stable decrease. The price range expands slightly from below, making way for new local lows for the "bears". MACD is declining keeping a weak sell signal (located below the signal line). Stochastic, on the other hand, remains in an uptrend, retreating from its lows, indicating that the pound is oversold in the ultra-short term.

Resistance levels: 1.1531, 1.1600, 1.1647, 1.1700.
Support levels: 1.1442, 1.1380, 1.1300, 1.1250.

gbpusd-07092022-55.png


gbpusd-07092022-66.png


Trading tips

Short positions may be opened after a breakdown of 1.1442 with the target at 1.1300. Stop-loss — 1.1510. Implementation time: 1-2 days.

A rebound from 1.1442 as from support followed by a breakout of 1.1531 may become a signal for opening new long positions with the target at 1.1700. Stop-loss — 1.1442.

Use more opportunities of the NPBFX analytical portal: weekly FOREX forecast

You can learn more about the current situation on GBP/USD and get acquainted with the weekly analytical forecast in the "Video reviews" section on the NPBFX portal. Weekly video reviews contain trends, key levels, trading recommendations for such popular instruments as GBP/USD, EUR/USD, USD/CHF, USD/JPY. In order to get free and unlimited access to video forecast and other useful instruments on the portal, you need to register on the NPBFX website.

If you have any questions about trading instruments, you can always ask an analyst in the online chat on the portal and get a free consultation of an experienced specialist.

Use the current recommendations of analysts on GBP/USD and trade efficiently with NPBFX.
 
eBay Inc.: technical analysis 09.09.2022

Good afternoon, dear forum visitors!

NPBFX offers the latest release of analytics on eBay Inc. for a better understanding of the current market situation and more efficient trading.

Shares of eBay Inc., an American online retailer, are trading at 44.00.

On the daily chart, the price, having left the limits of the global downwards channel with dynamic boundaries 38.00–45.00, is kept above it, despite approaching the previously passed resistance level.

On the four-hour chart, it is seen that the attempt to enter a full-fledged correction failed, the initial Fibonacci 23.6% correction level at 50.00 was not broken, and the quotes received a downward impulse, directing them to the year's low at 40.40, which may be reached in the coming days.

Technical indicators have reversed and are holding a stable sell signal: fast EMAs on the Alligator indicator are below the signal line, and the AO oscillator histogram forms downward bars in the sell zone.

ebay-09092022-22.png


Trading tips

Short positions may be opened after the consolidation below 43.10 with the target at 40.40. Stop loss – 44.20. Implementation period: 7 days or more.

Long positions may be opened after the price rises and consolidates above 45.10 with the target at 50.00 and stop loss 43.00.

Use more opportunities of the NPBFX analytical portal: glossary

Beginning traders certainly face a lot of specialized concepts and lexicon on FOREX, which are often not fully been understood. Swap, tick, hedge, margin calls are often unfamiliar to beginning traders. But the lack of knowledge of these fundamentals make a competent market vision impossible. So glossary on the NPBFX analytical portal could be an excellent helper in this case, which contains all the main definitions with explanations in a compact and accessible form. All concepts are arranged in alphabetical order, so that you can easily and quickly find and explore a new concept for yourself.

If you have any questions about trading instruments, you can always ask an analyst in the online chat on the portal and get a free consultation of an experienced specialist.

Use the current recommendations of analysts on eBay Inc. and trade efficiently with NPBFX.
 
GBP/USD: corrective growth at the beginning of a new trading week 12.09.2022

Good afternoon, dear forum visitors!

NPBFX offers the latest release of analytics on GBP/USD for a better understanding of the current market situation and more efficient trading.

Current trend

The GBP/USD pair shows ambiguous trading dynamics during the morning session on September 12, consolidating near 1.1600. Investors are in no hurry to open new positions, preferring to wait for the publication of macroeconomic statistics from the UK.

July's gross domestic product (GDP) data is expected to be released today, and analysts' forecasts suggest that the British economy will be able to show growth of 0.5% after declining by 0.6% in June. Also, during the day, traders will pay attention to statistics on the dynamics of industrial production, as well as preliminary estimates of inflation and August GDP from NIESR. Tomorrow, a full report on the labor market for July-August will be published, and on Wednesday, statistics on inflation will be released, which is a key parameter for the Bank of England, which is also set to fight against high consumer prices, despite the threat of a recession. The August indicator may reach another record high of 10.2% YoY.

Last week, Prime Minister Liz Truss announced new economic measures to support the population in the face of the energy crisis. In particular, about 90.0B pounds will be directed to social assistance for households (each family will be paid 400 pounds to compensate for electricity and gas tariffs, which have been steadily rising recently). Also, the new government will impose a limit on accounts of 2.5K pounds a year, which, in turn, will be a catalyst for slowing inflation by 5.0 percentage points, as well as reducing budget spending on social payments and debt servicing. According to analysts' calculations, without the implementation of this initiative, the bill by the beginning of next year would have increased by up to 3.5K pounds a year, and if energy prices continued to rise, by the spring, it would have reached 5.0K pounds, forcing British families to give about 15% their income from heating and electricity.

Support and resistance

On the daily chart, Bollinger bands show a reversal in the horizontal plane: the price range is narrowing from above, reflecting the emergence of ambiguous dynamics in the short term. MACD is growing, maintaining a relatively strong buy signal and above the signal line. Stochastic also shows active growth, close to its highs and indicating that the pound may become overbought in the ultra-short term.

Resistance levels: 1.1647, 1.1700, 1.1759, 1.1800.
Support levels: 1.1600, 1.1531, 1.1442, 1.1380.

gbpusd-12092022-55.png


gbpusd-12092022-66.png


Trading tips

Long positions may be opened after the breakout of 1.1647 with the target at 1.1759. Stop loss – 1.1600. Implementation period: 1–2 days.

Short positions may be opened after the rebound from 1.1647 as a resistance and a breakdown of 1.1600 with the target at 1.1442. Stop loss – 1.1700.

Use more opportunities of the NPBFX analytical portal: E-book

If you just recently started to be interested in trading on FOREX and would like to deepen your knowledge, an electronic Beginner's Guide to FOREX Trading will be an excellent helper for you here. The book consists of 5 chapters and reflects fundamental concepts of the foreign exchange market to start successful trading. From the main chapters of the E-book you can learn about the concepts and history of FOREX, currencies and trend lines, technical indicators, types of orders, trading on news, psychology of trading, risk management and much more.

You can read a Beginner's guide to FOREX Trading online or download it free of charge from the NPBFX analytical portal in the "Education" section. In order to get unlimited access to the E-book and other useful instruments on the portal, you need to register on the NPBFX website.

If you have any questions about trading instruments, you can always ask an analyst in the online chat on the portal and get a free consultation of an experienced specialist.

Use the current recommendations of analysts on GBP/USD and trade efficiently with NPBFX.
 
PayPal Holdings Inc.: technical analysis 14.09.2022

Good afternoon, dear forum visitors!

NPBFX offers the latest release of analytics on PayPal Holdings Inc. for a better understanding of the current market situation and more efficient trading.

Shares of PayPal Holdings Inc., an American debit payment processor, correct at 95.00.

On the daily chart, the price is moving in a global downtrend, trying to correct, but it is still premature to talk about full-fledged growth since the quotes have not yet overcome the initial Fibonacci 23.6% correction around 125.00.

On the four-hour chart, a local correction is developing within the corridor of 89.50–102.00, the breakout of which will be a key moment for further global growth of the trading instrument.

Technical indicators reversed and gave a buy signal: fast EMAs on the Alligator indicator crossed the signal line upwards, and the AO oscillator histogram is forming rising bars in the buying zone.

pypl-14092022-44.png


Trading tips

Long positions may be opened after the price rises and consolidates above 102.00 with the target at 125.00. Stop loss – 98.00. Implementation period: 7 days or more.

Short positions may be opened after a reversal, reduction, and consolidation of the price below 89.50 with the target at 69.00. Stop loss – 95.00.

Use more opportunities of the NPBFX analytical portal: analytics

You can find more actual analytical reviews on other popular currency pairs, metals and CFDs on the NPBFX online portal. Daily analytics with charts, current market prognoses and trading scenarios in the Feed section are available. Get free and unlimited access to the online portal after registering on the official website of NPBFX Company.

If you have any questions about trading instruments, you can always ask an analyst in the online chat on the portal and get a free consultation of an experienced specialist.

Use the current recommendations of analysts on PayPal Holdings Inc. and trade efficiently with NPBFX.
 
Apple Inc.: technical analysis 16.09.2022

Good afternoon, dear forum visitors!

NPBFX offers the latest release of analytics on Apple Inc. for a better understanding of the current market situation and more efficient trading.

Shares of Apple Inc., the global giant in the development and sale of personal and tablet computers, are moving in a corrective trend around 152.00.

On the daily chart, the quotes remain within the global Expanding formation pattern, forming a new downward wave, which has already almost reached its intermediate target at the 61.8% Fibonacci full retracement around 146.00.

On the four-hour chart, it can be seen that the current movement is developing according to the classical structure. After rebounding from the initial correction of 23.6% Fibonacci around 163.80, the price continued its global decline, almost breaking the intermediate correction of 50.0% Fibonacci around 151.50, which is key support for the current trend.

Technical indicators confirm the high probability of continued decline: the Alligator indicator's EMA oscillation range expands downwards, and the histogram of the AO oscillator forms downward bars in the sell zone.

aapl-16092022-33.png


Trading tips

Short positions may be opened after the price drops and consolidates below 151.50 with the target at 146.40. Stop loss – 154.00. Implementation period: 7 days or more.

Long positions may be opened after the price rises and consolidates above 157.10 with the target at 163.80 and stop loss 155.00.

Use more opportunities of the NPBFX analytical portal: weekly FOREX forecast

You can learn more about the current situation on Apple Inc. and get acquainted with the weekly analytical forecast in the "Video reviews" section on the NPBFX portal. Weekly video reviews contain trends, key levels, trading recommendations for such popular instruments as GBP/USD, EUR/USD, USD/CHF, USD/JPY. In order to get free and unlimited access to video forecast and other useful instruments on the portal, you need to register on the NPBFX website.

If you have any questions about trading instruments, you can always ask an analyst in the online chat on the portal and get a free consultation of an experienced specialist.

Use the current recommendations of analysts on Apple Inc. and trade efficiently with NPBFX.
 
AUD/USD: decline pending US Fed decision 19.09.2022

Good afternoon, dear forum visitors!

NPBFX offers the latest release of analytics on AUD/USD for a better understanding of the current market situation and more efficient trading.

Current trend

The Australian dollar shows near-zero trading dynamics, consolidating at 0.6700. At the end of last week, the AUD/USD pair managed to show a slight corrective growth and retreated from the record lows of June 2020. Market activity remains low as market participants look forward to a two-day meeting of the US Federal Reserve. Investors are counting on an increase in interest rates by the US regulator by another 75 basis points, with some analysts pointing to a possible correction by 100 basis points at once. In addition, the department is expected to publish updated forecasts for inflation and economic growth. Macroeconomic statistics, which have been released recently, allows us to expect that the US economy will cope with a sharp increase in the cost of borrowing. In any case, at the moment the likelihood of a recession remains low, especially compared to Europe.

Australian investors are also waiting for the publication of the minutes of the meeting of the Reserve Bank of Australia (RBA) on Tuesday. Over the past 5 months, the Australian regulator raised the interest rate by 225 basis points to 2.35%. At the same time, the Governor of the RBA, Philip Lowe, pointed to the continuation of the course of tightening monetary policy in the future.

Support and resistance

Bollinger Bands in D1 chart demonstrate a moderate decrease. The price range is narrowing, reflecting ambiguous dynamics of trading in the short term. MACD is going down, keeping a fairly stable sell signal (located below the signal line). Stochastic, having fallen below the level of "20", reversed into a horizontal plane, indicating the risks of corrective growth in the ultra-short term.

Resistance levels: 0.6750, 0.6800, 0.6853, 0.6900.
Support levels: 0.6700, 0.6650, 0.6600, 0.6550.

audusd-19092022-55.png


audusd-19092022-66.jpg


Trading tips

Short positions may be opened after a breakdown of 0.6650 with the target at 0.6550. Stop-loss — 0.6700. Implementation time: 2-3 days.

The breakout of 0.6750 may be a signal to open new long positions with the target of 0.6853. Stop-loss — 0.6700.

Use more opportunities of the NPBFX analytical portal: glossary

Beginning traders certainly face a lot of specialized concepts and lexicon on FOREX, which are often not fully been understood. Swap, tick, hedge, margin calls are often unfamiliar to beginning traders. But the lack of knowledge of these fundamentals make a competent market vision impossible. So glossary on the NPBFX analytical portal could be an excellent helper in this case, which contains all the main definitions with explanations in a compact and accessible form. All concepts are arranged in alphabetical order, so that you can easily and quickly find and explore a new concept for yourself.

If you have any questions about trading instruments, you can always ask an analyst in the online chat on the portal and get a free consultation of an experienced specialist.

Use the current recommendations of analysts on AUD/USD and trade efficiently with NPBFX.
 
Back
Top