NPBFX - making money with us since 1996!

USD/CAD: the pair continues declining actively 17.05.2021

Good afternoon, dear forum visitors!

NPBFX offers the latest release of analytics on USD/CAD for a better understanding of the current market situation and more efficient trading.

Current trend

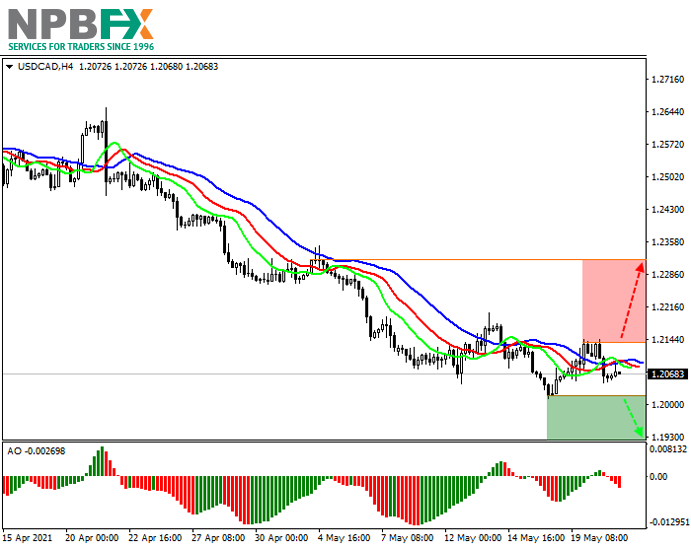
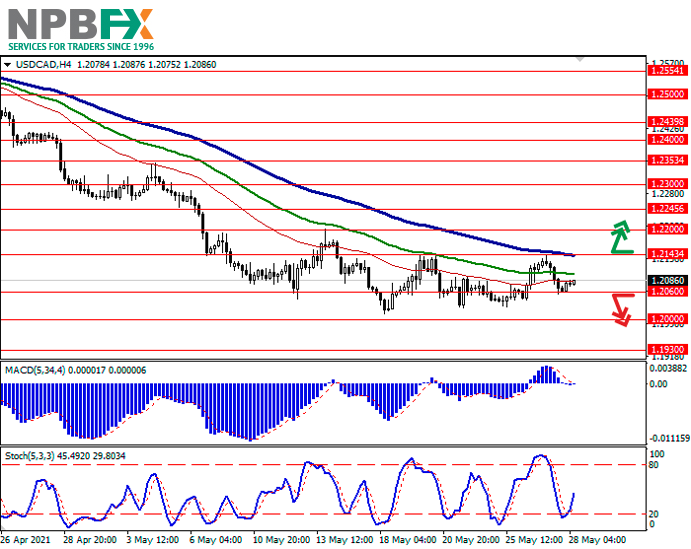
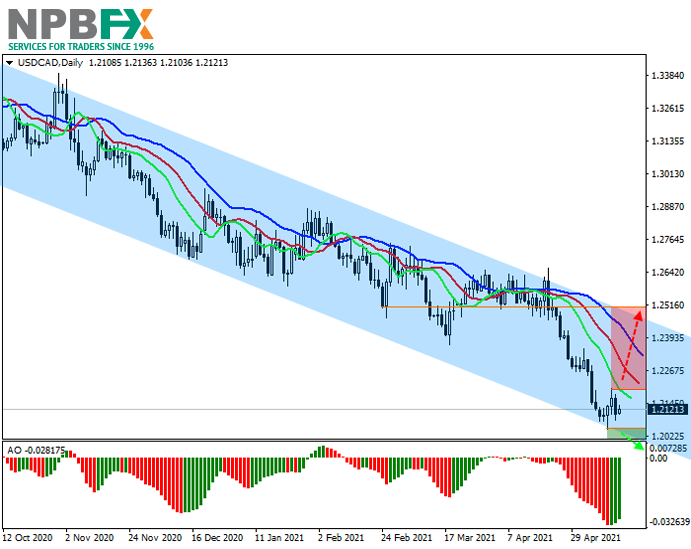
The USD/CAD pair is showing a downtrend, trading at 1.2121.

CAD continues to rise, hitting a record high since 2015 last Friday. The positive dynamics is facilitated by a sharp increase in global demand for manufactured goods and raw materials, the export leader of which is Canada. The price of lumber has increased by more than 49% since the beginning of the year, oil prices are in an uptrend, and demand for wheat and industrial metals such as copper has also increased significantly. In addition, a 173% increase in car sales in March and an increase in domestic wholesale sales of 2.8% should be noted.

USD began to decline again after the publication of disappointing macroeconomic statistics from the US. Retail sales excluding autos in April decreased by 0.8%, which was not expected by analysts, who predicted an increase of 0.7%. The volume of retail sales in April did not change, while analysts had expected the indicator to rise by 1.0%. Finally, industrial production grew by only 0.7%, which is worse than the 1.0% forecast.

Support and resistance

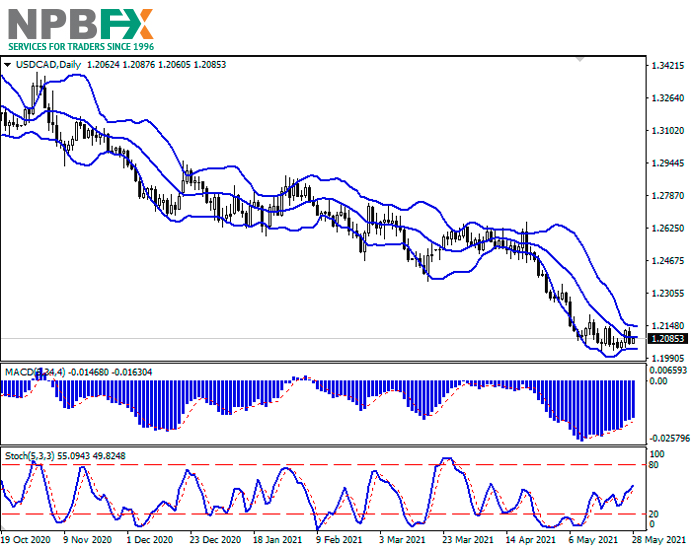
On the global chart, the price continues to form a descending channel. Technical indicators maintain the global sell signal. Fast EMAs on the Alligator indicator are below the signal line, and the AO oscillator histogram is trading in the sell zone.

Resistance levels: 1.2200, 1.2500.
Support levels: 1.2045, 1.1950.

USDCAD170521-11.png


Trading tips

If the asset continues declining and the price consolidates below the local support level at 1.2045, short positions can be opened with the target at 1.1950. Stop-loss – 1.2100. Implementation time: 7 days and more.

If the asset reverses and continues growing and the price consolidates above the local resistance level at 1.2200, long positions will be relevant with target at 1.2500. Stop-loss – 1.2100.

Use more opportunities of the NPBFX analytical portal: weekly FOREX forecast

You can learn more about the current situation on USD/CAD and get acquainted with the weekly analytical forecast in the "Video reviews" section on the NPBFX portal. Weekly video reviews contain trends, key levels, trading recommendations for such popular instruments as EUR/USD, GBP/USD, USD/JPY, AUD/USD. In order to get free and unlimited access to video forecast and other useful instruments on the portal, you need to register on the NPBFX website.

If you have any questions about trading instruments, you can always ask an analyst in the online chat on the portal and get a free consultation of an experienced specialist.

Use the current recommendations of analysts on USD/CAD and trade efficiently with NPBFX.
 
Brent Crude Oil: pending decisions on the Iranian nuclear deal 19.05.2021

Good afternoon, dear forum visitors!

NPBFX offers the latest release of analytics on Brent Crude Oil for a better understanding of the current market situation and more efficient trading.

Current trend

Brent crude prices continue their correctional movement, trading at 68.00 after another attempt to consolidate above the key level of 70.00.

Analysts point to possible significant progress in negotiations between the United States and Iran on the renewal of the nuclear deal. If the parties are able to agree, and the US authorities will not extend the sanctions against Tehran, this will allow Iran to significantly increase the supply of cheap "black gold" to the world market.

Yesterday, the American Petroleum Institute (API) released data on weekly stocks, which increased by 0.620M barrels, which is lower than the expected increase of 1.680M. Today, the Energy Information Administration (EIA) of the US Department of Energy will publish its report, which is predicted to show an increase in reserves of 1.623M barrels. However, if the actual data demonstrate a decrease in the indicator, the local trend in the asset may again change to an uptrend.

Support and resistance

On the local chart, the asset continues to trade close to the global high, forming a sideways channel with the boundaries of 70.00–66.50.

Technical indicators are in a state of uncertainty: the fast EMAs of the Alligator indicator are below the signal line, and the histogram of the AO oscillator has moved into the sell zone, forming the first bar below the zero level.

Resistance levels: 70.20, 74.00.
Support levels: 66.70, 63.00.

Brent-Crude-Oil-190521-11.png


Trading tips

If the asset reverses and continues growing and the price consolidates above the local resistance level at 70.20, long positions will be relevant with target at 74.00. Stop-loss – 68.00. Implementation time: 7 days and more.

If the asset continues to decline and the price consolidates below the local support at 66.70, short positions can be opened with the target at 63.00. Stop-loss – 68.00.

Use more opportunities of the NPBFX analytical portal: trading signals for commodities

How can a trader determine if it’s worth buying or selling Brent Crude Oil now or better waiting for a more favorable period? Use trading signals for commodities from the top 10 technical indicators on the NPBFX portal and make the right decisions! All registered users have free and unlimited access to the minutely updated trading signals (MA10, BBands, Ichimoku, Stochastic, ZigZag, etc.) for Gold, Silver, Brent and WTI Crude oil.

If you have any questions about trading instruments, you can always ask an analyst in the online chat on the portal and get a free consultation of an experienced specialist.

Use the current recommendations of analysts on Brent Crude Oil and trade efficiently with NPBFX.
 
USD/CAD: downtrend persists 21.05.2021

Good afternoon, dear forum visitors!

NPBFX offers the latest release of analytics on USD/CAD for a better understanding of the current market situation and more efficient trading.

Current trend

The USD/CAD pair is demonstrating a downward trend, trading at the level of 1.2073, despite the negative outlook on the financial system from the Bank of Canada.

In the submitted report, the regulator highlighted the increased vulnerability of households that took out mortgage loans that do not correspond to their real income. Among the main threats to financial stability, there is a problem of increased demand for liquidity in the bond market, which banks are unable to provide in the current period of increased load. Summarizing the report, Governor of the Bank of Canada Tiff Macklem assured that in this difficult period the department would react to all current and new risks, so there are no serious concerns for the state of the economy.

Yesterday, the American currency did not show clear dynamics, as investors reacted differently to the incoming macroeconomic information. On the one hand, USD was supported by the decrease in Initial Jobless Claims, which amounted to 444K, which is lower than the projected 450K. On the other hand, the manufacturing activity index for May fell very sharply to 31.5 points from 50.2 points for April.

Support and resistance

Locally, the price is forming a downtrend. Technical indicators keep the global sell signal: fast EMAs on the Alligator indicator are below the signal one, and the AO oscillator histogram is trading in the sell zone.

Resistance levels: 1.2133, 1.2317.
Support levels: 1.2022, 1.1900.

USDCAD210521-11.png


Trading tips

After decline or consolidation below the local support of 1.2022, sell positions with the target at 1.1900 are relevant. Stop loss – 1.2080. Implementation period: 7 days or more.

After reversal and growth or consolidation above the local resistance level of 1.2133, buy positions with the target at 1.2317 will be relevant. Stop loss – 1.2070.

Use more opportunities of the NPBFX analytical portal: weekly FOREX forecast

You can learn more about the current situation on USD/CAD and get acquainted with the weekly analytical forecast in the "Video reviews" section on the NPBFX portal. Weekly video reviews contain trends, key levels, trading recommendations for such popular instruments as EUR/USD, GBP/USD, USD/JPY, AUD/USD. In order to get free and unlimited access to video forecast and other useful instruments on the portal, you need to register on the NPBFX website.

If you have any questions about trading instruments, you can always ask an analyst in the online chat on the portal and get a free consultation of an experienced specialist.

Use the current recommendations of analysts on USD/CAD and trade efficiently with NPBFX.
 
NZD/USD: the instrument is waiting for new drivers 24.05.2021

Good afternoon, dear forum visitors!

NPBFX offers the latest release of analytics on NZD/USD for a better understanding of the current market situation and more efficient trading.

Current trend

NZD is showing ambiguous performance against USD during today's morning session, building on the flat trend that has emerged in recent days.

Today, NZD is receiving little support from strong macroeconomic statistics from New Zealand. Meanwhile, retail sales in Q1 2021 showed solid 2.5% QoQ growth after a 2.7% QoQ decline last month. Analysts had expected the negative dynamics to worsen to –4.4% QoQ. Retail Sales excluding Autos for the same period accelerated from +4.8% QoQ to +6.8% QoQ, significantly outperforming the projected +1.9% QoQ.

Market activity remains subdued as investors expect new drivers to emerge. One of such events will be the meeting of the Reserve Bank of New Zealand on interest rates, which will be held on Wednesday, May 26. Analysts do not expect changes in the vector of monetary policy, but comments from officials will continue to be important.

Support and resistance

Bollinger Bands in D1 chart demonstrate flat dynamics. The price range is almost unchanged, but it remains rather spacious for the current level of activity in the market. MACD is going down, keeping a fairly stable sell signal (located below the signal line). Stochastic, having approached the level of "20", reversed into a horizontal plane, indicating the risks of oversold instrument in the ultra-short term.

Resistance levels: 0.7200, 0.7250, 0.7305, 0.7350.
Support levels: 0.7150, 0.7100, 0.7050, 0.7000.

NZDUSD240521-33.png


NZDUSD240521-333.png


Trading tips

To open long positions, one can rely on the rebound from the support level of 0.7150 with the subsequent breakout of 0.7200. Take-profit – 0.7250. Stop-loss – 0.7175. Implementation time: 2-3 days.

The breakdown of 0.7150 may serve as a signal to new sales with the target at 0.7100. Stop-loss – 0.7180.

Use more opportunities of the NPBFX analytical portal: glossary

Beginning traders certainly face a lot of specialized concepts and lexicon on FOREX, which are often not fully been understood. Swap, tick, hedge, margin calls are often unfamiliar to beginning traders. But the lack of knowledge of these fundamentals make a competent market vision impossible. So glossary on the NPBFX analytical portal could be an excellent helper in this case, which contains all the main definitions with explanations in a compact and accessible form. All concepts are arranged in alphabetical order, so that you can easily and quickly find and explore a new concept for yourself.

If you have any questions about trading instruments, you can always ask an analyst in the online chat on the portal and get a free consultation of an experienced specialist.

Use the current recommendations of analysts on NZD/USD and trade efficiently with NPBFX.
 
GBP/USD: waiting for new drivers 26.05.2021

Good afternoon, dear forum visitors!

NPBFX offers the latest release of analytics on GBP/USD for a better understanding of the current market situation and more efficient trading.

Current trend

GBP is strengthening against USD during the morning session, again trying to recover after the flat start of the trading this week.

Investors expect new drivers to appear on the market, but for now they are only sluggishly taking a lead from the US macroeconomic statistics. On Tuesday, additional pressure on USD was exerted by data on the dynamics of new home sales, which reflected a decrease in the indicator by 5.9% MoM in April after rising by 7.4% MoM in March. In absolute terms, sales fell from 0.917M to 0.863M, while the market expected an increase in volume to 0.95M.

At the same time, house prices continue to rise moderately as the US economy recovers. Housing Price Index in March accelerated from +1.1% MoM to +1.4% MoM. In turn, the S&P/Case-Shiller Home Price Indices for the same period added 13.3% YoY after increasing by 12% YoY in February.

Support and resistance

Bollinger Bands in D1 chart show moderate growth. The price range is narrowing, reflecting appearance of multi-directional dynamics in the short term. MACD is slightly declining preserving a previous sell signal (located below the signal line). Stochastic reversed horizontally approximately at the center of its area, pointing to the temporary balance of power in the ultra-short term.

Resistance levels: 1.4200, 1.4232, 1.4275.
Support levels: 1.4150, 1.4100, 1.4050, 1.4000.

GBPUSD260521-33.png


GBPUSD260521-333.png


Trading tips

To open long positions, one can rely on the breakout of 1.4200. Take-profit – 1.4275–1.4300. Stop-loss – 1.4150. Implementation time: 2-3 days.

A rebound from 1.4200 as from resistance, followed by a breakdown of 1.4150 may become a signal for new sales with the target at 1.4050. Stop-loss – 1.4200.

Use more opportunities of the NPBFX analytical portal: economic calendar

Be ready for any market changes through global events using the economic calendar on the NPBFX portal. The calendar contains all the most important events of the world economy and prognoses for them. In order to get free and unlimited access to the economic calendar and other useful instruments on the portal, you need to pass a one-time registration on the NPBFX website.

If you have any questions about trading instruments, you can always ask an analyst in the online chat on the portal and get a free consultation of an experienced specialist.

Use the current recommendations of analysts on GBP/USD and trade efficiently with NPBFX.
 
USD/CAD: the pair ends the week with flat dynamics 28.05.2021

Good afternoon, dear forum visitors!

NPBFX offers the latest release of analytics on USD/CAD for a better understanding of the current market situation and more efficient trading.

Current trend

Today during the Asian session, the USD/CAD pair is growing slightly, compensating for the decline yesterday, which prevented the formation of a corrective uptrend in the ultra-short term.

Yesterday’s US positive macroeconomic statistics on Initial Jobless Claims supported the "bullish" sentiment for the dollar; however, USD growth was still limited by the unclear prospects of the US FRS monetary policy. Although several bank representatives admitted that they are ready to discuss curtailing stimulus measures, the department does not plan to rush with them.

On Friday, the market expects the publication of a block of US macroeconomic statistics on the dynamics of personal income and spending for April, which may hint at the future policy of the American regulator.

Support and resistance

On the daily chart, Bollinger Bands reverse into a horizontal plane. The price range practically does not change but it remains spacious enough for the current level of activity for the instrument. The MACD indicator grows, maintaining a relatively strong buy signal (the histogram is above the signal line). Stochastic demonstrates similar dynamics, being located approximately in the center of its working area. However, its current readings are slightly correlated with the real dynamics in the market.

Technical indicators do not contradict the possible resumption of the correctional growth of the US currency soon.

Resistance levels: 1.2143, 1.2200, 1.2245, 1.2300.
Support levels: 1.2060, 1.2000, 1.1930.

USDCAD280521-33.png


USDCAD280521-333.png


Trading tips

Long positions may be opened after the breakout of 1.2143 with the target at 1.2245. Stop loss – 1.2090. Implementation period: 1–2 days.

Short positions may be opened after the breakdown of 1.2060 with the target at 1.1930. Stop loss – 1.2130.

Use more opportunities of the NPBFX analytical portal: weekly FOREX forecast

You can learn more about the current situation on USD/CAD and get acquainted with the weekly analytical forecast in the "Video reviews" section on the NPBFX portal. Weekly video reviews contain trends, key levels, trading recommendations for such popular instruments as EUR/USD, GBP/USD, USD/JPY, AUD/USD. In order to get free and unlimited access to video forecast and other useful instruments on the portal, you need to register on the NPBFX website.

If you have any questions about trading instruments, you can always ask an analyst in the online chat on the portal and get a free consultation of an experienced specialist.

Use the current recommendations of analysts on USD/CAD and trade efficiently with NPBFX.
 
AUD/USD: flat trading 31.05.2021

Good afternoon, dear forum visitors!

NPBFX offers the latest release of analytics on AUD/USD for a better understanding of the current market situation and more efficient trading.

Current trend

AUD has shown moderate gains against USD during the Asian session, trying to recover from a decline late last week that led to renewed local lows since May 4.

Moderate support for the instrument is provided by macroeconomic statistics from Australia and China. Private Sector Credit in Australia in April showed an increase of 0.2% MoM after increasing by 0.4% MoM in March. In annual terms, credit growth rates increased from +1.0% YoY to +1.3% YoY.

The Chinese data showed a solid growth in the Non-Manufacturing PMI. In May, the indicator increased from 54.9 to 55.2 points, while analysts expected it to decline to 52.7 points. NBS Manufacturing PMI, in turn, slightly decreased from 51.1 to 51.0 points in May, while experts did not expect any changes at all.

Investors are now awaiting the Reserve Bank of Australia's interest rate decision with a follow-up press conference on Tuesday.

Support and resistance

In the D1 chart, Bollinger Bands are reversing horizontally. The price range practically does not change, limiting short-term "bears" in further development. MACD is declining keeping a weak sell signal (located below the signal line). Stochastic shows an unstable oscillatory dynamics approximately at the center of its area, pointing to the balance of power in the ultra-short term.

Resistance levels: 0.7750, 0.7770, 0.7800, 0.7816.
Support levels: 0.7700, 0.7676, 0.7636, 0.7600.

AUDUSD310521-33.png


AUDUSD310521-333.png


Trading tips

To open long positions, one can rely on a confident breakout of 0.7750. Take-profit – 0.7800–0.7816. Stop-loss – 0.7715. Implementation time: 1-2 days.

The return of "bearish" trend with the breakdown of 0.7700 may become a signal for new sales with the target at 0.7600. Stop-loss – 0.7750.

Use more opportunities of the NPBFX analytical portal: glossary

Beginning traders certainly face a lot of specialized concepts and lexicon on FOREX, which are often not fully been understood. Swap, tick, hedge, margin calls are often unfamiliar to beginning traders. But the lack of knowledge of these fundamentals make a competent market vision impossible. So glossary on the NPBFX analytical portal could be an excellent helper in this case, which contains all the main definitions with explanations in a compact and accessible form. All concepts are arranged in alphabetical order, so that you can easily and quickly find and explore a new concept for yourself.

If you have any questions about trading instruments, you can always ask an analyst in the online chat on the portal and get a free consultation of an experienced specialist.

Use the current recommendations of analysts on AUD/USD and trade efficiently with NPBFX.
 
XAU/USD: prices are adjusted for the second session in a row 2.06.2021

Good afternoon, dear forum visitors!

NPBFX offers the latest release of analytics on XAU/USD for a better understanding of the current market situation and more efficient trading.

Current trend

Gold prices have declined for the second session in a row, retreating from record highs since the beginning of the year and testing 1900.00 for a breakdown.

Investors are fixing long positions in the instrument amid the publication of upbeat macroeconomic statistics from the US, as well as ahead of the release of the US labor market report for May on Friday. Additional pressure on the quotes was exerted by the yield of US Treasury bonds, which resumed growth. In turn, gold is still in high demand against the background of existing inflationary risks, which are almost completely ignored by the US Fed.

Today, investors expect the publication of the monthly economic review, Fed's Beige Book, which is likely to be able to further support the "bullish" sentiment in USD.

Support and resistance

Bollinger Bands in D1 chart show stable growth. The price range is narrowing actively, reflecting the emergence of ambiguous dynamics of trading in the short/ultra-short term. MACD reversed downwards having formed a new sell signal (located below the signal line). Stochastic is showing similar dynamics, retreating from its highs, indicating the overbought gold in the ultra-short term.

The development of a full-fledged downtrend is possible in the near future.

Resistance levels: 1916.36, 1935.00, 1952.53, 1966.25.
Support levels: 1900.00, 1882.10, 1863.34, 1850.00.

XAUUSD020621-33.png


XAUUSD020621-333.png


Trading tips

To open new short positions, one can rely on the breakdown of 1882.10. Take-profit – 1850.00. Stop-loss – 1900.00. Implementation time: 1-2 days.

A rebound from 1882.10 as from support followed by a breakout of 1900.00 may become a signal for new purchases with the target at 1935.00. Stop-loss – 1882.10.

Use more opportunities of the NPBFX analytical portal: trading signals for commodities

How can a trader determine if it’s worth buying or selling XAU/USD now or better waiting for a more favorable period? Use trading signals for commodities from the top 10 technical indicators on the NPBFX portal and make the right decisions! All registered users have free and unlimited access to the minutely updated trading signals (MA10, BBands, Ichimoku, Stochastic, ZigZag, etc.) for Gold, Silver, Brent and WTI Crude oil.

If you have any questions about trading instruments, you can always ask an analyst in the online chat on the portal and get a free consultation of an experienced specialist.

Use the current recommendations of analysts on XAU/USD and trade efficiently with NPBFX.
 
AUD/USD: AUD renews local lows 4.06.2021

Good afternoon, dear forum visitors!

NPBFX offers the latest release of analytics on AUD/USD for a better understanding of the current market situation and more efficient trading.

Current trend

AUD is trading flat against USD during the Asian session, consolidating near the local lows since April 14 after the active decline the day before.

USD strengthened significantly yesterday, responding to the emergence of positive macroeconomic statistics. Specifically, the ADP Employment Change Report reflected nearly 1M new job growth, which points to the rapid recovery of the US economy after the pandemic and gives hope for strong results from the final US labor market report for May, which will be released today.

Statistics from Australia provided insignificant support to the instrument on Friday. The volume of Home Loans in the country in April increased by 4.3% MoM after increasing by 3.3% MoM in March. At the same time, Investment Lending for Homes for the same period corrected from +12.7% MoM to +2.1% MoM.

Support and resistance

Bollinger Bands in D1 chart demonstrate a moderate decrease. The price range is expanding, but the quotes of the instrument are located below its borders. MACD is going down preserving a strong sell signal (located below the signal line). Stochastic is showing similar dynamics; however, the indicator line is rapidly approaching its lows, signaling growing risks associated with the oversold AUD in the ultra-short term.

Resistance levels: 0.7676, 0.7700, 0.7750, 0.7770.
Support levels: 0.7636, 0.7600, 0.7562, 0.7531.

AUDUSD040621-33.png


AUDUSD040621-333.png


Trading tips

The breakdown of 0.7636 may serve as a signal to new sales with the targets at 0.7562–0.7540. Stop-loss – 0.7676. Implementation time: 1-2 days.

To open long positions, one can rely on the rebound from the support level of 0.7636 with the subsequent breakout of 0.7676. Take-profit – 0.7750. Stop-loss – 0.7636.

Use more opportunities of the NPBFX analytical portal: glossary

Beginning traders certainly face a lot of specialized concepts and lexicon on FOREX, which are often not fully been understood. Swap, tick, hedge, margin calls are often unfamiliar to beginning traders. But the lack of knowledge of these fundamentals make a competent market vision impossible. So glossary on the NPBFX analytical portal could be an excellent helper in this case, which contains all the main definitions with explanations in a compact and accessible form. All concepts are arranged in alphabetical order, so that you can easily and quickly find and explore a new concept for yourself.

If you have any questions about trading instruments, you can always ask an analyst in the online chat on the portal and get a free consultation of an experienced specialist.

Use the current recommendations of analysts on AUD/USD and trade efficiently with NPBFX.
 
EUR/USD: euro is trying to recover 7.06.2021

Good afternoon, dear forum visitors!

NPBFX offers the latest release of analytics on EUR/USD for a better understanding of the current market situation and more efficient trading.

Current trend

EUR shows ambiguous trading dynamics against USD during the Asian session, consolidating near 1.2160 and maintaining the "bullish" momentum formed at the end of last week.

EUR, like many other instruments, managed to show growth last Friday, responding to the release of the US labor market report for May, which could not meet all the expectations of traders. It should be noted that the data can still be called strong, but investors fear that it is not enough to change the course of the US Fed's monetary policy. The American economy created 559K new jobs in May after 278K in April. Market forecasts assumed an increase of 650K. In turn, the Unemployment Rate fell more than expected, from 6.1% to 5.8%, which was not reflected in the dynamics of the instrument.

Today, investors are focused on statistics from Germany on the volume of factory orders for April.

Support and resistance

In the D1 chart, Bollinger Bands are reversing horizontally. The price range is slightly expanded from below, remaining spacious enough for the current activity level in the market. MACD is declining keeping a weak sell signal (located below the signal line). Stochastic shows similar dynamics, rapidly approaching its lows, which indicates risks associated with the oversold EUR in the ultra-short term.

Resistance levels: 1.2200, 1.2265, 1.2309, 1.2348.
Support levels: 1.2150, 1.2100, 1.2050, 1.2000.

EURUSD07062021-33.png


EURUSD07062021-333.png


Trading tips

To open long positions, one can rely on a confident breakout of 1.2200. Take-profit – 1.2309. Stop-loss – 1.2150. Implementation time: 2-3 days.

The return of "bearish" trend with the breakdown of 1.2150 may become a signal for new sales with the target at 1.2050. Stop-loss – 1.2200.

Use more opportunities of the NPBFX analytical portal: glossary

Beginning traders certainly face a lot of specialized concepts and lexicon on FOREX, which are often not fully been understood. Swap, tick, hedge, margin calls are often unfamiliar to beginning traders. But the lack of knowledge of these fundamentals make a competent market vision impossible. So glossary on the NPBFX analytical portal could be an excellent helper in this case, which contains all the main definitions with explanations in a compact and accessible form. All concepts are arranged in alphabetical order, so that you can easily and quickly find and explore a new concept for yourself.

If you have any questions about trading instruments, you can always ask an analyst in the online chat on the portal and get a free consultation of an experienced specialist.

Use the current recommendations of analysts on EUR/USD and trade efficiently with NPBFX.
 
Back
Top