Ayisha Rajasekhar
Private
- Messages
- 21
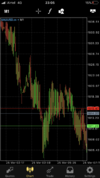
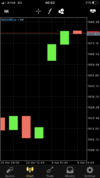
@OctaFX Rep Here I have attached 1 minute candle chart of morning section on 25 March 2020. (All Broker companies have same).Dear Ayisha Rajasekhar,
We apologise for the wait in providing our response, please understand that our team had to compare the data you've provided with our system data. To do it as thoroughly as possible, we had to take the necessary time.
We wish to include a disclaimer that the data we're about to add below is solely individual, which means that it does not reflect all possible cases of arbitrage, rather it refers to your case only.
First of all, we wish to include an explanation of how arbitrage can be detected. Followed by the distribution of your orders by duration and difference in ticks, as well as profit.
Fig.1: Detection of arbitrage trading
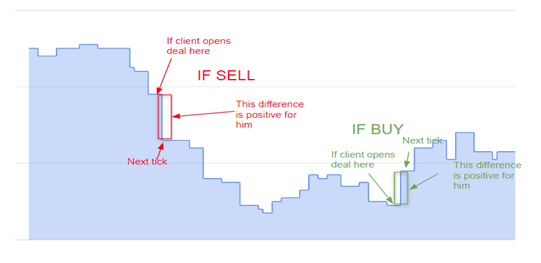
In respect to Fig.1: The client opens a Sell Order: If he knows that the next tick is much lower than the current one, he immediately opens an order. Thus, it directly receives a profit if the difference is higher than the spread. The client opens a Buy Order: If he knows that the next tick is much higher than the current one, he immediately opens an order. Thus, it directly receives a profit if the difference is higher than the spread.
Such a significant difference with a neighboring tick occurs very rarely. For example, dozens of price changes can happen in a few seconds, and only one of them will be larger than the spread. This is normal if the client sometimes opens orders on a strong market's move. But, when most of his orders take place on strong movements - this is a clear arbitrage. Since the client knows about the strong movement, before this movement, he opens a deal in the corresponding direction. An important feature of this strategy is the short duration of orders, the use of an expert adviser.
The report below will present specific examples of arbitrage trading in your case.
Fig.2: Distribution of orders by duration and difference (in points) with the next tick
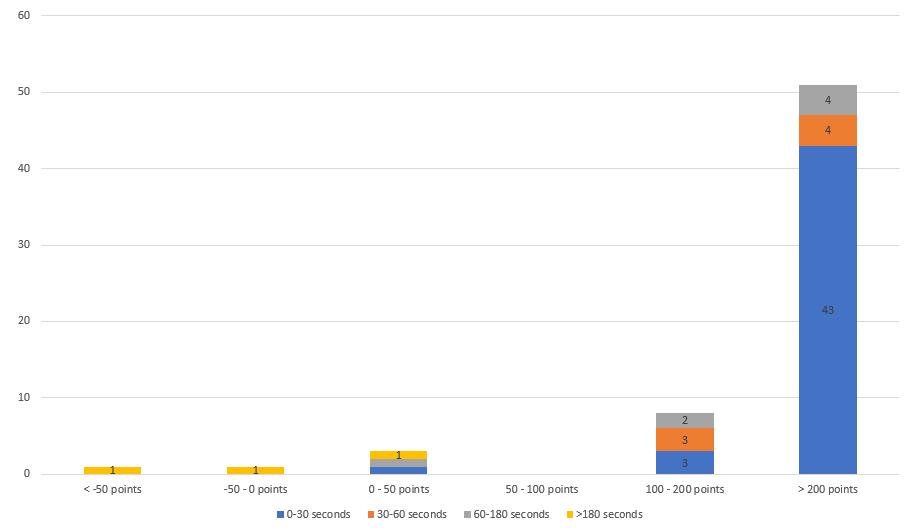
In respect to Fig.2: This chart shows us the distribution of your orders counted by time and the difference with the next tick at the opening. Please note, that if the difference is positive, it means that the tick client took was better for him by the number of points on the x-axis. The value of the bar = number of orders.
The chart shows that 51 orders out of 64 (80%) were opened on a tick when the difference between the opening tick and the next tick was more than 200 points in the client's direction. That means that in the case of Buy orders, the next tick after opening was more than 200 points higher, and in the case of Sell orders - 200 points lower.
The chart also shows that most trades opened before this price difference had a duration of up to 30 seconds. This low duration of orders is one of the key elements of arbitrage trading.
The probability of obtaining such a distribution of orders is less than 1% and is considered a purposeful implementation of arbitrage.
Fig. 3: Distribution of orders profit ($) by length and ticks difference (in points)
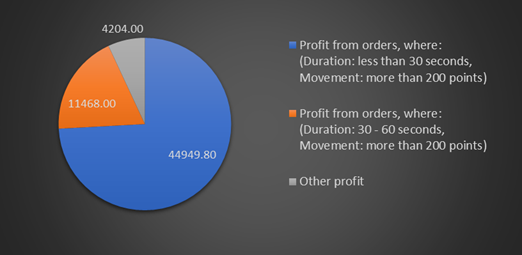
In respect to Fig.3: This graph shows that most of the profit from your trades was obtained with trades lasting less than one minute and with a difference of more than 200 points from the neighboring price.
Summarizing all of the above, our team provided the following conclusions regarding why was deemed you were using arbitrage:
In light of all the above, we wish to include a couple of examples:
- High frequency of short duration orders;
- High profit as a result of high-frequency orders (93% of the total profit);
- Opening orders only in the moments before strong movements and ignoring weaker market movements;
- Non-randomness of opening high-frequency orders on strong market movements (with a probability of more than 99%);
Ticket Position Open_Time Type Volume Symbol Open_Price S / L T / P Close_Time Close_Price Profit Duration (min) Difference with previous tick at the opening of order (in points) Difference with next tick at the closing of order (in points) 4021386 4021386 25.03.2020 7:56:14 buy 10 XAUUSD.m 1 610,81 0,00000 0,00000 25.03.2020 7:56:45 1616,21 5 400.00 0,517 290 38 4033299 4033299 25.03.2020 7:53:15 buy 10 XAUUSD.m 1610,78 0,00000 0,00000 25.03.2020 7:53:48 1616,02 5 240.00 0,550 202 379 4033307 4033307 25.03.2020 7:55:07 buy 10 XAUUSD.m 1610,96 0,00000 0,00000 25.03.2020 7:55:24 1615,96 5 000.00 0,283 217 379 4021385 4021385 25.03.2020 7:51:27 buy 10 XAUUSD.m 1610,35 0,00000 0,00000 25.03.2020 7:51:52 1615,16 4 810.00 0,417 241 375 4032479 4032479 25.03.2020 7:02:41 buy 10 XAUUSD.m 1610,03 0,00000 1 614.00 25.03.2020 7:02:45 1614,68 4 650.00 0,067 337 238 4032483 4032483 25.03.2020 7:12:35 sell 10 XAUUSD.m 1615,15 0,00000 0,00000 25.03.2020 7:12:40 1611,850 3 300.00 0,083 460 2 4032713 4032713 25.03.2020 7:59:34 buy 10 XAUUSD.m 1609,75 0,00000 0,00000 25.03.2020 8:01:07 1612,82 3 070.00 1,550 265 6 4032754 4032754 25.03.2020 7:14:57 buy 10 XAUUSD.m 1608,89 0,00000 0,00000 25.03.2020 7:17:22 1611,62 2 730.00 2,417 233 317 4033265 4033265 25.03.2020 7:19:18 sell 10 XAUUSD.m 1611,49 0,00000 0,00000 25.03.2020 7:19:30 1608,89 2 600.00 0,200 409 19 4033271 4033271 25.03.2020 6:54:25 buy 10 XAUUSD.m 1610,94 0,00000 1 613.60 25.03.2020 6:54:31 1613,35 2 410.00 0,100 361
361
Please, let us know should any assistance be necessary.
Kind regards,
OctaFX Rep.
you don’t want to your client makes profit, that’swhy you locked your candle chat on 24 March 2020 and also locked between 26 March 2020 to 9 April 2020
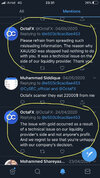
can you agree your XAUUSD candle chat locked for that 2 weeks because of my profit? Here also attached your Twitter reply screenshot regarding this matter.
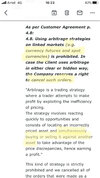
you opened market to client for trade is right thing... but, trader made profit is arbitrage? What is your explanation?
@FPA Forums Team @4evermaat please guide me for further!