Only Elliot Wave Analysis - SolidECN

USDCAD - Growth in possible.

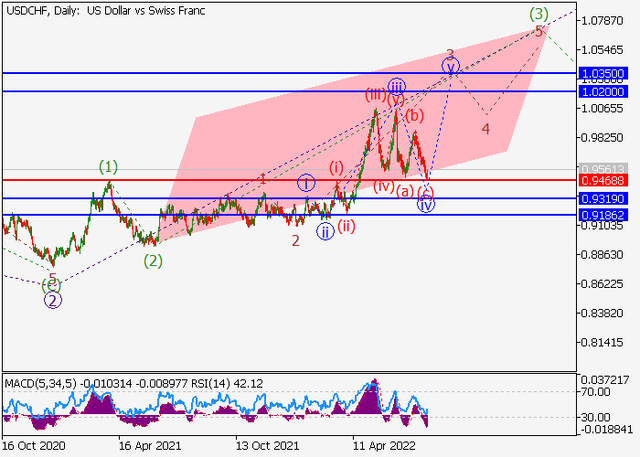
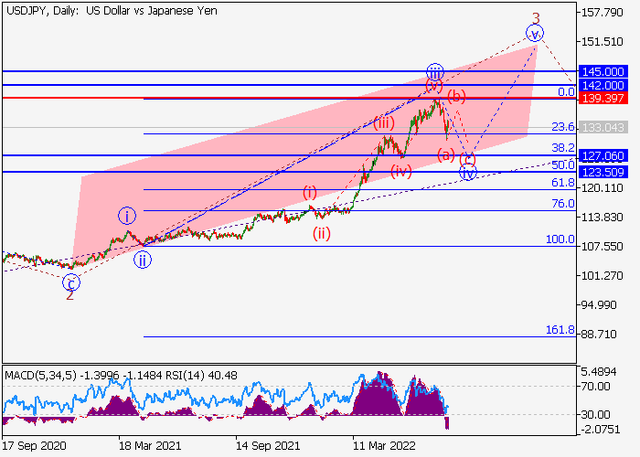
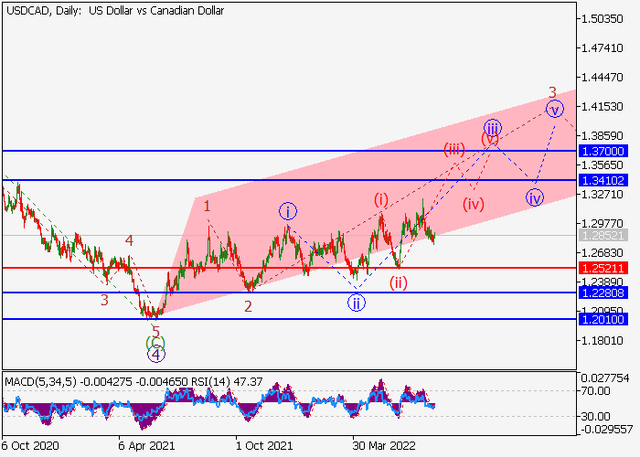
On the daily chart, the first wave of the higher level (1) of 5 forms, within which the wave 3 of (1) develops. Now, the third wave of the lower level iii of 3 is developing, within which the wave (iii) of iii is forming.

If the assumption is correct, the USDCAD pair will grow to the levels of 1.341 – 1.37. In this scenario, critical stop loss level is 1.2521.

usdcad.png
 
USDCHF - Growth in possible.

On the daily chart, the third wave of the higher level 3 of (3) develops, within which the wave iii of 3 formed. Now, a correction has ended as the fourth wave iv of 3, within which the wave (c) of iv has developed, and the development of the fifth wave v of 3 is starting.

If the assumption is correct, the USDCHF pair will grow to the levels of 1.02 – 1.035. In this scenario, critical stop loss level is 0.9468.

usdchf.png
 

AUDUSD - A fall is possible​

On the daily chart, the first wave of the higher level (1) of C developed, and a downward correction forms as the wave (2) of C, within which the wave C of (2) forms. Now, the third wave of the lower level iii of C has formed, and a local correction has ended as the fourth wave iv of C.

If the assumption is correct, the AUDUSD pair will fall within the wave v of C to the levels of 0.66 – 0.645. In this scenario, critical stop loss level is 0.7044.

audusd.png
 
NZDUSD - A fall is possible.

On the daily chart, the upward wave of the higher level (А) of B formed, and a downward correction develops as the wave (B) of B, within which the wave C of (B) forms. Now, the fifth wave v of C has appeared, within which the wave (iii) of v has ended, a local correction has ended as the wave (iv) of v, and the wave (v) of v has started.

If the assumption is correct, the NZDUSD pair will fall to the levels of 0.591 – 0.58. In this scenario, critical stop loss level is 0.6352.

nzdusd.png
 
Alibaba - Growth is possible.

On the daily chart, the upward first wave of the higher level 1 formed, a downward correction developed as the wave 2, and the formation of third wave 3 started. Now, the first wave of the lower level 1 of (1) of 3 is developing, within which the wave iii of 1 has formed, and the correctional wave iv of 1 has ended.

If the assumption is correct, the asset will grow to the levels of 138.87 – 160.9. In this scenario, critical stop loss level is 80.35.

baba.png
 
USDJPY - The pair is in a correction, a fall is possible.

On the daily chart, the first wave of the higher level (1) develops, within which the wave 3 of (1) forms. Now, the third wave of the lower level iii of 3 has ended, and a downward correction is forming as the fourth wave iv of 3, within which the wave (a) of iv has formed.

If the assumption is correct, after the correction (b) of iv the USDJPY pair will fall to the levels of 127.06–123.5. In this scenario, critical stop loss level is 139.39.

usdjpy.png
 
EURUSD - Growth is possible.

On the daily chart, a downward correction of the higher level developed as the wave (B), within which the wave C of (B) formed, and the upward wave (C) started. Now, the entry first wave of the lower level (i) of i of 1 of (C) is forming, within which the wave iii of (i) is forming.

If the assumption is correct, the EURUSD pair will grow to the levels of 1.0612 – 1.0787. In this scenario, critical stop loss level is 1.0082.

eurusd.png
 
XAGUSD - Growth is possible.

On the daily chart, a downward correction of the higher level formed as the second wave (2), within which the wave C of (2) formed. Now, the third wave (3) has formed, within which the first entry wave of the lower level (i) of i of 1 of (3) is developing.

If the assumption is correct, the XAGUSD pair will grow to the levels of 22.47–25.4. In this scenario, critical stop loss level is 18.27.

silver.png
 

Silver - Growth is possible.​

On the daily chart, a downward correction of the higher level ended as the second wave (2), within which the wave C of (2) formed, and the third wave (3) started. Now, the first entry wave of the lower level i of 1 of (3) is forming, within which the wave (i) of I is developing.

If the assumption is correct, the XAGUSD pair will grow to the area of 22.47 – 25.4. In this scenario, critical stop loss level is 19.5.

silver.png
 
GBPUSD - Growth is possible

On the daily chart, the first wave of the higher level (1) formed, a downward correction ended as the second wave (2), and the third upward the wave (3) started. Now, the first entry wave of the lower level (i) of i of 1 of (3) has started, and a local correction is developing as the second wave (ii) of i.

If the assumption is correct, after the end of the correction, the GBPUSD pair will grow to the area of 1.239 – 1.2674. In this scenario, critical stop loss level is 1.176.

gbpusd.png
 
Back
Top