Only Elliot Wave Analysis - SolidECN

USDCHF - The pair is in a correction and may grow.

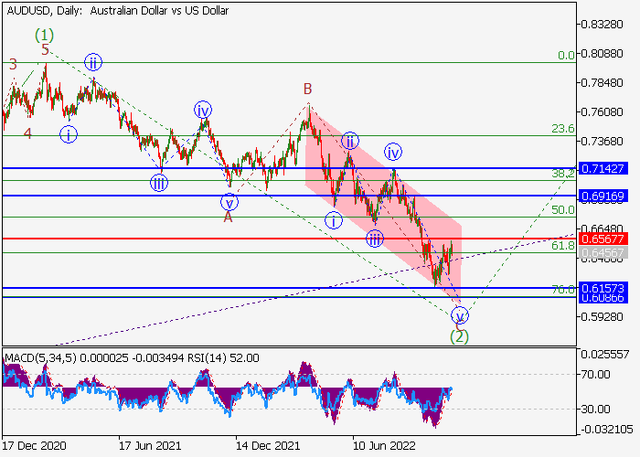
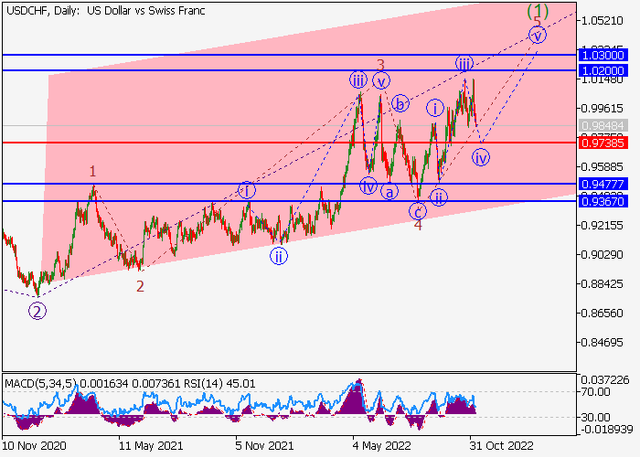
On the daily chart, the upward first wave of the higher level (1) of 3 forms, within which the wave 5 of (1) develops. Now, the third wave of the lower level iii of 5 has formed, a local correction is developing as the fourth wave iv of 5, within which the wave (c) of iv is ending.

If the assumption is correct, after the end of the correction, the USDCHF pair will grow to the area of 1.02 – 1.03. In this scenario, critical stop loss level is 0.9738.

usdchf.png
 
AUDUSD - A fall is possible.

On the daily chart, the first wave of the higher level (1) ended, and a downward correction develops as the second wave (2), within which the wave C of (2) develops. Now, the fifth wave of the lower level v of C is forming, the wave (iii) of v has formed, and a local correction has ended as the wave (iv) of v.

If the assumption is correct, the AUDUSD pair will fall within the wave (v) of v to the area of 0.6157–0.6086. In this scenario, critical stop loss level is 0.6567.

audusd.png
 

EURUSD - Growth is possible.​

On the daily chart, the downward wave of the higher level А ended, within which the fifth wave (5) of А formed, and the development of the upward wave B started. Now, the first entry wave 1 of (1) of B i developing, and the third wave of the lower level iii of 1 is forming.

If the assumption is correct, the EURUSD pair will grow to the area of 1.0790–1.1196. In this scenario, critical stop loss level is 0.9932.

eurusd.png
 

USDJPY - The price is in a correction, a fall is possible.​

On the daily chart, the third wave of the higher level 3 ended, and a downward correction forms as the fourth wave 4. Now, the wave of the lower level a of 4 has formed, and a local correction is starting to form as the wave b of 4.

If the assumption is correct, the USDJPY pair will fall to the area of 133.2 – 127.36. In this scenario, critical stop loss level is 146.67.

usdjpy.png
 

AUDUSD - Growth is possible.​

On the daily chart, the first wave of the higher level (1) formed, and a downward correction ended as the second wave (2), within which the wave C of (2) formed. Now, the development of the third wave (3) has started, and the first entry wave of the lower level i of 1 of (3) is forming.

If the assumption is correct, the AUDUSD pair will grow to the area of 0.6916 – 0.7142. In this scenario, critical stop loss level is 0.6393.

audusd.png
 
USDCAD - The price is in a correction and may grow.

On the daily chart, the upward fifth wave of the higher level 5 develops, within which the wave (1) of 5 formed, the correctional wave (2) of 5 ended, and the wave (3) of 5 develops. Now, the third wave of the lower level 3 of (3) has formed, a correction has ended as the fourth wave 4 of (3), and the wave c of 4 has formed.

The upward dynamics of the USDCAD pair to the area of 1.43 – 1.45 are expected. In this scenario, critical stop loss level is 1.3206.

usdcad.png
 
XAUUSD - Growth is possible.

On the daily chart, a downward correction formed as the fourth wave of the higher level (4), within which the wave C of (4) formed as a momentum, and the development of the fifth wave (5) started. Now, the first entry wave of the lower level 1 of (5) is developing, within which the wave iii of 1 has formed.

If the assumption is correct, after the end of the correction iv of 1, the XAUUSD pair will grow to the area of 1808.08–1881.56. In this scenario, critical stop loss level is 1700.25.

gold.png
 
Crude Oil - A fall is possible.

On the daily chart, a downward correction forms as the second wave of the higher level 2, within which the wave c of 2 develops. Now, the third wave of the lower level (iii) of c has formed, a local correction has ended as the fourth wave (iv) c and the development of the fifth wave (v) of c has started.

If the assumption is correct, the price of the asset will fall to the area of 77.50 – 62.55. In this scenario, critical stop loss level is 100.87.

oil.png
 
Crude Oil - A fall is possible.

On the daily chart, the first wave of the higher level (1) formed, and a downward correction develops as the second wave (2), within which the wave А of (2) forms. Now, the fifth wave of the lower level v of A is forming, within which the wave (iii) of v is developing.

If the assumption is correct, the price of the asset will fall to the area of 67 – 52.25. In this scenario, critical stop loss level is 90.30.

oil.png
 
EURUSD - Growth is possible.

On the daily chart, the downward wave of the higher level А ended, within which the fifth wave (5) of А formed, and the development of the upward wave B started. Now, the first entry wave 1 of (1) of B is developing, and the third wave of the lower level iii of 1 is forming.

If the assumption is correct, the EURUSD pair will grow to the area of 1.0790 – 1.1196. In this scenario, critical stop loss level is 1.0092.

eurusd.png
 
Back
Top