SOLID ECN LLC
Solid ECN Representative
- Messages
- 511
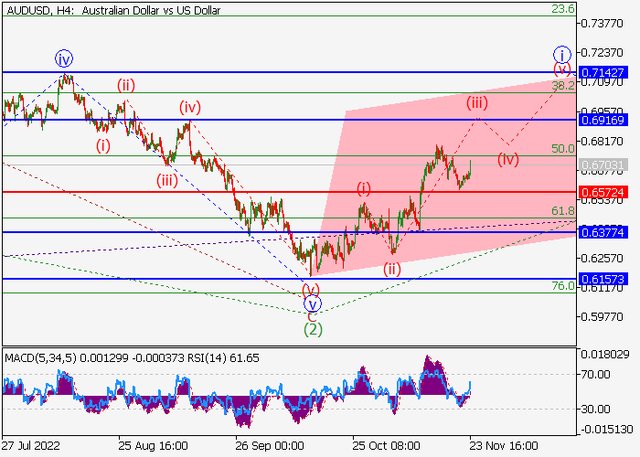
AUDUSD - Growth is possible.
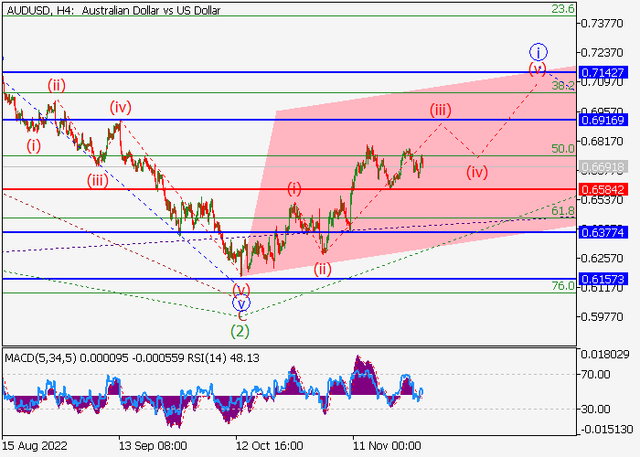
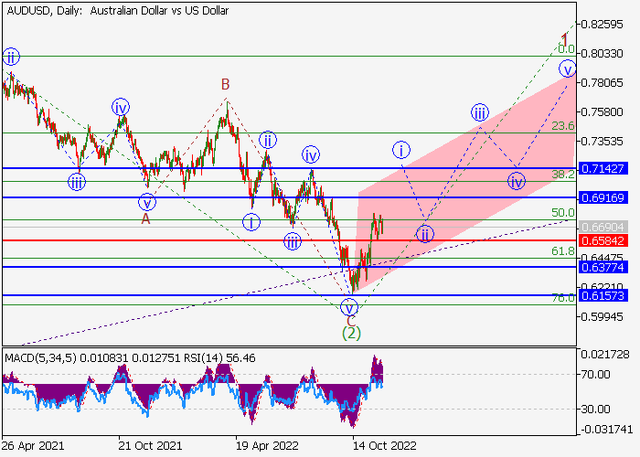
On the daily chart, the first wave of the higher level (1) formed, a downward correction ended as the second wave (2), and the development of the third wave (3) started. Now, the first entry wave of the lower level i of 1 of (3) is forming, within which the wave (iii) of i is developing.
If the assumption is correct, the AUDUSD pair will grow to the area of 0.6916 – 0.7142. In this scenario, critical stop loss level is 0.6572.