Only Elliot Wave Analysis - SolidECN

USDCAD - Growth is possible.
USDCAD Daily.JPG
USDCAD H4.JPG
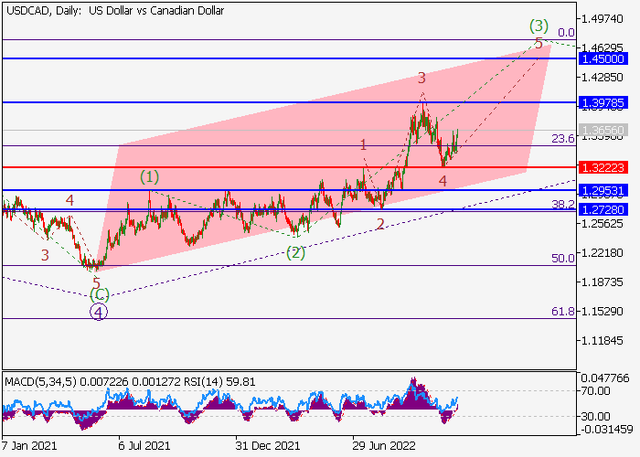
In my point of view, USDCAD - fall is possible in H4 time frame.
H4 is in a triangle, structure 3-3-3-3, and fall down to complete the last 3 structure.

PS: But I am concern about what kind of triangle should be: Contracting triangle or Ending diagonal triangle ? Both have contradictions.
 
Crude Oil - A fall is possible.

On the daily chart, a downward correction forms as the second wave of the higher level 2, within which the wave c of 2 develops. Now, the development of the fifth wave (v) of c has started, the wave i of (v) is developing, and the local correction is forming as the wave ii of (v).

If the assumption is correct, the price of the asset will fall to the area of 72.50 – 62.55. In this scenario, critical stop loss level is 100.87.

oil.png
 
Silver - Growth is possible.

On the daily chart, a downward correction of the higher level ended as the second wave (2) and the third wave (3) forms, within which the first entry wave of the lower level 1 of (3) develops. Now, the wave iii of 1 is developing, and the wave (v) of iii is forming.

If the assumption is correct, the XAGUSD pair will grow to the area of 24 – 25. In this scenario, critical stop loss level is 22.26.

silver.png
 
Crude Oil - A fall is possible.

On the daily chart, the first wave of the higher level (1) formed, and a downward correction develops as the second wave (2), within which the wave А of (2) forms. Now, the fifth wave of the lower level v of A is developing, within which the wave (iii) of v has formed, a local correction has ended as the wave (iv) of v, and the wave (v) of v is developing.

If the assumption is correct, the price of the asset will fall to the area of 67 – 52.25. In this scenario, critical stop loss level is 83.58.

oil.png
 
EURUSD - Growth is possible.

On the daily chart, the downward wave of the higher level А ended, within which the fifth wave (5) of А formed, and the development of the upward wave B started. Now, the first entry wave 1 of (А) of B is developing, within which the third wave of the lower level iii of 1 is forming.

If the assumption is correct, the EURUSD pair will grow to the area of 1.0790 – 1.1196. In this scenario, critical stop loss level is 1.0280.

eurusd.png
 
GBPUSD - Growth is possible.

On the daily chart, the downward fifth wave of the higher level 5 of (V) ended, within which the wave (5) of 5 formed, and the development of the upward first wave (1) started. Now, the third wave of the lower level 3 of (1) is developing, within which the wave iii of 3 is ending.

If the assumption is correct, after the end of the local correction iv of 3, the GBPUSD pair will grow to the area of 1.259 – 1.29. In this scenario, critical stop loss level is 1.1899.

gbpusd.png
 
USDCAD - Growth is possible.

On the daily chart, the upward fifth wave of the higher level 5 and the wave (3) of 5 develop. Now, the third wave of the lower level 3 of (3) has formed, a local correction has ended as the fourth wave 4 of (3), and the formation of the wave 5 of (5) has started, within which the wave i of 5 is developing.

If the assumption is correct, the USDCAD pair will grow to the area of 1.3978 – 1.45. In this scenario, critical stop loss level is 1.3222.

usdcad.png
 
USDCHF - The price is in a correction and may grow.

On the daily chart, the upward first wave of the higher level (1) of 3 ended, and a downward correction ends as the second wave (2) of 3. Now, the formation of the wave C of (2) is ending.

If the assumption is correct, the USDCHF pair will grow to the area of 0.9900 – 1.0151. In this scenario, critical stop loss level is 0.9307.

usdchf.png
 
AUDUSD - Growth is possible.

On the daily chart, the first wave of the higher level (1) formed, a downward correction ended as the second wave (2), and the third wave (3) develops, within which the first entry wave of the lower level i of 1 of (3) forms. Now, the wave (iii) of i and the wave v of (iii) are developing.

If the assumption is correct, the AUDUSD pair will grow to the area of 0.6916 – 0.7142. In this scenario, critical stop loss level is 0.6584.

audusd.png
 
NZDUSD - Growth is possible.

On the daily chart, the upward wave of the higher level (А) formed, a downward correction ended as the wave (B), and the wave (C) develops. Now, the first entry wave of the lower level i of 1 of (C) is forming, within which the wave (iii) of i has formed, and a local correction is developing as the wave (iv) of i.

If the assumption is correct, the NZDUSD pair will grow to the area of 0.6500 – 0.6600. In this scenario, critical stop loss level is 0.6149.

nzdusd.png
 
Back
Top