SwingTrader1
Recruit
- Messages
- 16
Overbought Oversold
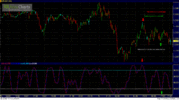
Im going to zip through this. I dont want to do it, but Im having trouble downloading a chart to demonstrate. Any way here it goes
The Technical indicator I use to identify OB/OS conditions is slow stochastics. This happens to be my primary indicator. Keep in mind its not the only one.
Parts;
The slow stochastics has 3 components
1) upper limit line settings onthis are typically 70 to 80
2) lower limit line settings on his are typically 20 to 30
3) k_period and d_period similar to moving averages.
Use;
Selling
The way I use slow stochastics is like this. When I see that the k_period and d_period have penetrated the upper limit line from below to above. I start looking to sell, but not immediately. I like to see the k_period and d_period do a 180 then penetrate the upper limit line from above to below. Then I like to find an entry in the market.
Buying
When I see the k_period and d_period penetrate the lower limit line from above to below I start looking to buy, not right away. I wait for the k_period and d_period turn around and penetrate the lower limit line form below to above. Then I seek an entry point.
