Point and Figure for Forex. Any pair.Charts.

Market Commentary Dollar Index is just nearing resistance zone of 78.75-79.30 ranges though double dip depression in the US is still glooming resulting in most of the asset classes trading softer especially the equities, the dollar index may go sideways.
m11sep271.png

CLICK HERE for detail information...
~~~>mdunleavy.byethost7.com/11Sep20.html
^^^ OR vvv
~~~>img842.imageshack.us/img842/5364/11sep27.pdf
^^^ OR vvv
~~~>iticsoftware.com/postimages2//201009/11Sep20.html
^^^ OR vvv
A t t a c h m e n t
 

Attachments

  • 11Sep27.zip
    7.9 KB · Views: 0
Moreover, Kiwi advanced as stock gains boosted demand for risky assets and also growth linked currencies like kiwi, along with the cheerful data from the Chinese economy, where China’ industrial production continued to accelerate, adding that New Zealand products will increase this period because the Chinese market is the largest market for New Zealand goods....(By fxempire)
m11oct08.png

~~~>mdunleavy.byethost7.com/11Oct02.html
^^^ OR vvv
~~~>iticsoftware.com/postimages2//201009/11Oct02.html
^^^ OR vvv
~~~>img695.imageshack.us/img695/2585/11oct08.pdf
^^^ OR vvv
A t t a c h m e n t
 

Attachments

  • 11Oct02.zip
    7 KB · Views: 0
I am neutral on USD/JPY.
While the pair finally closed above 77 and has room for gains in the long run, it is hard to see the pair making a serious move right now. The high level of optimism probably won’t be repeated right now.[forexcrunch]

m11oct17.png


~~~>iticsoftware.com/postimages2//201009/11Oct17.html
^^^ OR vvv
~~~>mdunleavy.byethost7.com/11Oct17.html
^^^ OR vvv
~~~>img696.imageshack.us/img696/6067/11oct18.pdf
^^^ OR vvv
A t t a c h m e n t
 

Attachments

  • 11Oct17.zip
    5.3 KB · Views: 0
The Canadian dollar made more gains against the US dollar and crossed the line of parity. GDP and employment data are the major events this week. Here’s an outlook for the Canadian events and an updated technical analysis for USD/CAD.[forexcrunch]
tb11oct30.png

CLICK HERE for detail information...
~~~>iticsoftware.com/postimages2//201009/11Oct25.html
^^^ OR vvv
~~~>img27.imageshack.us/img27/3191/11oct30.pdf
^^^ OR vvv
~~~>mdunleavy.byethost7.com/11Oct25.html
^^^ OR vvv
A t t a c h m e n t
Code:
https://docs.google.com/open?id=0BxxKzvQ2GlM8YWVkMDYwMjQtMmQ0Ny00OWZmLWEyYmMtNTk4MDc3NDExZmM0
 
USD/CAD bounced this past week as traders sold off a lot of risk-related assets globally. The pair finished strongly above the parity level, and as such has us thinking long at this point. However, the 1.03 area will be resistive, and as such we are waiting for a close above it in order to buy. The selling of this pair can be done if we break the lows of this past week’s candle. Until then, we think this market goes sideways.[by fxempire]
tb11nov06.png

~~~>iticsoftware.com/postimages2//201009/11Oct25.html
^^^ OR vvv
~~~>img249.imageshack.us/img249/4943/11nov06.pdf
^^^ OR vvv
~~~>mdunleavy.byethost7.com/11Oct25.html
^^^ OR vvv
A t t a c h m e n t
Code:
https://docs.google.com/leaf?id=0BxxKzvQ2GlM8NzIwOWUyMGYtMDczZi00NDNkLWJlYTMtNmZmZGRlYmM5MTQ3&sort=name&layout=list&num=50
 
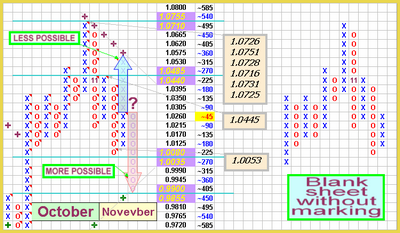
*FXstreet.com (California) - AUD/USD opened the Asian morning at 1.0342 and has since broken below the 1.0300 zone. From a technical standpoint, Valeria Bednarik, Chief Analyst at FXstreet.com finds that bigger time frames support a bullish outlook for this Monday, as long as above 1.0270.
*At time of writing, AUD/USD is quoted in the 1.0290 zone, around 10 pips above Friday's closing price. If the pair continues its decline in the session ahead, support levels lie at 1.0270, 1.0230 and 1.0180. To the upside, resistance levels lie at 1.0360, 1.0400 and 1.0440.
11Nov14.png

CLICK HERE for detail information...
~~~>mdunleavy.byethost7.com/11Nov13.html
^^^ OR vvv
~~~>iticsoftware.com/postimages2//201009/11Nov13.html
^^^ OR vvv
A t t a c h m e n t
Code:
PDF~~~||>>https://docs.google.com/leaf?id=0BxxKzvQ2GlM8YzEyYWE0ZDUtZjI5My00MjA3LWJkOGItYzIyZjg0NjFhMmJj&sort=name&layout=list&num=50<<||HTML~~||>>https://docs.google.com/leaf?id=0BxxKzvQ2GlM8MmNiN2VmMTgtMzYyNC00ZWY3LTg2Y2UtOTJmOGViOGEyNzg1&sort=name&layout=list&num=50<<||
 
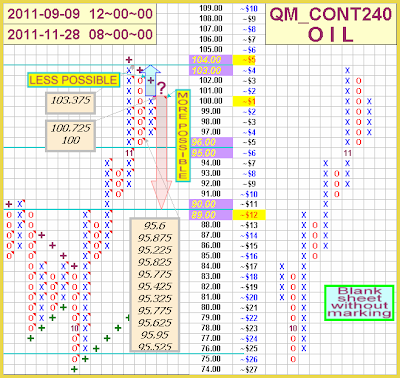
*Our overall outlook for crude oil prices is bearish, as the outlook for global growth is worsening due to mounting concerns from Europe and the fact that major economies around the globe are still weak, and that should put negative pressure on crude oil prices.
*Traders will be awaiting the infamous jobs report from the United States on Friday, and a strong figure could boost optimism and push crude oil prices higher. [Topcommodities Net]
11Nov29.png

Learn more :
~~~>mdunleavy.byethost7.com/11Nov26.html
^^^ORvvv
~~~>iticsoftware.com/postimages2//201009/11Nov26.html
^^^ORvvv
Code:
https://docs.google.com/leaf?id=0BxxKzvQ2GlM8MjZhMjY4ZjAtZTA3Yi00MTZmLWJhZTQtN2ExODI3NGUxYzQz&sort=name&layout=list&num=50
A t t a c h m e n t (1)^^^ORvvv(2)
Code:
https://docs.google.com/leaf?id=0BxxKzvQ2GlM8NDBiYzkzOTQtNDc0MS00ZGViLWEyYjMtMzc5MjZiZGIwNDQ5&sort=name&layout=list&num=50
 
CL had a positive day for the Friday session as traders continue to buy commodities in general. The market looks like it wants to attempt a breakout above the recent highs of $103 and if it does – this could be the beginning of the next massive leg up in the market. However, we expect the area to actually be more resistance than the market is ready to go up against at the moment. We are buyers, but will need to see a pullback first.
[meta4forexbroker]
1.png

Code:
https://docs.google.com/document/pub?id=1k-LK7SJO6d2Ep1R9z2ln5_GA5rSGeqp6dp2xIgiZ-1c#id.6dku2saylq6t
 
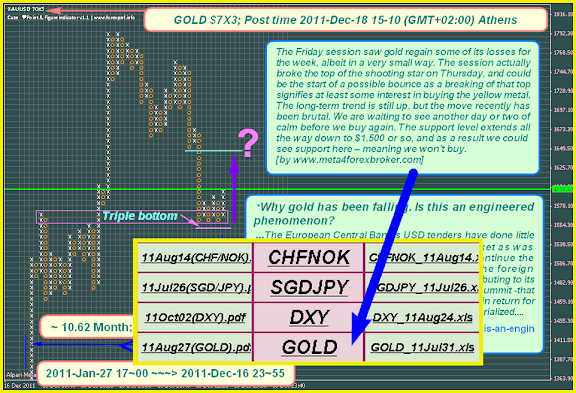
...In the bigger picture, there is still no clear sign of long term trend reversal yet and price actions from 1923.7 would still be finally unfolded as correction/consolidation only. Though, the consolidation pattern would likely extend below 1923.7 for a while and rally attempt should face strong resistance near to this level. We'd anticipate another falling leg before such consolidation completes. And in such case, downside should be contained by 1478.3/1577.4 support zone...[by oilngold]
1.PNG


Learn more :
~~~>iticsoftware.com/postimages2//201009/11Dec10.html
^^^ORvvv
~~~>img690.imageshack.us/img690/4721/11dec10.pdf
A t t a c h m e n t:
Code:
https://docs.google.com/document/pub?id=1Y5rnn301l8-O_xROiUY15UzqwhHoCWipS6mND6YTepY#id.x7mxdqofo4yv
 
Commentary of the XAU/USD (Gold) pair:
The pair XAU/USD just made a pullback on 1600 points as resistance.
The pair continues to move into its long term bullish channel.
All indicators stay globaly bearish.
We maintain to trade only short positions as far as 1625 is resistance.
The breakout of 1550 will give a new sell signal and open the way towards 1500 points.
In case of return above 1625, we will wait the breakout of 1650 points to advise long positions.[by forex-tribe]
03.png

Learn more:
Code:
https://docs.google.com/document/pub?id=1Y5rnn301l8-O_xROiUY15UzqwhHoCWipS6mND6YTepY
Code:
https://docs.google.com/leaf?id=0AhxKzvQ2GlM8dDBqYWl6XzlEbFZDWFVob0FMbG9nbGc&sort=name&layout=list&num=50
 
Back
Top