Precious Metals updates by Solid ECN

SOLID ECN LLC

Solid ECN Representative
Messages
511
XAUUSD, flat dynamics in the short term

Gold prices are consolidating during the Asian session, holding near 1920. The day before, the instrument showed a rather active decline, which was caused by another increase in the attractiveness of the US currency for investors. The US dollar is strengthening amid expectations of further tightening of monetary policy by the US Federal Reserve, which may raise the rate by 50 basis points at once during the May meeting. In addition, the demand for the US currency is growing due to an increase in the yield of treasury bonds: for 10-year securities it rose above 2.55% for the first time since May 2019. Return of asset quotes above 1950 will provide stronger support for gold, which may then rush to last week's highs around 1966.

In turn, the demand for gold as a safe-haven asset remains quite high amid the escalation of the conflict in Ukraine. Traders are disappointed in the negotiation process and no longer expect that the parties will be able to reach a peace agreement in the near future.

It is also worth noting that the London Bullion Market Association (LBMA) and the World Gold Council (WGC) intend to create a blockchain-based database that will allow tracking the origin and movement of gold bars around the world. The initiative is aimed at preventing trading in illegally mined metal. At the moment, the market is recording an increase in the number of bars with counterfeit stamps with logos of large manufacturing enterprises.

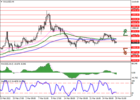
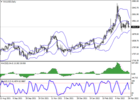
Bollinger Bands in D1 chart demonstrate a stable decrease. The price range is narrowing, reflecting the emergence of ambiguous dynamics of trading in the short/ultra-short term. MACD is going down, keeping a fairly stable sell signal. Stochastic, having retreated from its highs, shows an active downtrend, signaling in favor of the further development of "bearish" trend in the ultra-short term.

Resistance levels
: 1930, 1952, 1974.2, 2000.
Support levels: 1900, 1877, 1860, 1840.​

gold_1.pnggold_2.png
 
Silver prices remain under pressure

During the Asian session, silver quotes are growing slightly, trying to recover from a sharp decline at the beginning of the week, which led to a short-term update of local lows since February 25. Yesterday, the XAGUSD pair showed a particularly strong decline, reacting to statements by members of the delegations of the negotiation process between Russia and Ukraine about achieving a "breakthrough" in discussions of the non-bloc status. At the same time, the most painful issues of the disputed territories remain open. According to the Ukrainian delegation, the discussion of the territories of the Donetsk and Luhansk People's Republics should take place at heads of state, but so far, there are no prerequisites for a meeting between Vladimir Putin and Vladimir Zelensky.

Meanwhile, the demand for silver and gold as shelter assets remains quite high. According to analysts, global demand for silver has continued to grow steadily in recent years, and in 2022 it could reach a record level, catching up with such leaders as gold, palladium, or platinum. Analysts from the Silver Institute expect demand for the precious metal to increase by 8% for the year to a record of 1.112B ounces. On the other hand, silver is primarily an industrial material, and much will depend on the state of the global economy, which is now recovering but showing worrisome inflationary risks.

On the daily chart, Bollinger Bands are steadily declining. The price range is narrowing, reflecting the emergence of ambiguous trading dynamics in the short term. The MACD indicator is going down, keeping a strong sell signal (the histogram is below the signal line). Stochastic is also dominated by "bears," approximately in the center of its working area. The current readings of the indicator signal in favor of the development of a corrective decline in the short and/or ultra-short term.
Resistance levels: 25, 25.35, 25.58, 26 | Support levels: 24.67, 24.42, 24, 23.6

silver.png
 
Gold, Fibonacci levels analysis


Daily overview
On the daily chart, the price continues to test 1921 (correction 50.0%), and the consolidation below it allows a decline to 1890 (correction 61.8%), 1850 (the area of January highs). However, an ascending fan may prevent negative dynamics. The key "bullish" level is 1951 (correction 38.2%), supported by the middle line of Bollinger bands. Its breakout will give the prospect of further growth to 1990 (correction 23.6%), 2050 (correction 0.0%).

Technical indicators do not give a single signal: Bollinger bands are horizontal, Stochastic reverses upwards, but the MACD histogram decreases in the negative zone.
gold-1.png


Weekly overview
On the weekly chart, the price tested 2033 (correction 0.0%) but is now correcting downwards. A break of 1890 (38.2% ascending fan line) further declines to 1835 (23.6% correction, middle line of Bollinger Bands). Otherwise, the quotes will be able to return to 1990 (upper line of Bollinger bands), 2033.
Technical indicators do not give a single signal: Bollinger bands are directed upwards, Stochastic is directed downwards, and the MACD histogram increases in the positive zone.
gold-2.png


Resistance levels: 1951, 1990, 2050 | Support levels: 1921, 1890, 1835​
 
Gold, the pair may grow


On the daily chart, the third wave of the higher level 3 of (5) develops, within which the wave iii of 3 forms. Now, the third wave of the lower level (iii) of iii is developing, within which the wave iii of (iii) has formed, the correctional wave iv of (iii) has ended, and the development of the wave v of (iii) is starting.

If the assumption is correct, Gold will grow to the levels of $2150 - $2200. In this scenario, critical stop loss level is $1890.

gold.png
 
Gold, rising US Treasury yields are pushing the instrument lower

Gold prices are developing "bearish" dynamics, testing the level of 1920.00 for a breakdown. XAU/USD builds on the downward momentum that was formed at the end of last week, when the US currency received support after the publication of a strong report on US Non-Farm Payrolls and an increase in Treasury yields amid market expectations of a tightening of the US Federal Reserve policy, which could become a catalyst for raising interest rates soon.

As expected, the economy created a little less than 500K new jobs, but at the same time showed a steady increase in Average Hourly Earnings and a drop in the Unemployment Rate from 3.8% to 3.6% (forecasts suggested a decrease to only 3.7%). Strong data confirmed the likelihood that the US regulator will decide to raise interest rates during its May meeting by 50 basis points at once. At the same time, markets are also reacting with a noticeable increase in the yield of US Treasury bonds: on 10-year securities, it rose to 2.414% on Monday morning after closing at 2.375% at the end of last week.

In turn, gold is still supported by the tense situation around Ukraine. The positive impetus received from the results of the next round of talks between the Ukrainian and Russian delegations in Turkey at the beginning of last week seems to have leveled off after the appearance of new evidence of the aggravation of the situation in certain territories of Ukraine and, in particular, in the Bucha district. Meanwhile, Western countries have announced their readiness to impose new sanctions against the Russian Federation, which threatens to further complicate the situation with rising energy prices. Against this backdrop, gold quotes will continue their uptrend, as investors will redirect their capital to safe-haven assets in order to minimize risks.
gold-1.png


Support and resistance
Bollinger Bands in D1 chart demonstrate flat dynamics. The price range is slightly narrowing from above, reflecting ambiguous dynamics of trading in the short term. MACD is declining keeping a weak sell signal (located below the signal line). Stochastic, after a short rise at the beginning of the last trading week, is again reversing into a horizontal plane. It is necessary to wait for the trade signals from technical indicators to become clear.

Resistance levels: 1930, 1952, 1974, 2000 | Support levels: 1900, 1877, 1860, 1840​

gold-2.png
 
Silver, the pair may fall.

On the daily chart, the first wave of the higher level (1) of 3 formed, a downward correction developed as the wave (2) of 3, and the third wave (3) of 3 forms. Now, the first wave of the lower level 1 of (3) has formed, and a local correction is developing as the wave 2 of (3), within which the wave c of 2 is forming.

If the assumption is correct, the price will fall to the levels of 23.52 - 22.73. In this scenario, critical stop loss level is 25.12.

silver.png
 
Central banks continue selling gold

gold.jpg


Yesterday, the World Gold Council (WGC) provided a preliminary report on the market state. The organization noted that in the first quarter of 2022, there was a trend for the sale of physical gold from the reserves of central banks, and this is the first period since 2020 when such a trend has been recorded. Most actively in February, metal was sold by such countries as Uzbekistan and Kazakhstan. In particular, Uzbekistan reduced its reserves by 22 tons, and Kazakhstan – by 21 tons, and for it gold reserves became the lowest since 2020. Among the bullion buyers during this period, only India and Ireland were noted, which replenished their stocks by a modest 2.6 tons and 1 ton, respectively.

The US Commodity Futures Trading Commission (CFTC) data confirm the global sell-off trend. According to the report for the last week, the number of positions of buyers secured by money amounted to 84.554K, while the same figure for sellers reached 335.029K. At the same time, the weekly change in positions indicated an increase in sellers' contracts by 772 and a decrease by 5.858K contracts among buyers.​

gold.png


The price is correcting within the local Triangle pattern on the daily chart. Technical indicators maintain a weakened buy signal: fast EMAs on the Alligator indicator have come close to the signal line, and the AO oscillator histogram has moved into the sell zone, having formed the first bars below the transition level.

Resistance levels: 1957, 2050 | Support levels: 1900, 1830​
 
gold-forum.jpg

The pair may grow.

On the daily chart, the third wave of the higher level 3 of (5) develops, within which the wave iii of 3 forms. Now, the third wave of the lower level (iii) of iii is developing, within which the wave iii of (iii) has formed, the correctional wave iv of (iii) has ended, and the development of the wave v of (iii) has started.

If the assumption is correct, the pair will grow to the levels of 2150 - 2200. In this scenario, critical stop loss level is 1890.

gold.png
 
silver-forum.png

On the daily chart, the development of the third wave of the higher level (3) of 3 started, within which the first wave of the lower level 1 of (3) formed, and a local correction develops as the wave 2 of (3). Now, the wave c of 2 is forming, within which the third wave (iii) of c is developing.

If the assumption is correct, the price will fall to the levels of 23.52 - 22.73. In this scenario, critical stop loss level is 25.12.

silver.png
 
gold-forum.jpg

XAUUSD shows moderate growth during Asian trading, testing the level of 1960 again. The day before, the instrument has already made attempts to consolidate above it, having updated local highs from March 14. Gold prices briefly rose to a monthly high on fears of increased inflationary risks in Europe and the United States, which was the reason for the purchase of the metal, but closer to the end of the Monday afternoon session, the "bulls" lost most of their gains. Financial markets are under pressure from geopolitical tensions and the desire of central banks to tighten monetary policy amid soaring consumer prices and associated fears of a recession. This, in turn, continued to benefit traditional safe-haven assets and pushed spot prices higher into the area of 1958 - 1960. The US dollar is also stable and is hovering around high levels around 100 in the USD Index.

Tomorrow, investors are waiting for the publication of inflation data from the US. Despite a number of active measures taken by the US Federal Reserve to contain it, analysts expect the annual value to accelerate to 8.4% in March. The biggest contributor is likely to come from higher energy prices as commodity markets surged to new record highs due to the sanctions policy against the Russian economy. According to the published minutes of the meeting of the Federal Open Market Committee of the US Federal Reserve (FOMC), the regulator intends to reduce the balance sheet by 95 billion dollars every month, starting from May of this year, and accelerate the rate of interest rate hike to 0.50%. In general, officials are optimistic about changing the current parameters to fight inflation, believing that the US economy is strong enough not to experience a recession in the face of geopolitical tensions.

gold-1.png


Bollinger Bands in D1 chart show moderate growth. The price range is slightly widening slightly but does not conform to the development of the "bullish" sentiment yet. MACD indicator is growing, while preserving a rather stable buy signal (located above the signal line). Stochastic is showing similar dynamics; however, the indicator line is approaching its highs, indicating the risks of overbought instrument in the ultra-short term.

Resistance levels: 1,974, 2,000, 2,015, 2,030 | Support levels: 1,952, 1,930, 1,900, 1,877

gold-2.png
 
Back
Top