Precious Metals updates by Solid ECN

silver-forum.png


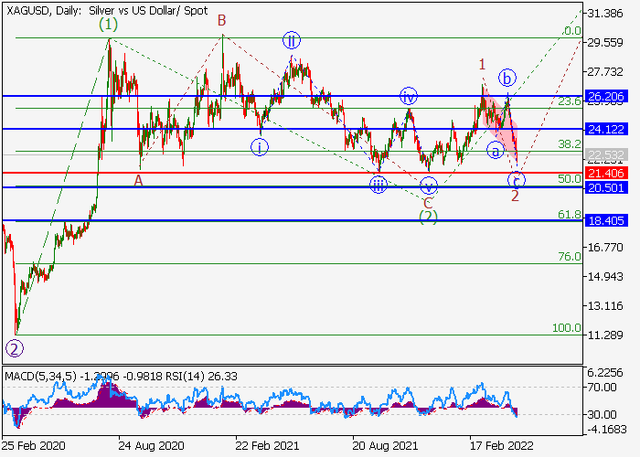
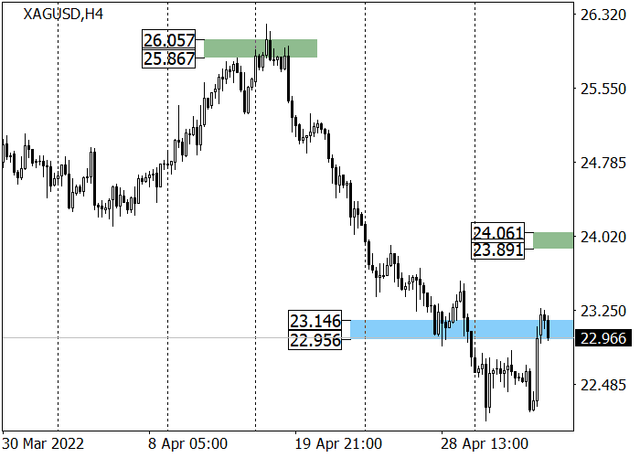
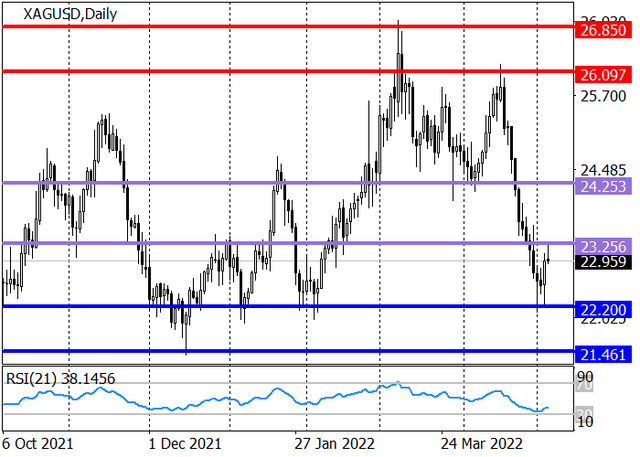
Silver quotes show a local downtrend, trading around 23.56.

The pressure on the instrument is still exerted by expectations of further tightening of monetary policy by the US Federal Reserve. Already during the May meeting, members of the Fed can raise the key interest rate by 50 basis points, as well as launch a quantitative tightening program. High interest rates have always been an obstacle to the growth of the precious metals market. The second negative factor is the US bond market, which has been at its highs of 2018. The high yields of Treasuries look much more attractive to investors than riskier assets such as gold and silver. Finally, a more long-term negative factor is the withdrawal of the London Metal Exchange (LME) from the global precious metals trading market. The day before, representatives of the trading platform announced the termination of all transactions with these assets until July 11 due to a drop in demand for contracts for gold and silver; however, experts attribute this event to recent reports of the withdrawal of contracts for nickel.

Over the past week, the demand for silver, according to the US Commodity Futures Trading Commission (CFTC), remained virtually unchanged: the number of net speculative positions in the precious metal amounted to 46.4K against 46.0K a week earlier.

silver.png


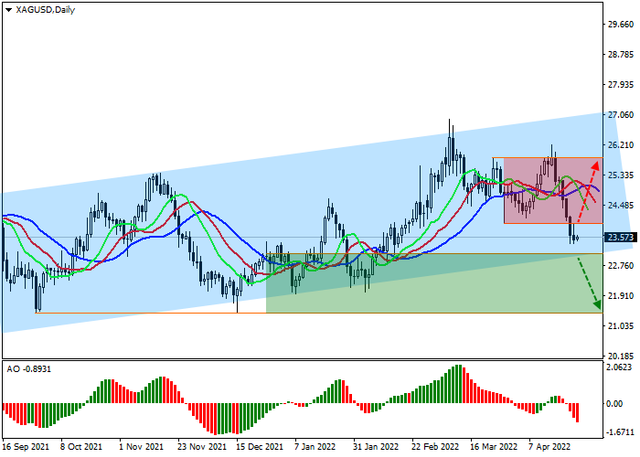
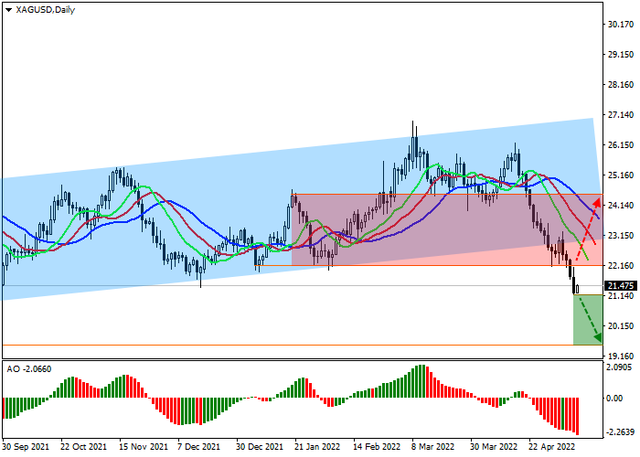
The price is trading within the global ascending corridor, approaching the support line. Technical indicators have already reversed and issued a sell signal: the fast Alligator indicator EMAs crossed the signal line from above, and the histogram of the AO oscillator is forming descending bars in the sales area.

Support levels: 23, 21.4 | Resistance levels: 23.95, 25.8​
 
gold-forum-1.png


Quotes of XAUUSD have suspended growth and are being corrected down ahead of the May meeting of the US Federal Reserve on monetary policy, where a decision can be made to raise the key rate by 0.50%. Now the asset is trading around 1873.0.

Nevertheless, despite the local decline, gold continues to fulfill its main function of protecting investor capital from depreciation in the face of critically high inflation, which in the US reached 8.5% year on year. It is for this reason that the demand for the asset from the side of large market players continues to be consistently high, and since the beginning of March, ETFs denominated in gold have purchased another 100 tons of metal. Of course, in the context of the "hawkish" policy of the US Fed, XAU/USD is slowly declining, and in the event of a sharp increase in interest rates during the meeting scheduled for May 3, an acceleration of downward dynamics is possible; however, the likelihood that quotes will trade above at 1800 dollars an ounce is also quite high.

Investors' interest in trading the assets of the metal group and, in particular, gold is also confirmed by the data of the US Commodity Futures Trading Commission (CFTC). According to last week's report, the number of net positions backed by money remains in favor of buyers at 180,607 contracts, while sellers have a value of 55,640.

gold.png


On the daily chart, the price is correcting as part of a local decline wave, approaching a solid support line located in the area of 1810. Technical indicators have already reversed and issued a sell signal: the fast Alligator indicator EMAs crossed the signal line from above, and the histogram of the AO oscillator moved to the sales area, having formed several bars below the transition level.

Support levels: 1865, 1810 | Resistance levels: 1916, 1978​
 
gold-forum-1.png


Quotes of the precious metal are being corrected in a downtrend, being at around 1883.

Investors are showing an active interest in gold as a defensive asset after the freezing of Russia's gold and foreign exchange reserves against the backdrop of sanctions imposed after the start of a special military operation in Ukraine. According to the statistics of the World Gold Council, in Q1 2022, demand increased by 34%, reaching 1.234K tons, while the volume of supply in the same period was fixed at 1.157K tons. Despite the positive statistics, at the moment one can observe a downward correction in XAU/USD, which is caused by the market's expectation of the US Federal Reserve meeting scheduled for May 4 and the tightening of the US monetary policy parameters.

federal-reserve.png


Additional pressure on the metal comes from its main consumer, China. The outbreak of coronavirus in the country has not yet been contained, and last week there were reports of an increase in the incidence in its capital. Investors are seriously afraid that the authorities may impose quarantine restrictions, similar to those currently in effect in Shanghai (a total lockdown has been introduced in the industrial center, and residents are undergoing daily mass testing for COVID-19). Against this background, according to the data of the National Bureau of Statistics of the People's Republic of China, the index of business activity in the Chinese manufacturing sector in April fell to 47.4 points from 49.5 points, continuing to fall from the psychologically important level of 50 points separating growth from recession. Business activity in the non-manufacturing sector fell even more and amounted to 41.9 points against 48.4 points in March.

Thus, the number of gold contracts decreased to 218.0K from 239.8K a week earlier, according to the US Commodity Futures Trading Commission (CFTC).

gold.png


On the daily chart, the price is correcting as part of a local decline wave, approaching a global support line located in the area of 1810. Technical indicators have already reversed and issued a signal to open short positions: fast EMAs on the Alligator indicator continue to expand the range of fluctuations, and the histogram of the AO oscillator, having moved into the sell zone, forms descending bars.

Support levels: 1870, 1810 | Resistance levels: 1916, 1978​
 
silver-forum-2.png


High probability of pair growth.
On the daily chart, the development of the third wave of the higher level (3) of 3 has begun, in which the first wave of the lower level 1 of (3) has formed and the local correction continues to develop as wave 2 of (3). At the moment, wave c of 2 is being built, within which the formation of the fifth wave of the lower level (v) of с of 2 is being completed.

If the assumption is correct, the price of XAGUSD will continue to move towards the area of 24.12 - 26.2. The level of 21.4 is critical and stop-loss for this scenario.

silver.png
 
gold-forum-1.png


XAUUSD, the instrument rushed to local lows
Gold prices are consolidating near the level of 1865 after an attempt at corrective growth the day before, which did not allow XAUUSD to consolidate on new local lows from February 16. The pressure on quotes is exerted by the growth in the yield of US Treasury bonds: the indicator for 10-year bonds last Monday exceeded 3% for the first time since December 2018 and remains in this area at the present time.

The investment attractiveness of the precious metal is decreasing before the start of the US Federal Reserve's meeting on monetary policy, which will be held today at 20:00 (GMT+2). US officials are expected to raise interest rates by 50 basis points at once, and also announce the launch of a quantitative tightening program, which should help to reduce the almost 9 trillion dollars balance sheet. Higher short-term interest rates and US bond yields tend to increase the opportunity cost of holding zero-yield bullion.

This week, the Bank of England will also hold a meeting on monetary policy, which will allow it to maintain parity, but the European Central Bank (ECB) again looks somewhat apart from this background. The regulator has not officially announced plans to tighten monetary policy, but its representatives have repeatedly spoken out in favor of such a scenario. In particular, Isabelle Schnabel, a member of the executive board, commenting on the problem of growing inflation in the region, noted that she allows the launch of a program of gradual rate increase as early as July this year.

gold-1.png


On the daily chart, Bollinger Bands are steadily declining. The price range is changing slightly, but remains rather spacious for the current level of activity in the market. MACD is also decreasing, maintaining a relatively strong buy signal, being located below the signal line. Stochastic, having demonstrated an unsuccessful attempt at corrective growth is again reversing into a downward plane, still indicating the risks of the instrument being oversold in the ultra-short term.

gold-2.png
 
silver-forum-1.png


Despite the fact that the US Fed has moved to a decisive tightening of monetary policy and yesterday raised the interest rate immediately by 50 basis points to 1.00%, commodities reacted to this with an increase in quotations. Most likely, traders put the regulator's decision in the prices of trading instruments long before the official announcement. Since the analysts' forecast on the adjustment of the rate value was justified, the USD began a downward correction.

An additional factor that prevented the exchange rate of the XAG/USD pair from continuing the April decline is the restoration of production processes in China. While cities such as Shanghai and Beijing continue to adhere to the principles of a dynamic zero tolerance policy for COVID-19, regardless of the economic costs, Hong Kong announced the easing of anti-COVID measures from May 5. On Monday, the number of new cases of coronavirus infection in the metropolis fell below 300 for the first time in almost three months — to 283. Thus, from May 19, cafes, nightclubs and some other establishments that have been closed since the beginning of the year, when the fifth wave of the epidemic covered the country, will resume work. Against this background, we can count on the fact that other large cities will gradually open up, and this, in turn, will support the demand for precious metals.

The long-term trend remains upward. Last Monday, the bidders tested a strong support level of 22.20, which was held, after which the price of the XAG/USD pair rose to the resistance level of 23.25. If this level is broken out, the upward trend will continue with a target at 24.25.

silver-1.png


The mid-term trend is downward. As part of the decline last week, the quotes reached the target zone 2 (23.14–22.95). This week, the "bears" tried to break it, but the price returned to the area of 23.14–22.95. In case of consolidation above the range, the upward correction will continue with a target at the trend boundary of 24.06–23.89.

Resistance levels: 23.25, 24.25, 26.1 | Support levels: 22.20, 21.45

silver-2.png
 
gold-forum-1.png


On the daily chart, the development of the third wave of the higher level (5) of 3 continues, in which wave 3 of (5) has formed. At the moment, there is a downward correction as the fourth wave 4 of (5), within which wave c of 4 is being formed.

If the assumption is correct, after it is finished, the growth of XAUUSD will continue to the levels of 2100 - 2200. The level of 1827.33 is critical and stop-loss for this scenario.

gold.png
 
silver-forum-1.png


On the daily chart, the development of the third wave of the higher level (3) of 3 started, within which the first wave of the lower level 1 of (3) formed, and a local correction developed as the wave 2 of (3). Now, the wave c of 2 has formed, within which the fifth wave of the lower level (v) of c of 2 has developed.

If the assumption is correct, the XAGUSD pair will move to the area of 24.12 - 26.2. In this scenario, critical stop loss level is 21.4.

silver.png
 
silver-forum-1.png


The precious metal quotes show a local downward trend, trading around 21.5.

The key factor that led to the global sell-off in commodity markets was the US Federal Reserve's inflation forecast for April, which suggests a decline to 8.1% from 8.5% a month earlier. The main US statistics on the dynamics of consumer prices will be published today at 14:30 (GMT+2). Adjusting the interest rate to 1.00% could not have had such an early effect, and there are no prerequisites for reducing real inflation now: oil quotes are held above 100 dollars per barrel, contributing to fuel price growth, which increases the cost of delivering goods and increases their final cost. Thus, the key factors of inflation, such as fuel and food prices, are rising, but the regulator insists that inflation should come down. Uncertainty in the market forces traders to get rid of their assets in the stock market and commodity market.

A serious outflow of investors from silver is also confirmed by data from the US Commodity Futures Trading Commission (CFTC), according to which, over the past week, the number of net speculative positions decreased to 28.1K from 35.4K a week earlier. Over the past three weeks, the number of positions has decreased from 46.5K to the current 28.1K for the first time since 2020.

silver.png


The price left the limits of the rising global channel with dynamic boundaries at 26.50–22.00, breaking the support line yesterday. Technical indicators reversed and gave a sell signal: the range of EMA fluctuations on the Alligator indicator actively expands downwards, and the histogram of the AO oscillator forms downward bars in the sell zone.

Resistance levels: 22.15, 24.4 | Support levels: 21.17, 19.5​
 
Back
Top