Precious Metals updates by Solid ECN

gold-forum-2.png


On the daily chart, the fifth wave of the higher level (5) of 3 develops, within which the wave 3 of (5) formed. Now, a downward correction is ending as the fourth wave 4 of (5), within which the development of the wave c of 4 is ending.

If the assumption is correct, after the end of the correction, the pair XAUUSD will grow to the levels of 2070.42 - 2200. In this scenario, critical stop loss level is 1770.2.

gold.png
 
gold-forum-1.png


Quotes of XAU/USD are under pressure from "hawkish" rhetoric from the US Federal Reserve and high prospects for the continuation of an aggressive monetary policy at the June meeting, in particular, a sharp increase in the rate by another 0.50%. The "bearish" momentum is expected to push gold prices towards psychological support at 1800. In addition, investors have become more inclined towards risky assets, redirecting their capital from protective ones, which also puts pressure on quotes, while the fundamental picture changes slightly.

Pressure on the position of gold is also exerted by the rising dollar, which is supported by technical factors and high yields on US Treasury bonds. However, the deteriorating economic outlook and the ongoing conflict in Eastern Europe are giving the precious metal some support. At the first sign that central banks will ease their "hawkish" rhetoric, one can expect a noticeable increase in demand for a "defensive" asset.

Among the macroeconomic factors at the beginning of the week, weak Chinese statistics should be singled out, providing additional support to the US currency. Retail Sales in China plunged to a record 11.1% in April after declining 3.5% in March. Analysts had expected a much more modest 6.0% decline.

gold-1.png


Bollinger Bands in D1 chart demonstrate a stable decrease. The price range is expanding from below; however, it fails to catch the surge of the "bearish" sentiment at the moment. MACD is going down preserving a stable sell signal (located below the signal line). Stochastic has been in close proximity to its lows for several days already, which indicates the risks of gold being oversold in the ultra-short term.

Existing short positions should be kept until technical indicators are clarified.

Resistance levels: 1823.09, 1850.2, 1877.83, 1900 | Support levels: 1800, 1775, 1752.87, 1730

gold-2.png
 
silver-forum-1.png


On the daily chart, a downward correction of the higher level develops as the second wave (2), within which the wave C of (2) forms. Now, the third wave of the lower level iii of C has formed, and a local correction has started to develop as the fourth wave iv of C.

If the assumption is correct, after the end of the correction, the price will fall to the levels of 18.40–15.71. In this scenario, critical stop loss level is 23.25.

silver.png
 
XAGUSD, silver prices are consolidating around 21.50

Silver prices show a slight decline during the Asian session, testing the level of 21.5 for a breakdown. The instrument managed to update the local highs of May 11 the day before; however, the "bulls" failed to consolidate on new levels, as a result of which XAGUSD returned to the opening levels. Pressure on the positions of the instrument was exerted by optimistic macroeconomic data from the USA.

Tuesday’s statistics on the dynamics of Retail Sales in the US was better than market expectations. In April, Retail Sales volumes slowed down from 1.4% to 0.9%, while analysts expected a decline to 0.7%. Retail Sales excluding Autos for the same period slowed down from 2.1% to 0.6%, which turned out to be twice as good as experts' forecasts. Retail Sales Control Group declined marginally from 1.1% to 1.0% in April, while forecasts suggested a sharp slowdown to 0.5%. Thus, sales figures do not yet reflect a dramatic slowdown in consumer activity within the country. This removes some of the risks from investors who are concerned about a possible slowdown in the pace of monetary tightening by the US Federal Reserve.

silver-1.png


Bollinger Bands on the daily chart show a steady decline. The price range is narrowing, reflecting the emergence of multidirectional trading dynamics in the short term. MACD indicator is growing, while preserving a rather stable buy signal (located above the signal line). Stochastic is showing similar dynamics; however, the indicator line is already approaching its highs, indicating the risks of overbought instrument in the ultra-short term.

Resistance levels: 22, 22.4, 22.7, 23 | Support levels: 21.39, 21.12, 20.81, 20.39

 
gold-forum-2.png


The precious metal quotes are being corrected in a downtrend, being around 1814 dollars per ounce.

The asset is declining amid fears for global demand due to the coronavirus outbreak in China, which led to serious restrictions. The negative effect on the Chinese economy can be assessed now. Yesterday, industrial production data were published in April, which fell by 2.9% after rising by 5.0% in March. Retail sales fell 11.1%, well above the 3.5% decline in March. Due to the introduced lockdown, the unemployment rate also increased, which amounted to 6.1% compared to 5.8% in March.

According to the Commodity Futures Trading Commission (CFTC), since mid-March, the number of net speculative positions in gold has decreased from 274.5K to 193.3K, and over the last week, the outflow amounted to 5.9K positions. Thus, the overall speculative position in gold is approaching the minimum levels of the middle of last year at 165–175K positions, which indicates an extremely low demand for the metal.

gold.png


On the daily chart of the asset, the price is moving within the global ascending channel, approaching its lower border. Technical indicators maintain a stable sell signal: indicator Alligator’s EMA fluctuations range expands, and the AO oscillator histogram, having moved into the sell zone, continues to form downward bars.

Resistance levels: 1850, 1917 | Support levels: 1790, 1700​
 
gold-forum-1.png


On the daily chart, the fifth wave of the higher level (5) of 3 develops, within which the wave 3 of (5) formed. Now, a downward correction has developed as the fourth wave 4 of (5), within which the wave c of 4 has formed.

If the assumption is correct, the pair will grow to the levels of 2070 - 2200. In this scenario, critical stop loss level is 1785.69.

gold.png
 
silver-forum-1.png


On the daily chart, a downward correction of the higher level develops as the second wave (2), within which the wave C of (2) forms. Now, the fourth wave of the lower level iv of C has formed, and the development of the fifth wave v of C has started, within which a local correction of the lower level is forming as the wave (iv) of v.

If the assumption is correct, after the end of the correction, the price will fall to the levels of 18.40–15.60. In this scenario, critical stop loss level is 23.20.

silver.png
 
gold-forum-1.png


Gold prices show a slight increase during the morning session, developing a fairly strong "bullish" momentum formed in the middle of last week and trading at 1855.9. The main driver of the instrument's recovery was the weakening USD Index, which sharply corrected from multi-year highs around 105, losing more than 2.5%, to a low of 102, despite the "hawkish" rhetoric of the US Fed members.

Demand for XAUUSD is holding up as global tensions escalate as fundamentals change little. Many economies are facing record inflation amid soaring prices for energy and other resources, forcing investors to look for safer alternatives to risky assets. In turn, rising inflation prompts the world's central banks to sharply tighten monetary policy, making gold ownership less attractive, since it does not generate interest income. Meanwhile, a special military operation in Ukraine continues, and the negotiation process is actually stopped, so the conflict is becoming more and more protracted.

Today, investors are waiting for the publication in the US of May statistics on business activity, as well as April data on the dynamics of New Home Sales. During the day, the Chair of the US Federal Reserve, Jerome Powell, is also scheduled to speak.

gold-2.png


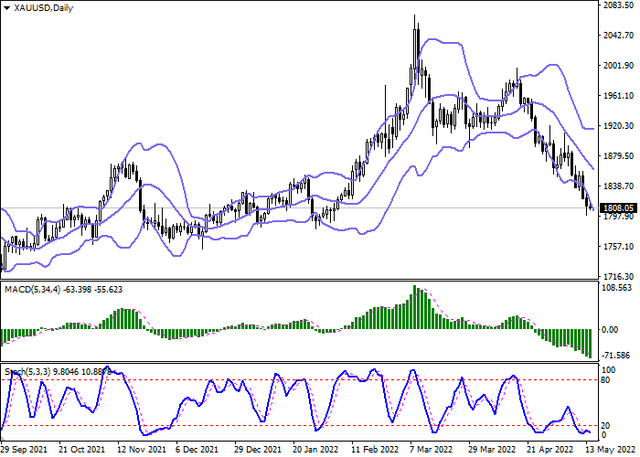
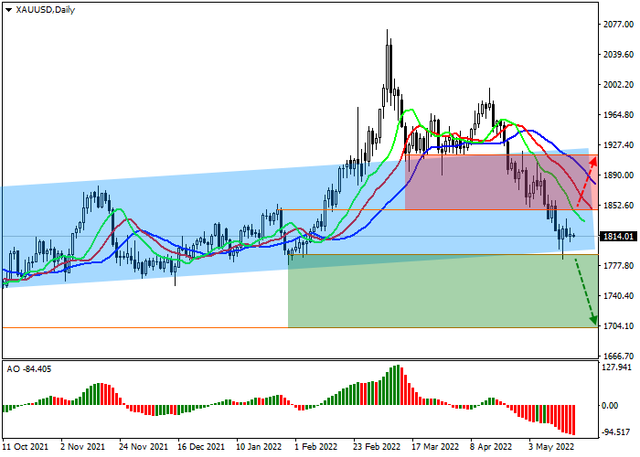
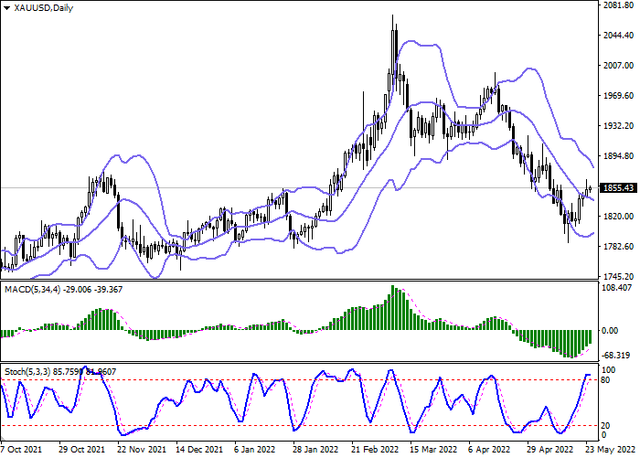
Bollinger Bands in D1 chart demonstrate active decrease. The price range is narrowing, reflecting the emergence of ambiguous dynamics of trading in the short term. MACD indicator is growing, while preserving a rather stable buy signal (located above the signal line). Stochastic approached the level of "100" and reversed into a horizontal plane, indicating a strongly overbought instrument in the ultra-short term and signaling in favor of the development of a corrective decline.

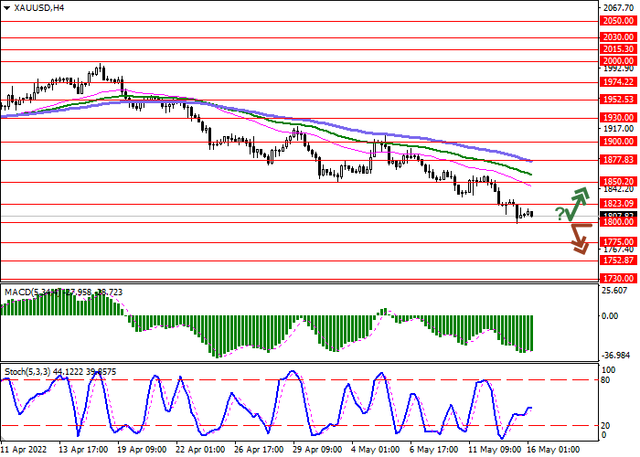
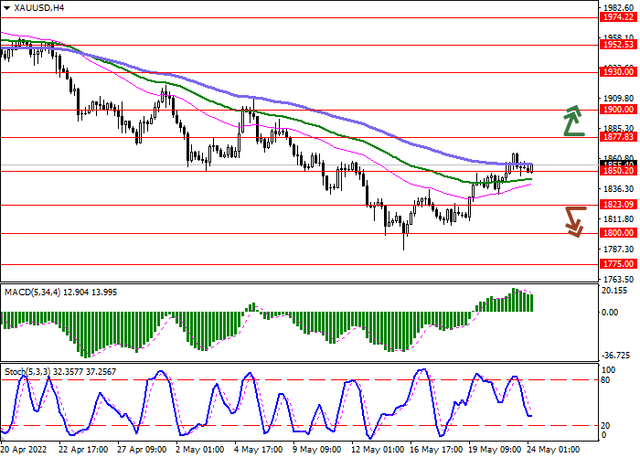
Resistance levels: 1877.83, 1900, 1930, 1952.53 | Support levels: 1850.2, 1823.09, 1800, 1775

gold-1.png
 
silver-forum-1.png


The escalation of the conflict in Ukraine, high rates of global inflation, and lower forecasts for the recovery of the economies of developed countries create obstacles for further upward dynamics in the XAGUSD pair. However, analysts predict a 5% increase in silver demand in 2022 due to further structural progress in industrial production, which is expected to reach another record level this year, and jewelry sales growth after the coronavirus pandemic. On the supply side, higher mine productivity is expected due to increased production capacity and increased production at existing mines, leading to a 3% increase in global supply in 2022.

Thus, it can be assumed that the fall in metal prices will be stopped when geopolitical tensions decrease and the US Federal Reserve rate stabilizes in a specific target range. Up to this point, the growth of XAGUSD quotes should be taken as a correction.

From the technical analysis position, silver is trading in a long-term downtrend, in which market participants reached the support level of 20.57. Then the RSI technical indicator signaled that the instrument was in the oversold zone, which led to the development of a correction, in which market participants tested the resistance level of 22.2. As long as this level is held by the "bears," further sales of the precious metal will be a priority. The target for short positions will be the May low. If 22.2 is broken upwards and the consolidation above, we should expect the quotes to rise to the next resistance level of 24.25.

silver-1.png


As part of the medium-term downtrend, market participants reached the target zone 3 (21.24–21.05) but failed to consolidate below it, after which a correction began, in which market participants tested the key resistance of the trend at 22.32–22.15. Currently, the zone is holding, which signals the possibility of new sales with the target at the May low of around 20.50.

Resistance levels: 22.20, 24.25 | Support levels: 20.57, 19.61​
 
gold-forum-1.png


Quotes of the precious metal are being corrected in a sideways trend, being at around 1845.0.

XAUUSD is holding above the mid-year level at 1800 and, despite the downtrend of the last two months, investments in gold continue to bring income to investors. This can be clearly seen if we compare the dynamics with the main stock markets of the world. The yield of the Dow Jones index over 4 months of this year decreased by 9.63%, the German DAX 30 declined by 12.99%, and the French CAC 40 decreased by 10.97%, while gold over this period increased by 3.75%, which demonstrates that the precious metal performs the function of protecting against fluctuations in financial markets during a period of uncertainty.

According to a report by the US Commodity Futures Trading Commission (CFTC), over the past week, short positions of swap dealers in gold were reduced by 18349 contracts, and this is the largest volume of fixing positions over the past year. In the same period, the number of buy positions increased by 25 thousand, which fully reflects the mood of investors who consider the prospects for strengthening the asset's rate to be very high.

gold.png


On the daily chart of the asset, the price is trading within the global ascending channel, starting to form a reversal after reaching the global support line. Technical indicators continue holding a sell signal, which is starting to weaken actively: fast EMAs on the Alligator indicator are approaching the signal line, and the AO oscillator histogram is forming upward bars being in the sale zone.

Support levels: 1810, 1770 | Resistance levels: 1866, 1917​
 
Back
Top