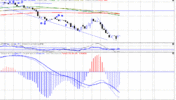
Histogram
Hi Onwukarisa,
To trade MACD for divergence arguably the common technique is to observe the histogram.
Comparing histogram and price data peaks or troughs of recent and current peaks or troughs to identify the points of divergence.
However, this from investopedia:
"Unfortunately, the {MACD} divergence trade is not very accurate - it fails more times than it succeeds. Prices frequently have several final bursts up or down that trigger stops and force traders out of position just before the move actually makes a sustained turn and the trade becomes profitable."
I wanted to get a third party source to chime in with years of my own experience. Despite this it is still a staple, popularly used indicator.
Another issue would be the settings and the timeframe application but the standard settings (Fast.EMA:12; Slow.EMA:26; Sig.EMA9 [some use SMA here]) are equally unreliable as any (many) I've tried.
I would suggest to use the divergence as a warning and then wait until the crossover of MACD X Signal line has occurred and then also retests (the crossover happens and after those lines move away from each other they come back together) for an entry/exit point.
Cheers,
Cyclon
