• Please try to select the correct prefix when making a new thread in this folder.

    Discuss is for general discussions of a financial company or issues related to companies.

    Info is for things like "Has anyone heard of Company X?" or "Is Company X legit or not?"

    Compare is for things like "Which of these 2 (or more) companies is best?"

    Searching is for things like "Help me pick a broker" or "What's the best VPS out there for trading?"

    Problem is for reporting an issue with a company. Please don't just scream "CompanyX is a scam!" It is much more useful to say "I can't withdraw my money from Company X" or "Company Y is not honoring their refund guarantee" in the subject line.
    Keep Problem discussions civil and lay out the facts of your case. Your goal should be to get your problem resolved or reported to the regulators, not to see how many insults you can put into the thread.

    More info coming soon.

Discuss RoboForex.com

General discussions of a financial company
Providec Trading System: Simple Strategy for Beginners

Author: Timofey Zuev

roboforex-header.jpg


Dear Traders,

The Providec trading strategy is one of the simplest Forex strategies that I have ever seen: just two indicators than never close the price chart. The trading strategy suits any currency pair or any other instrument featured by the MetaTrader 4 or MetaTrader 5 terminal, be it futures, stocks, of CFDs. The timeframe may vary from M1 to MN.

If the timeframe is shorter than H1, open orders in the European or American sessions only. As soon as the American session is over, close all trades regardless of their results. Conversely, if you trade on H1 or higher, you may leave trades in the market for as long as you wish.

The Providec strategy desktop
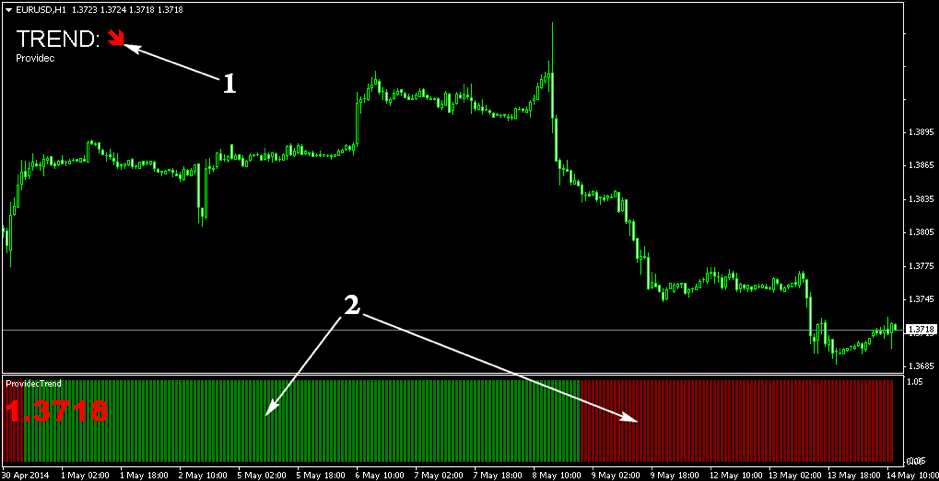
1-3.png


Providec strategy

Description of the desktop:

  1. The Providec indicator that gives direct signals to buy or to sell by the strategy.
  2. The ProvidecTrend indicator that filters the signals of Providec.

A signal to buy by the Providec system

A signal to buy needs several conditions to be met:

  1. The Providec indicator must show a green arrow aimed upwards.
  2. The ProvidecTrend indicator must be green.
  3. The green arrow of Providec must be the first green line to emerge after ProvidecTrend changed from red to green.

An example of a signal to buy by the Providec system

Read more at R Blog - RoboForex

Sincerely,
RoboForex team
 
How to Trade Nikkei 225 Index

Author: Andrey Goilov

roboforex-header.jpg


Dear Traders,

Nikkei 225 is one of the most important stock indices reflecting the state of the Japanese economy and overall business activity in the country. It is considered one of the oldest indices in Asia. The stock index includes 225 stocks of companies trading directly in the Japanese market. The most famous of them are Sony Corporation, Canon Inc, Nissan Motor Company, and Honda Motor Company.

Curiously enough, the index was named after an economic newspaper that used to calculate the instrument. It was first published as long ago as 1950 and was calculated as the arithmetical mean of the companies’ securities. A company’s weight in the index is calculated based not on the general market capitalization but directly on the stock price. The set of companies in the index is revised every September; in October, changes are accepted.

By the way, RoboForex has just made Nikkei 225 available for trading. Moreover, the company has made trading various indices easier and more attractive by decreasing the minimal lot and step. Average spreads remain among the smallest; for example, an average spread for the De30Cash index is just 0.5 euro per contract.

Tech analysis of Nikkei 225

nikkei3.jpg


Nikkei 225 differs from other stock indices, such as NASDAQ, Dow Jones, or S&P 500. If other indices are capable of mighty bullish trades and quick restoration after falls, Nikkei 225 had stuck in a wide flat since the beginning of 2017. Only this year, the quotations have dropped below the lower border of the range, almost reaching the level of 2016.

However, the price returned into the channel quite soon, and the quotations are now getting ready for testing an important resistance level at 24200; a breakaway of this level will mean a perspective of further growth.

As for an important support level, it is at 20000. As you may see, upon testing this level upwards, the price tested the support level three times and demonstrated a good bounce upwards.

On the whole, the instrument is quite technical: many levels and patterns work off quite well. Even now, we can single out an inverted Head and Shoulders pattern forming. Inside the pattern, we may expect a decline and test of 20005, where the right shoulder of the pattern will be complete.

pic-1-jp225cash-w1.png


Tech analysis of Nikkei 225

As a rule, most traders who use graphic patterns for trading, buy at the right shoulder. The general goal of the growth is 30985. The growth will not happen if 16255 is broken away – this will cancel the pattern and potentially indicate a further decline.

A simple strategy for trading Nikkei 225

Not all traders enjoy using classical tech analysis for trading because it requires constant thinking and drawing different levels and patterns. A significant disadvantage of the analysis is it being subjective: some will think a pattern not regular enough, others will see a Triangle instead of, say, a reversal pattern. Let us have a look at a trading strategy for trading Nikkei 225 that is not subjective.

Read more at R Blog - RoboForex

Sincerely,
RoboForex team
 
Dear Traders!

As always, this week the ContestFX project continues its competitions, such as:

The recently started 113th competition of "Demo Forex" and 270th competition of "Week with CFD".
At 12:00, August 5th, 2020, starts the 403rd competition of "Trade Day".
At 20:00, August 6th, 2020, starts the 320th competition of "KingSize MT5".
All our participants get complete access to any of the competitions they like right after passing a simple registration procedure. If they win, they will receive prize money to their real trading accounts and use it in trading operations on the Forex market without investing their own funds in the initial deposit.

Join and win!

Sincerely,
RoboForex Contest
 
False Signals in Forex: How to Detect and Avoid Them?

Author: Maks Artemov

roboforex-header.jpg


Dear Traders,

Having opened a position, many traders ponder at the question: “Why did it close with a loss if I seemed to do everything right? Almost all signals by the strategy were there but in the end, the price went in the opposite direction”. The keyword in the question is “almost”. Sometimes the market makes movements that you cannot forecast or calculate, in which case indicators turn out virtually useless. What was the point? What went wrong? The answer is simple: the trading strategy gave a false signal, and the trade turned out losing.

Let us try to make it clear why such things happen and why false signals appear.

Why do false signals emerge?

The news

News is, perhaps, the most frequent reason for false signals. As you know, the market accounts for everything, and before some news is officially published, the quotations react and start moving in a certain direction. Normally, if some preliminary results turn out better than expected (such as the GDP reports), the quotations will grow. However, practice shows that the quotations start growing before the publication of the news itself, and at the renewal of the data, the market makes an abrupt reversal and starts a steep decline.

At this moment, Stop Losses trigger at the positions opened beforehand, and impatient market participants worsen the situation, craving for a swift and large profit. Several minutes after the publication of the news, the market calms down, and the price starts going in the correct direction.

news-1-1200x543.png


False signals - The news

Errors in the calculations of indicators

Another reason for the appearance of false signals is errors in the indicator calculations. Many traders tend to forget that after abrupt market movements the data they receive is heavily distorted, and their indicators make mistakes. Impatient traders decide that this is an entry signal and get a losing position.

indikator-2-1200x546.png


False signals - Indicator errors

False breakaways of levels

In tech analysis, the most widespread false signals are false breakaways of levels. There are two options of trading support and resistance levels: to trade bounces off them or their breakaways. Here is where market players get mistaken.

Let us imagine trading bounces off the resistance level. The price reached the level, and the trade decided to open a selling trade. They placed the SL behind the level (in a safe zone) but the price broke the level away and close the trade by the SL.

What do impatient traders do in such cases?

Read more at R Blog - RoboForex

Sincerely,
RoboForex team
 
Cryptocurrency Prospects in the Second Half of the Year: No Hope for Miracles

Author: Anna Rostova

roboforex-header.jpg


Dear Traders,

The first half of this abnormal year 2020 was hard for the crypto market as well. The coronavirus itself can do nothing to digital money because they do not exist in reality but emotions influence crypto trading no less than the fiat market. In January-June this year, the sum withdrawn from the crypto market amounted to almost 2 billion USD – this is almost 200% more than during the same period last year. As we see, cryptocurrency prospects to become a safe-haven asset have failed but what if they have other advantages?

The stock market slump in March that happened due to the global quarantine did not bring the digital quotations down. After the BTC and altcoin rates fell to the low, buyers returned to the crypto market. Now the latter is aiming at long-term goals because it is clear that world economies will not restore at a split second – this means that we need to look for opportunities to make money or at least stay afloat in some other universe. In the second half of the year, we see some prospects for cryptocurrencies as the market may offer something.

ETH: the 2.0 version must be a bomb

eth.jpg


For the last several months, the crypto world has been waiting for an important event for the cryptocurrency market prospects, which is the launch of the 2.0 version of the Ethereum network by the Ethereum Foundation. This is the most important and promising foothold for the ETH that it has not yet fully used. The company remains silent about the date of full-scale tests but promises the start just one of these days. Today, the developers suggest that the users should find weak spots in a very limited version of the network – hack the blockchain, damage blocks, etc., i.e. find as many vulnerable spots as possible. For finding them, the company offers a reward of 5000 USD.

This means that testing is on but not on a full scale. Hence, the Ethereum 2.0 is still under development.

The test version of the network may easily be launched this summer, and if the expectations are met the future of the Ethereum will be bright.

The point is expectations. Ethereum 2.0 is expected to solve the scalability problem. Why is it important? Solving the problem will decrease the calculation chain by several links and thus speeds up the process. The speed of calculations has always the key to victory. The quicker one wins the race. Currently, the average speed of the Ethereum network is 15 transactions a second but if the scalability problem is solved, it may reach 1000 transactions a second. None of the large crypto companies has solved it yet but Ethereum has promised an optimal solution many times.

BTC: needs China to be ok

btc.jpg


The probability of a new wave of the coronavirus does not scare crypto investors as much as possible consequences. Long-term investors are focusing their attention on Asia, and the reason is simple: China concentrates a large number of mining farms and plants producing equipment for mining. The share of Chinese miners in miners’ community is still very large. Risk of a new virus – or a new version of an old one – may lead to the closing of mining farms in China. The good news is that such enterprises work quite autonomously, which means they need really grave reasons to close, and there is no such news now.

Apart from bright speculative factors that are mostly theoretical, the market has no other reasons for the BTC to grow.

Every other day we hear the news about either hacking wallets or huge transactions. Nonetheless, this is not what could push the leading cryptocurrency in this or that direction.

What could become a catalyst to drive cryptocurrency prospects? Say, the decision of the SEC about the status of the cryptocurrency – whether it is a currency or an asset. Then the main US banks would include the BTC in the list of currencies available for transactions. As you know, the closer digital money is to real life, the better because more potential users will have access to cryptocurrencies.

Read more at R Blog - RoboForex

Sincerely,
RoboForex team
 
Dear Traders!

This week, the ContestFX project of RoboForex welcomes everyone who is interested to take part in the following competitions:

The gathering pace 113th competition of "Demo Forex".
The weekly 271st competition of "Week with CFD".
At 12:00, August 12th, 2020, starts the 404th competition of "Trade Day".
At 20:00, August 13th, 2020, starts the 321st competition of "KingSize MT5".

We'd like to remind you that all winners of our contests receive prize money to their real trading accounts and can properly use it for performing trading operations on the Forex market without investing their own funds.

Don't miss your chance!

Sincerely,
RoboForex Contest
 
Last edited:
Double & Triple Top, Double & Triple Bottom Patterns: How to Use in Forex?

Author: Maks Artemov

roboforex-header.jpg


Dear Traders,

Today, we will discuss popular and rather widespread patterns of graphic analysis Double Top, Triple Top and its opposite – Double Bottom, Triple Bottom.

As we can deduct from the name, these patterns form either at the top or bottom of a trend. Meanwhile, data shows that they can be encountered on all timeframes and chart types (Japanese candlesticks, bars, linear charts). The only difference timeframe-wise is the time that it takes the pattern to form and the time it takes the signal to work off.

These patterns belong to the reversal category – this means that the work-off of the signal normally leads to the reversal of the current trend or, at least, to a deep correction of the price.

Now let us discuss these technical analysis patterns more scrupulously and learn to use them in trading.

Formation rules of the Double & Triple Tops, Double & Triple Bottom patterns

Let us get started with the formation principles of the patterns.

Double Top

A Double Top usually forms at the peak of an uptrend. The larger the timeframe, the more reliable the pattern (this is relevant for all patterns discussed in this article). At the same time, the signal can work off on any timeframe, including M1, M5, etc.

A Double Top pattern looks like two highs formed one after the other. Theoretically, buyers drive the price to the high, and then a part of them starts to lock their positions, thus decreasing the quotations. At this moment, some latecomers cut in, lifting the price to the same high.

The two peaks do not need to be equal, point to point, but they need to look like two mountain tops. Then the first buyers start taking profits, the price starts declining, and the second wave has nothing to do but to close positions with a loss or a minimal profit.

As a result, the quotations drop, and the actual trend changes direction. The support level in this case is the low formed between the two bottoms. This is the starting point for trading and calculating the potential of the trade. We will talk about entry points a bit later.

doubletop-1-1-1200x540.png


Double Top chart pattern

Triple Top

A Triple Top is a slightly modified Double Top. In practice, it forms the following way: after the first two tops form, another group of buyers enters the market hoping for further growth of the price. Indeed, at that moment the quotations do rise to a high and even may renew the previous highs, but this is it.

Read more at R Blog - RoboForex

Sincerely,
RoboForex team
 
Trader's Psychology: How to Conquer Fear?

Author: Timofey Zuev

roboforex-header.jpg


Dear Traders,

Psychology is an important part of a trader's success in the Forex market. Control over emotions (anxiety and trader's fear) is an intrinsic part of any trading strategy.

Why is the trader's psychology important?

trading-emotions.jpg


The thing is that the trading in Forex implies dealing with money and facing high risks of losses. In modern life, a person spends most of their time earning money for satisfying their material and non-material needs. When you work in a certain structure for a wage and do not worry that you will not get paid at all if you make a mistake; however, in Forex, it is quite different:

  • Firstly, to start trading, you need to open a deposit, i.e. deposit your money on your account.
  • Secondly, each open trade is a risk of losing a part of the deposit.
  • Thirdly, if trading goes offhand, the trader will not only make no profit but lose; in other words, they will not only get a “wage” but will remain without the means of receiving this “wage” in the future.
Thus, the trader’s attitude to money is extremely emotional due both to the risk of losing it and the perspective of making it. Excessive emotions in trading entail both losses and a profit lower than expected.

To become an expert in some sphere, you need to carry out certain duties without useless emotions. When you come to work, you leave your family affairs at home; moreover, you do not worry about each of your operations, you just carry on with what you are to do. Your attitude to trading in Forex must be the same: your trading must be a monotonous sequence of tasks completed. All you need is to disengage yourself from the money and concentrate on carrying out a high-quality trade.

The influence of emotions on the trader’s

Let us discuss the main emotions that a trader may feel at work and must control firmly. As they say, you should know the face of your enemy.

Read more at R Blog - RoboForex

Sincerely,
RoboForex team
 
Dear Traders!

This week, the ContestFx project traditionally continues with the following competitions on demo accounts:

113th competition of "Demo Forex" has entered its third week.
272nd competition of "Week with CFD" has started recently.
405th competition of "Trade Day" will start on 19.08.2020 at 12:00.
At 20:00, August 20th, 2020, starts the 322nd competition of "KingSize MT5".

It's quite easy to become a participant and explore all opportunities and excitement of our project - just create your account at ContestFx and after this simple procedure all competitions will be available to you with a matter of few clicks.

Good luck to all!

Sincerely,
RoboForex Contest
 
Back
Top