• Please try to select the correct prefix when making a new thread in this folder.

    Discuss is for general discussions of a financial company or issues related to companies.

    Info is for things like "Has anyone heard of Company X?" or "Is Company X legit or not?"

    Compare is for things like "Which of these 2 (or more) companies is best?"

    Searching is for things like "Help me pick a broker" or "What's the best VPS out there for trading?"

    Problem is for reporting an issue with a company. Please don't just scream "CompanyX is a scam!" It is much more useful to say "I can't withdraw my money from Company X" or "Company Y is not honoring their refund guarantee" in the subject line.
    Keep Problem discussions civil and lay out the facts of your case. Your goal should be to get your problem resolved or reported to the regulators, not to see how many insults you can put into the thread.

    More info coming soon.

Discuss RoboForex.com

General discussions of a financial company
Dear traders!

This week, the ContestFX project traditionally continues with the following competitions:

The 133rd competition of "Demo Forex" started last week.
The 356th competition of "Week with CFD" has started today.
490th competition of "Trade Day" will start on 13.04.2022 at 12:00.
404th competition of "KingSize MT5" will start on 14.04.2022 at 20:00.

We remind you that every winner of our demo competitions receives funds to their real trading account as a reward, so they could use them to earn on the Forex market without investing their financial savings.

If you want to be one of them, join us!

Sincerely,
RoboForex Contest
 
How to Trade Three White Soldiers Pattern

Author: Victor Gryazin

25.jpg


Dear Clients and Partners,

This article deals with a candlestick pattern called Three White Soldiers: what it looks like, what signals it gives, how it forms, what types it has, and, of course, how it can be used in trading.

How Three White Soldiers pattern forms

Three White Soldiers is a reversal bullish candlestick pattern that predicts a change of a downtrend to an uptrend. This pattern can be encountered on price charts rather often.

When the Three White Soldiers pattern appears, it gives a signal to buy. The pattern has a bearish counterpart called Three Black Crows that was previously described in our blog.

The Three White Soldiers pattern consists of three white candlesticks with large bodies and almost no shadows. The pattern shows that the bulls have managed to capture the initiative and close trading sessions near the daily highs for three days in a row.

Conditions for Three White Soldiers to form
  • As long as this is a reversal pattern, it forms on the local lows after a descending movement. This can either be a reversal of a downtrend or the end of a correction in an uptrend.
  • Three white candlesticks go one after another and have large bodies.
  • Each next candlestick opens at the closing level of the previous one or a bit lower.
  • The shadows of the candlesticks are short. Sometimes candlesticks in Three White Soldiers have no shadows at all: such candlesticks are called Marubozu and make the whole pattern stronger.
  • The second and third candlesticks must be roughly of the same size. If the third candlestick is obviously smaller than the other two, this means bulls are weak.
3soldiers.png


Types of Three White Soldiers

There are two more candlestick patterns that also consist of three white candlesticks and resemble Three White Soldiers. These are the Advance Block pattern and the Stalled pattern; however, instead of giving a signal to buy, they warn the trader of the ascending momentum coming to an end.

Advance Block

If the second and third candlesticks of the Three White Soldiers have small bodies and long upper shadows, the pattern is called Advanced Block. As the name of the pattern shows us, the advance of the bulls was blocked and the bears fight back.

The ascending impulse meets serious resistance, and it becomes extremely possible that the quotations will reverse downwards. This pattern is not good for buying because bulls turn out weak. If the trader has open buying positions, they should take the profit in them.

3soldiers-type1.png


Closing thoughts

The reversal candlestick Three White Soldiers pattern forms after a downward movement and predicts an upward reversal of the quotes. It can be traded on its own or alongside tech analysis instruments and indicators.

Before using the pattern for real, test it on a demo account. See more about candlestick patterns in our Blog.

Read more at R Blog - RoboForex

Sincerely,
RoboForex team
 
RoboForex: upcoming changes to the trading schedule in view of the Easter holidays

roboforex-header.jpg


Dear Clients and Partners,

We are informing you that due to the Easter holidays in the US and Europe, there will be some changes to the trading schedule on Catholic Good Friday and Easter Monday.

This schedule is for informational purposes only and may be subject to further change.

MetaTrader 4 / MetaTrader 5 platforms

Schedule for trading on Currency pairs
  • 15 April 2022 - trading stops at 7:40 PM server time
  • 18 April 2022 - trading as usual
Schedule for trading on CFDs on the US indices (US30Cash, US500Cash, USTECHCash) and the Japanese index JP225Cash
  • 15 April 2022 - no trading
  • 18 April 2022 - trading as usual
Schedule for trading on CFD on the German index DE40Cash
  • 15 April 2022 - no trading
  • 18 April 2022 - no trading
  • 19 April 2022 - trading as usual
Schedule for trading on Metals (XAUUSD, XAGUSD) and CFDs on oil (Brent, WTI)
  • 15 April 2022 - no trading
  • 18 April 2022 - trading as usual
Schedule for trading on CFDs on US stocks
  • 15 April 2022 - no trading
  • 18 April 2022 - trading as usual
R StocksTrader platform

Schedule for trading on Currency pairs
  • 15 April 2022 - trading stops at 7:40 PM server time
  • 18 April 2022 - trading as usual
Schedule for trading on US stocks and ETFs, CFDs on US stocks and ETFs
  • 15 April 2022 - no trading
  • 18 April 2022 - trading as usual
Schedule for trading on CFDs on US indices (US500, US30, NAS100)
  • 15 April 2022 - no trading
  • 18 April 2022 - trading as usual
Schedule for trading on CFDs on EU and UK indices (GER30, UK100, FRA40, SPA35), Australian index AUS200 and Japanese index J225
  • 15 April 2022 - no trading
  • 18 April 2022 - no trading
  • 19 April 2022 - trading as usual
Schedule for trading on CFDs on EU and UK stocks (except Danish, Norwegian, and Swedish stocks)
  • 15 April 2022 - no trading
  • 18 April 2022 - no trading
  • 19 April 2022 - trading as usual
Schedule for trading on CFDs on Danish, Norwegian and Swedish stocks
  • 13 April 2022 - no trading
  • 14 April 2022 - no trading
  • 15 April 2022 - no trading
  • 18 April 2022 - no trading
  • 19 April 2022 - trading as usual
Schedule for trading on Metals (XAUUSD, XAGUSD) and CFDs on Crude Oil (BRENT.oil, WTI.oil)
  • 15 April 2022 - no trading
  • 18 April 2022 - trading as usual
cTrader platform

Schedule for trading on Currency pairs
  • 15 April 2022 - trading stops at 7:40 PM server time
  • 18 April 2022 - trading as usual
Schedule for trading on Metals (XAUUSD, XAGUSD)
  • 15 April 2022 - no trading
  • 18 April 2022 - trading as usual
Please take note of the above trading schedule changes when planning your trading activity.

Sincerely,
RoboForex team
 
RoboForex adds 7 new cryptocurrencies

rf-crypto-banner-news.jpg


Dear Clients and Partners,

RoboForex now offers 7 new cryptocurrencies to invest in: ALGOUSD, AVAXUSD, BNBUSD, LUNAUSD, MANAUSD, MATICUSD and UNIUSD. All these pairs are already available on the MetaTrader 4, MetaTrader 5, and R StocksTrader platforms.

Investing in Cryptocurrencies with RoboForex means:

  • 24/7 access to more than 30 crypto instruments
    BTC, ETH, BNB, LTC, BCH, LUNA, XRP, and others.

  • A single account for all investments
    You won’t need another wallet or account at a crypto exchange.

  • Conditions at the level of crypto exchanges
    The commission for cryptocurrencies on Prime accounts is 0.1%.
Cryptocurrencies are a promising investment trend, which is chosen by a lot of clients at RoboForex. Therefore, we plan to continue adding new crypto instruments to our existing list and enhancing investment conditions.


Sincerely,
RoboForex team
 
Dear traders!

This week, the RoboForex company's project called ContestFX is waiting for everyone to participate in the following competitions on demo accounts:

The 133rd competition of "Demo Forex" has gained "full speed".
The 357th competition of "Week with CFD" has just started.
491st competition of "Trade Day" will start on 20.04.2022 at 12:00 at 12:00.
405th competition of "KingSize MT5" will start on 21.04.2022 at 20:00.

To become a participant in our competitions, you need to go through a simple registration procedure just once - it will open access to participation in any of the competitions in just a couple of mouse clicks.

We're looking forward to your joining in and wish you good luck!

Sincerely,
RoboForex Contest
 
How to Trade Three Line Strike Candlestick Pattern

Author: Victor Gryazin

10.jpg


Dear Clients and Partners,

This article is devoted to a candlestick pattern called Three Line Strike, its type, forming principles, and use in trading.

How Three Line Strike forms

The Three Line Strike candlestick pattern is not a frequent guest on price charts. It appears at the local high/low in an uptrend/a downtrend.

The pattern consists of four candlesticks: the first three candlesticks have medium-sized bodies and the same colour, while the fourth one has a different colour, demonstrating a reversal, and a big body that fully covers the bodies of the first three candlesticks.

Some sources describe this one as a trend continuation pattern, but the logics of candlestick analysis suggest that this is a reversal one.

This article is based on the approach of a famous trader Thomas Bulkowski and his book “Encyclopedia of Candlestick Charts”. He considers this pattern to be a reversal pattern: according to his research, the price has a 84% probability of a reversal after this pattern appears on the chart.

When the pattern appears on the chart, this means the current trend is getting weaker as it has encountered strong opposition. The large reversal candlestick that with its body covers up the three preceding candlesticks forecasts a correction that can later turn into a real reversal.

Types of Three Line Strike

Depending on the place where the pattern appears and the colors of its candlesticks, two types of the Three Lines Strike can be singled out – the bullish and bearish ones.

Bullish Three Lines Strike

It forms after an ascending price movement at the local highs of the chart. It consists of three white candlesticks with middle-sized bodies and a large black candlestick, whose bode covers all the three preceding ones.

The large black candlesticks means that bears have captured the initiative and are ready to counterattack. Further decline of the quotes means the beginning of a descending correction. The decline should be confirmed by the price falling below the last low of the bearish candlestick of the pattern.
3strike-bullish.png


Bearish Three Line Strike

It appears in a descending movement at the local lows of the chart. It consists of three black bearish candlesticks with medium-sized bodies and one white large candlestick, whose body covers up the bodies of the three preceding candlesticks.

The large white candlestick means that bulls have managed to stop bears and are ready to reverse the quotes. Further growth of the price leads to the beginning of an ascending correction. The ascending movement should be confirmed by growth of the quotes above the high of the last white candlestick.

3strike-bearish.png


Bottom line

The Three Lines Strike pattern forms after a descending or an ascending movement and forecasts a reversal of the quotes. In certain sources, this pattern is considered a trend continuation pattern, yet Thomas Bulkowsli in his research has demonstrated that the probability of a reversal after this pattern appears is 84%.

The pattern can be used for trading either on itself or alongside other instruments of tech analysis and indicators. Before using the Three Lines Strike for real, make sure you back-test it.

Read more at R Blog - RoboForex

Sincerely,
RoboForex team
 
Richard Wycoff Trading Method

Author: Timofey Zuev

1.jpg


Dear Clients and Partners,

As trading kept developing, various methods and instruments for it also got to perfection. And today, when humanity is enjoying the internet, trading has become available to anyone, even if they do not have money. However, getting started is the hardest part for any beginner.

Why so? The internet is full of methods, ways, strategies, indicators, and advisors that, unfortunately, do not always work properly. So, the beginner gets lost in the variety of methods and trading strategies, for getting about the basics that trading is based on.

The Wycoff method used to be popular in the times of the trader himself because it was "different". Richard Wycoff never listened to analysts, experts, economists, and the like because at that time analysis was based on bare charts, nothing else. Wycoff, nonetheless, was sure that the price was moved by all market participants, so the future of the price was "in people's minds".

According to Wycoff, the trader must be some sort of a detective and calculate, based on the chart and volumes, who is controlling the market (the bulls or bears), after which they could attack this or that instrument. Psychology also plays its part here: for people, it is much easier to do their job when they are interested. And when the job becomes mere routine, people lose grip, so their productivity suffers

This approach made the Wycoff method popular nowadays, though no one apparently uses it "in the virgin form". However, many methods used by professional traders all over the world are based on Wycoff's system. It is applicable to all trading instruments: stocks, currencies, options, futures, etc. As for timeframes, the method is very good for intraday traders.

Main principle of the Wycoff trading method

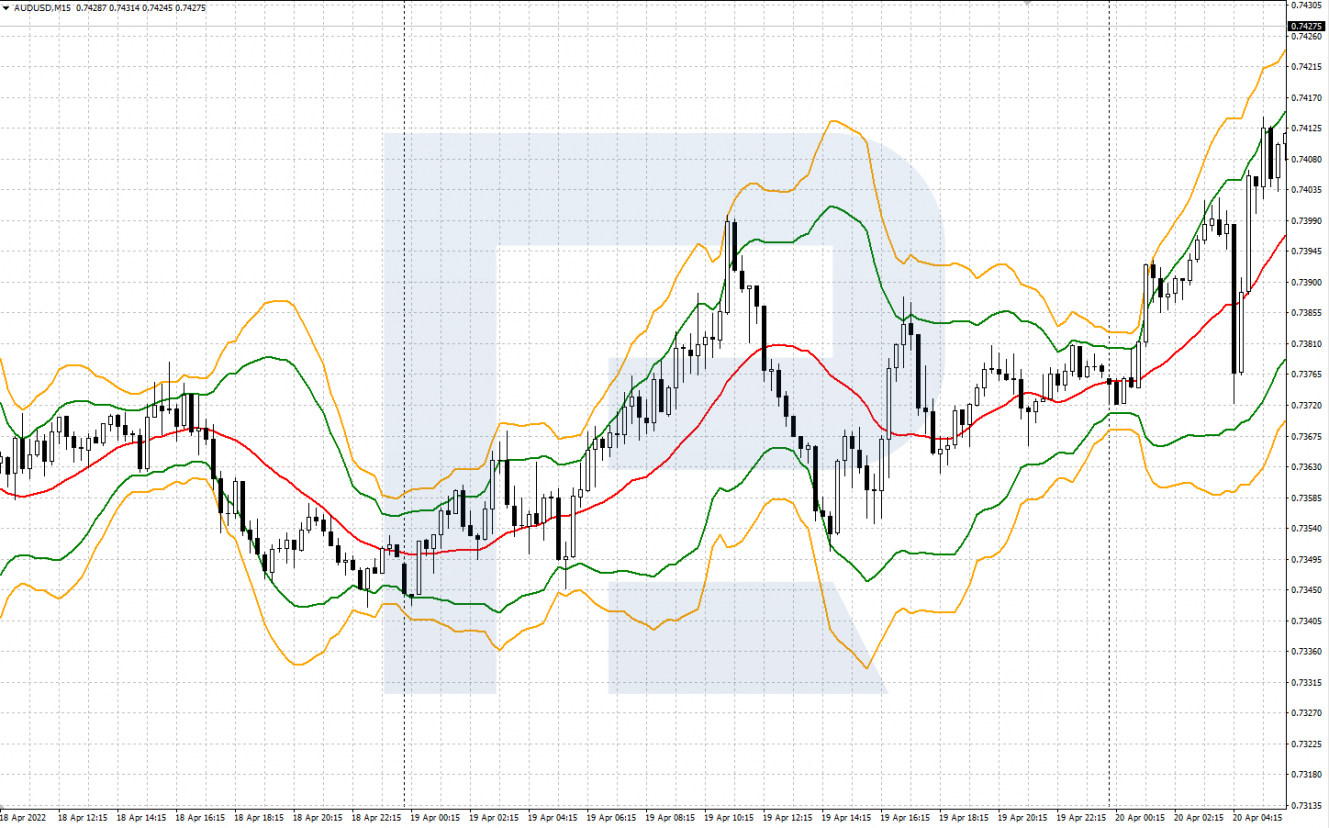
The main task of the trader is to make conclusions about how their trading instrument (stocks, option, currency) will behave in the fight of demand and supply. To do it, the price chart and volumes are quite enough.

Then the trader finds possible tops (for a bullish trend) and bottoms (for a bearish trend). Also, make notice of correctional price movements because trading consists of certain cycles of purchases and sales. One cycle (wave) will last while new participants join in. As soon as the cycle is worn out, a reverse process starts, and the price goes in the opposite direction. All this can be seen on the chart.

As the creator of the method used to say, if you master it once, you will need a few minutes to make a forecast of future price movements.

You can find more about the system in a book by J.Hutson "The Wycoff Method". It is available on the internet.

Read more at R Blog - RoboForex

Sincerely,
RoboForex team
 
Dear traders!

This week, the ContestFX project invites you to the following exciting competitions:

The 133rd competition of "Demo Forex" has reached the "finish line".
The 358th competition of "Week with CFD" has kicked off today.
492nd competition of "Trade Day" will start on 27.04.2022 at 12:00.
406th competition of "KingSize MT5" will start on 28.04.2022 at 20:00.

We remind you that all winners of our demo competitions receive funds to their real trading accounts and can use them to make deals in the Forex market without investing their own money.

Good luck to all traders!

Sincerely,
RoboForex Contest
 
Investor Risk Profile: What It Is and How to Determine It

Author: Maks Artemov

11-1536x662.jpg


Dear Clients and Partners,

Work in financial markets and investing have always been associated with risks. Every investor should keep in mind that they might not only gain but also lose due to price declines and irreparable losses.

Before beginning to invest, decide for yourself what risks you are ready for on the way to your goal. This article is devoted to the risk profile of an investor and controlling risks and losses.

What risk and risk profile are

Risk is the possibility of partially or completely losing your investments. The main task of each investor is to decrease risks and limit possible losses by any acceptable level.

Risk profile, or investment profile is the individual attitude of the investor to possible risks in his work.

Types of risk profile

An investment profile depends on the personality of the investor, the aims and length of investing. In trading and investing, there are three types of risk profile: conservative, moderate, and aggressive.

Conservative risk profile

This approach suggests that the investor is not ready for big risks and agrees on a minimal profit from ivesting. Their goal is to make a profit that will compensate for inflation and this save their capital.

As a rule, a conservative investor has a calm, balanced character and analytical mind. They take any losses very seriously and avoid unnecessary risks. Their approach to choosing instruments is scrupulous and takes time.

Moderate risk profile

By this approach, the investor assumes certain risks to increase profitability. Current minor losses are considered normal and can be withstood for the sake of better perspectives.

Low profitability does not satisfy the investor, so they look for the ways to improve it, disregarding higher than conservative risks.

Aggressive risk profile

Aggressive approach is good for risky people. They are ready to suffer serious controlled losses to get super profits fast.

In other life spheres, such people are also prone to risks and making fast decisions. Such investors have well-trained and developed intuition. Losing a part of their capital is a normal part of work for them and does not influence their future investment projects. The main goal of risky investors is highly risky assets that yield impressive revenue.

How to determine investor risk profile

The main goal of determining a risk profile is checking whether a future investor is prone to risks. If they are ready for all sorts of risks having no experience, this might be a real problem. Fast loss of the capital might undermine their future investment process.

There exist special tests for determining investor risk profiles. One should answer the questions based on their emotions and experience. It is vital to be honest because this is the only way to select your best investment strategy.

Read more at R Blog - RoboForex

Sincerely,
RoboForex team
 
How to Trade by One-Two Strategy

Author: Victor Gryazin

15-1536x662.jpg


Dear Clients and Partners,

This article describes a plain short-term trading strategy based on the signals of the popular Bollinger Bands trend indicator. The article deals with the peculiarities of the strategy, its use in trading, and examples of buying and selling.

What one needs to know about One-Two

One-Two is a type of reversal trading systems based on Bollinger Bands signals. The strategy is easy to master and uses just one tech indicator with altered parameters. Note that it is a default indicator in almost all trading terminals, including MT4 and MT5.

The trading approach is based on using bounces of the quotes off the outer borders of the Bollinger Bands channel that act as dynamic support and resistance levels. After a bounce, the price is expected to return to the middle line of the channel.

Which instruments, time frames, and indicators can be used

For trading by the strategy, you can use currency pairs, oil, gold, and other commodities. Recommended TFs are M15, M30, H1, H4, and D1.

Indicators:

Bollinger Bands (Period 20, Shift 0, Deviation 2) — green lines on the chart.
Bollinger Bands (Period 20, Shift 0, Deviation 3) — orange lines on the chart.

1and2-1-1329x828.png


How to buy by One-Two

Conditions of opening a buying position are as follows:
  1. Wait for the price to get between the lower green and orange indicator lines. Mark this candlestick as 0
  2. Wait for two more candlesticks to form. If they show a reversal upwards with close prices no lower than those of candlestick 0 — open a buying trade after candlestick 2 closes. Candlesticks 1 and 2 have white bodies, or the first one is a Doji and the second one has a white body.
  3. Place a Stop Loss 5 points below the lows of candlesticks 1 and 2.
  4. Take the Profit as soon as the quotes reach the middle line (red colour) of Bollinger Bands. Or, if the movement is strong, you can take the SL to the breakeven when the price reaches the middle line and wait for the quotes to grow to the upper green line of the indicator channel.
Closing thoughts

The One-Two trading strategy is based on the signals of a popular trend indicator Bollinger Bands with different parameters. The strategy is based on reversals of the quotes from the borders of the price channel that are used as dynamic support/resistance levels.

This strategy is rather universal and can be used for various instruments and on various TFs. Before trading for real, practising on a demo account is strongly recommended.

Read more at R Blog - RoboForex

Sincerely,
RoboForex team
 
Back
Top