Vlad RF
RoboForex Representative
- Messages
- 487
How to Trade the Bat Pattern

Dear Clients and Partners,
In this review we will get acquainted with the popular harmonic pattern "Bat". We will learn how to find it on the price chart and what trading signals it gives. We will consider the rules and examples of its formation.
Description of the “Bat” pattern
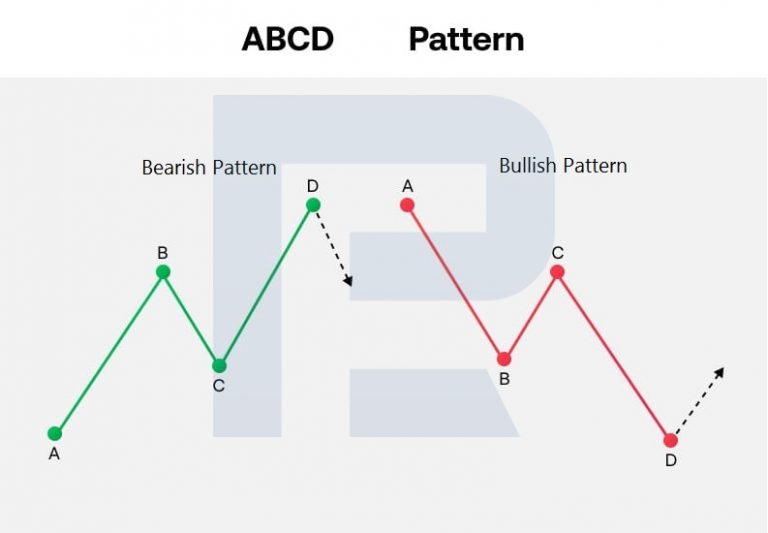
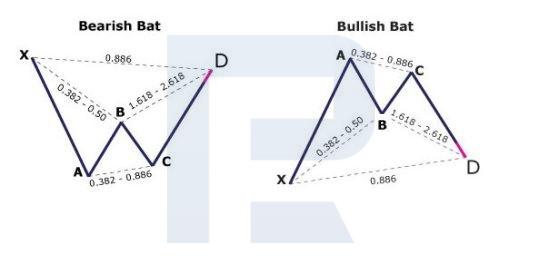
The harmonic Bat pattern is a 5-point graphical pattern formed by taking into account certain Fibonacci ratios. It was introduced by Scott Carney in 2001. The figure has a similar structure to the Gartley's Butterfly, but they differ in Fibonacci ratios.
It has five points (X, A, B, C and D) and four price swings (XA, AB, BC and CD). The last point in the pattern is D, which is a potential reversal zone. Its appearance is seen as a signal to open buy or sell positions.
This chart pattern is formed on a variety of timeframes. Often it represents a correction area, after the end of which the preceding trend is likely to continue. For more reliable signals, this pattern can be used in conjunction with classic means of technical analysis - trend lines, support and resistance levels.
Rules for shaping the “Bat” pattern
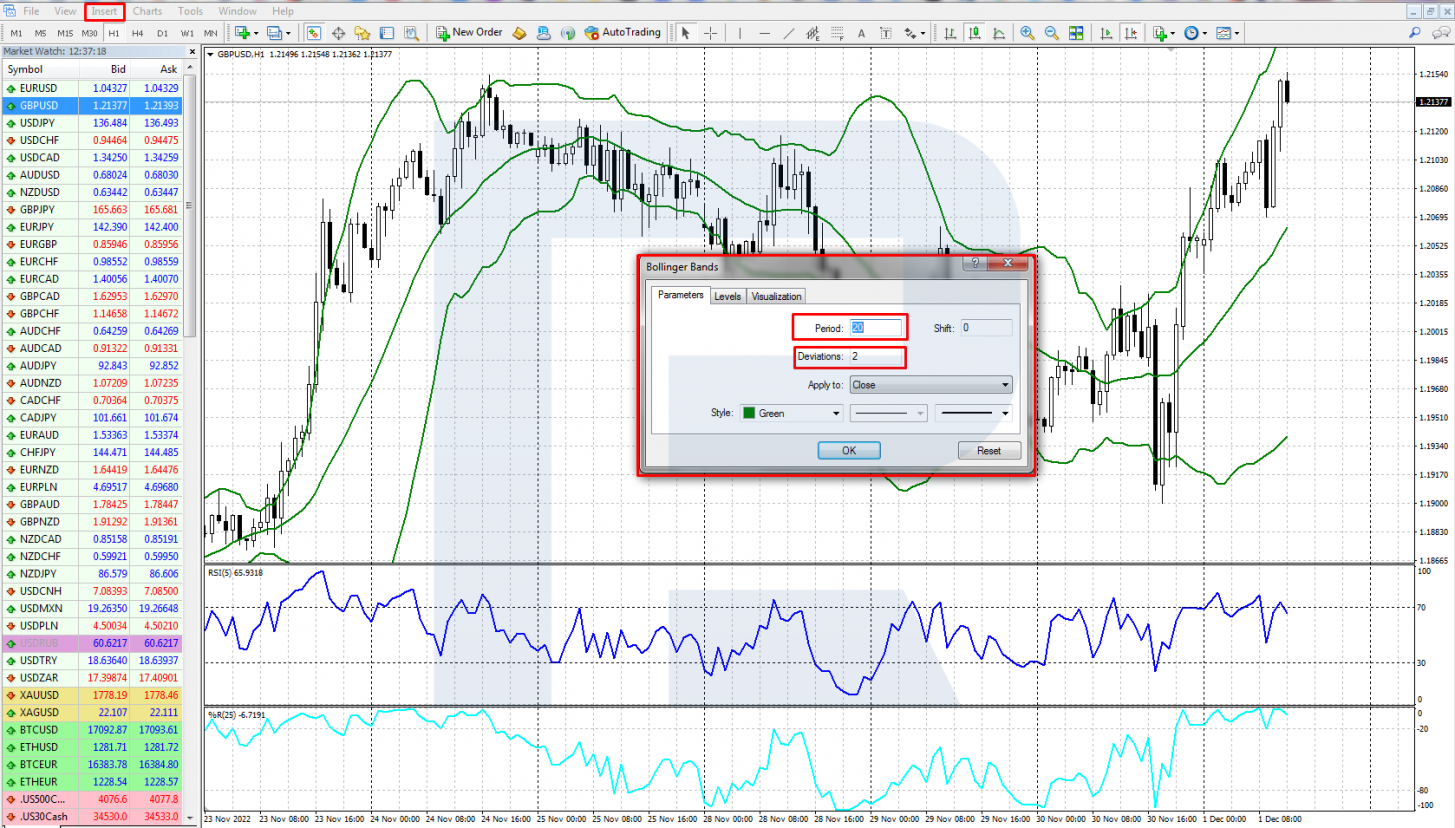
Like many other harmonic patterns, the Bat is defined by Fibonacci ratios. There are automated ways to find this pattern on the chart - special indicators. But you can also determine it yourself, knowing the rules of formation:
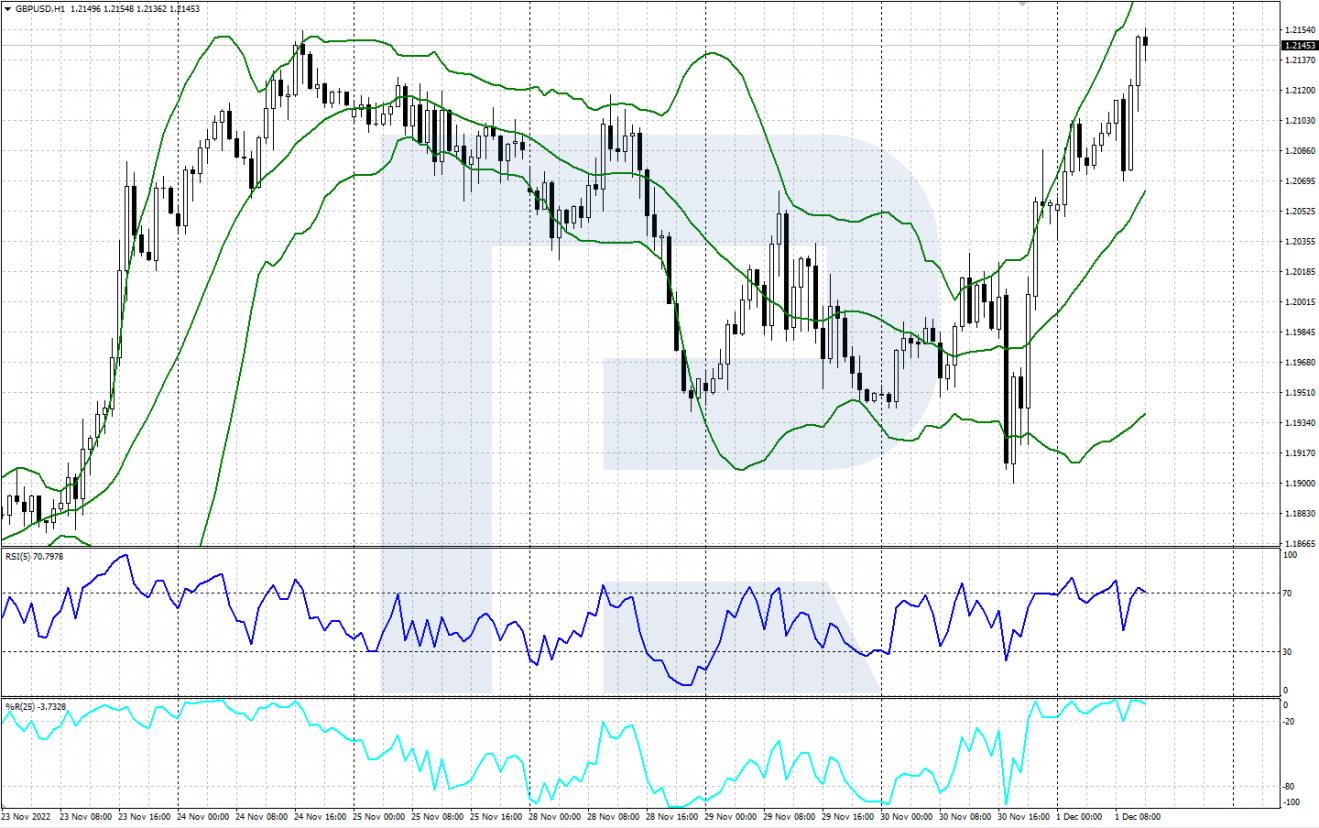
Example of bullish trading in the Bat pattern
A pattern has formed on the H1 chart of the GBP/USD currency pair. After the start of the upward movement from point D, a buy position can be opened. Stop Loss is placed just below point X, profit taking targets are points A, B, C and higher if there is a strong upward movement.
Read more at R Blog - RoboForex
Sincerely,
RoboForex team
Dear Clients and Partners,
In this review we will get acquainted with the popular harmonic pattern "Bat". We will learn how to find it on the price chart and what trading signals it gives. We will consider the rules and examples of its formation.
Description of the “Bat” pattern
The harmonic Bat pattern is a 5-point graphical pattern formed by taking into account certain Fibonacci ratios. It was introduced by Scott Carney in 2001. The figure has a similar structure to the Gartley's Butterfly, but they differ in Fibonacci ratios.
It has five points (X, A, B, C and D) and four price swings (XA, AB, BC and CD). The last point in the pattern is D, which is a potential reversal zone. Its appearance is seen as a signal to open buy or sell positions.
This chart pattern is formed on a variety of timeframes. Often it represents a correction area, after the end of which the preceding trend is likely to continue. For more reliable signals, this pattern can be used in conjunction with classic means of technical analysis - trend lines, support and resistance levels.
Rules for shaping the “Bat” pattern
Like many other harmonic patterns, the Bat is defined by Fibonacci ratios. There are automated ways to find this pattern on the chart - special indicators. But you can also determine it yourself, knowing the rules of formation:
- XA is the first impulse of the price movement on the chart.
- AB - correction from the first XA movement, ranging from 38.2% to 50%.
- BC - can range from 38.2% to 88.6% of the wavelength of AB.
- CD, the final wave, is an extension of 161.8% to 261.8% of the BC section and ends at about the 88.6% correction level of the XA wave.
- The emergence of the D-point is the final stage of formation.
- Wave XA is formed as a result of an upward price impulse.
- The price then reverses in AB and corrects from 38.2% to 50% of the XA segment.
- On the BC section, price reverses again and rises to 38.2-88.6% of the AB wave.
- In the final CD phase, the price reverses downwards and reaches approximately 88.6% of the first XA impulse.
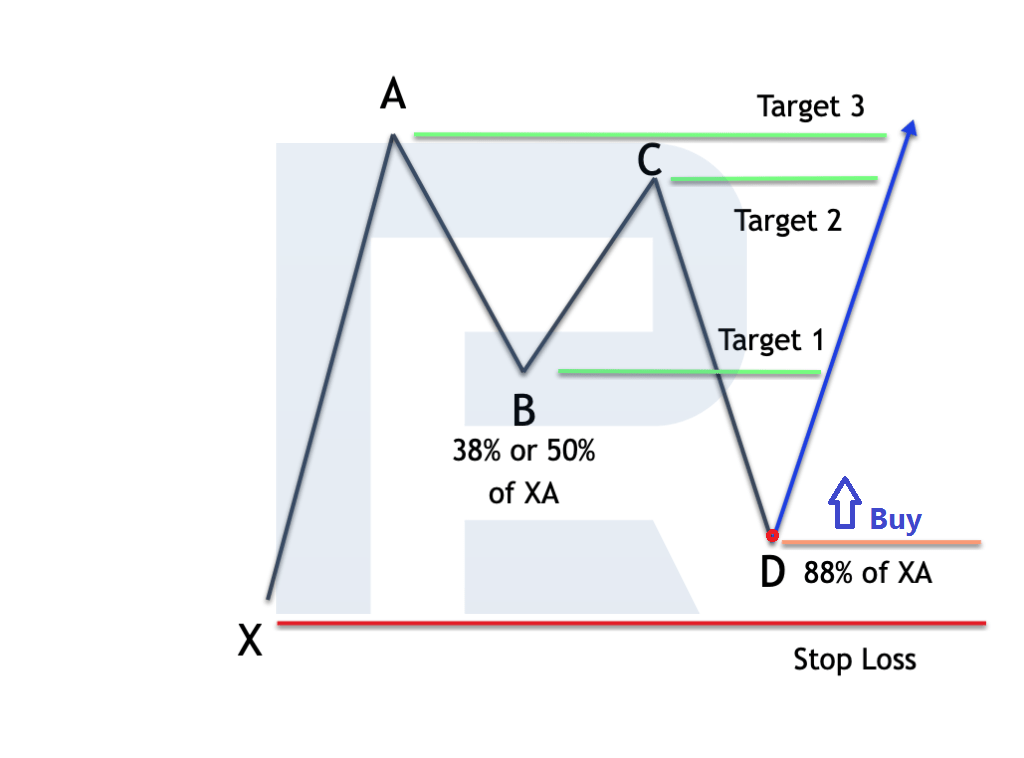
- After the formation of the pattern, quotes are expected to rise from point D.
- A buy position can be opened once the D-point has been formed and quotations have started to reverse upwards.
- The Stop Loss should be placed just below the pattern low at point X.
- The Take Profit can be based on the B point, the C point or the maximum value of the pattern at the A point.
Example of bullish trading in the Bat pattern
A pattern has formed on the H1 chart of the GBP/USD currency pair. After the start of the upward movement from point D, a buy position can be opened. Stop Loss is placed just below point X, profit taking targets are points A, B, C and higher if there is a strong upward movement.
Read more at R Blog - RoboForex
Sincerely,
RoboForex team