• Please try to select the correct prefix when making a new thread in this folder.

    Discuss is for general discussions of a financial company or issues related to companies.

    Info is for things like "Has anyone heard of Company X?" or "Is Company X legit or not?"

    Compare is for things like "Which of these 2 (or more) companies is best?"

    Searching is for things like "Help me pick a broker" or "What's the best VPS out there for trading?"

    Problem is for reporting an issue with a company. Please don't just scream "CompanyX is a scam!" It is much more useful to say "I can't withdraw my money from Company X" or "Company Y is not honoring their refund guarantee" in the subject line.
    Keep Problem discussions civil and lay out the facts of your case. Your goal should be to get your problem resolved or reported to the regulators, not to see how many insults you can put into the thread.

    More info coming soon.

Discuss RoboForex.com

General discussions of a financial company
How and Why the US Government is Promoting Green Energy

Author : Eugene Savitsky

25.01.2023-1536x662.jpg


Dear Clients and Partners,

Today we will talk about the government's economic stimulus packages for clean energy in the US. We will look at the American Recovery and Reinvestment Act signed by Barack Obama in 2009, and the Inflation Reduction Act signed by Joe Biden in 2022. Let's analyse the impact of these laws on the development of green energy in the US.

America’s Recovery and Reinvestment Act

The US economy was harmed by the financial crisis in 2008. By 2009, unemployment had reached 10.2%, which marked the highest level in 25 years. The US government needed to take urgent measures to jumpstart the economy and create new jobs. In response to the 2008 Great Recession, the American Recovery and Reinvestment Act (ARRA) of 2009 was drafted and passed by the US Congress.

This act provided for investments of 90 billion USD in clean energy. At that time, this was the largest investment in the energy sector in the history of the United States. This economic stimulus package laid the foundation for dramatic changes in the energy system, such as massive electrification of land transport and an increase in the amount of energy from renewable sources.

Electrification of the automotive industry

In 2008, Elon Musk's Space Exploration Technologies Corporation (SpaceX) and Tesla Inc. (NASDAQ: TSLA), which were on the verge of bankruptcy, were rescued by NASA contracts. In 2010, the US Department of Energy granted Tesla Inc. a USD 465 million loan to back it up.

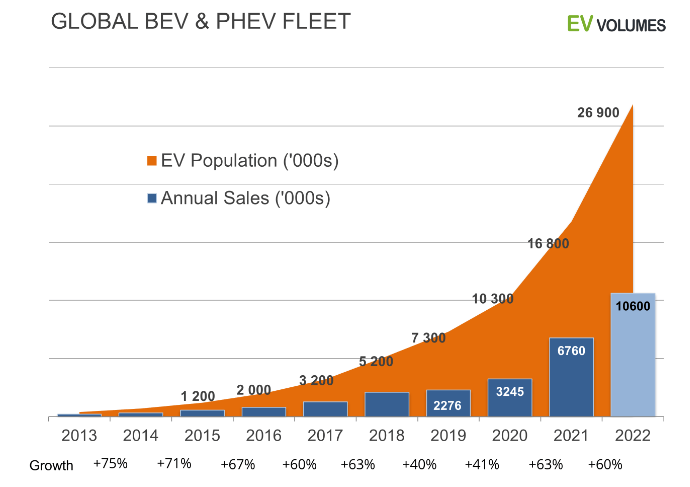
It can be assumed that the active development and growth of this car company have triggered accelerated electrification of the global car industry. Many manufacturers have supplemented their model ranges with electric and hybrid cars. According to EV-Volumes, the number of environmentally friendly cars on the road has increased from a few hundred thousand to nearly 27 million units over the past ten years.

EV.png


In 2010, Tesla Inc. was the only publicly traded company in the US that focused exclusively on electric vehicles. The return on investment in this corporation by 2020, before the COVID-19 pandemic-induced crisis, exceeded 5500%.

Promoting alternative energy sources

According to the Energy Information Administration (EIA), from 2011 to 2021 inclusive, wind power generation increased by more than 200% to 132,753 MW. Solar power generation increased 88-fold to 93,151 MW. In addition, solar photovoltaic modules, which are capable of producing 1 W of energy, have fallen in price from USD 2.15 to USD 0.27.

At the time of writing, the largest US solar energy companies by market capitalisation were Enphase Energy Inc (NASDAQ: ENPH), First Solar Inc (NASDAQ: FSLR), and Sunrun Inc (NASDAQ: RUN). They were valued at USD 33.4 billion, USD 18.7 billion, and USD 5.9 billion, respectively.

With energy-saving technology becoming widespread, the classification of household appliances according to their energy efficiency level has emerged. Fluorescent lamps, which were previously used mainly in industrial plants, were introduced for home use. Moreover, less efficient and more energy-intensive incandescent lamps were gradually replaced by more economical LED lamps.

Why a law to reduce inflation was passed

The situation in the US today is very different from what it was after the 2008 crisis: unemployment is at a low level and inflation is in positive territory – there was deflation in 2009. However, the government was now facing a new challenge: the likelihood of continued high inflation.

This has been facilitated by reduced investment in conventional energy sources, which has led to a reduction in hydrocarbon production and a substantial rise in the cost of hydrocarbons. With hydrocarbons being used to generate electricity and transport products and components, their cost constitutes a significant part of the cost of many products.

Read more at R Blog - RoboForex

Sincerely,
RoboForex team
 
Dear traders!

This week, the ContestFX project, as usual, continues with the following competitions:

The 142nd competition of "Demo Forex" is approaching its end.
The 398th competition of "Week with CFD" has kicked off today.
The 532nd competition of "Trade Day" will start on 01.02.2023 at 12:00.
The 446th competition of "KingSize MT5" will start on 02.02.2023 at 20:00.

We remind you that all winners of our contests receive prize funds to their real accounts, and they can use them to trade on the Forex market instead of investing their own savings as the initial deposit.

If you want to be one of the winners, don't miss your chance!

Sincerely,
RoboForex Contest
 
How to Trade the "Day Movement" Strategy

Author : Victor Gryazin

27.01.2023-1536x662.jpg


Dear Clients and Partners,

In this review, we will look at the short-term strategy "Day Movement". It is based on identifying and trading a sideways price range (flat) formed before the start of the European trading session.

Description of the “Day Movement” strategy

The "Day Movement" strategy is based solely on technical analysis – it does not use any additional indicators. The main prerequisite for trading this strategy is the presence of a flat. The flat is a sideways price movement without a strict upward or downward direction. Local maximums and minimums of price fluctuations are located at approximately the same level, and quotes move within a limited range.

According to the rules of this strategy, it is necessary to wait for a sideways range to form on the chart before the start of the European session. The time of formation of the range is from 18:00 server time (GMT+2) on the previous day to 08:00 am on the current day. If the range is formed, two pending buy and sell orders are placed: Buy Stop and Sell Stop, 10 points above and below the limits of this channel, respectively.

In pending orders, it is possible to set Stop Loss and Take Profit values immediately or do this immediately after opening a position. The Stop Loss level for a pending buy order (Buy Stop) is set just below the bottom line of the price channel. The Stop Loss level for the order to sell (Sell Stop) is established a bit higher than the upper line of the side channel. The Take Profit is set twice as high as the distance to Stop Loss, but no more than 100 points.

If the price has not reached any of the pending orders by 15:00 (GMT+2), they should be deleted, or the expiry time should be set when the order is initially placed. The strategy applies to currency pairs such as EUR/USD, GBP/USD, and AUD/USD. The recommended time frame is H1. If the market is currently experiencing a strong trending movement, then this strategy should only be used in the direction of the trend.

How to buy using the “Day Movement” strategy

The conditions for opening a buy position:
  1. A local sideways range (flat) should form on the H1 chart of the currency pair EUR/USD, GBP/USD, and AUD/USD. The time of its formation is 18:00-08:00 (GMT+2).
  2. A pending Buy Stop order is placed 10 points above the top of the range.
  3. The Stop Loss limit is set beyond the lower limit of the sideways corridor, and the Take Profit is set at twice the Stop Loss value.
  4. If the price has not reached the Buy Stop order by 15:00 (GMT+2), it should be deleted or originally set for expiration at this time.
An example of buying by strategy
  • On the H1 time frame of the currency pair GBP/USD, a sideways price corridor was formed between 18:00-08:00 (GMT+2) within the time frame set by the strategy, with the boundaries of 1.2253-1.2290
  • A pending Buy Stop order is set 10 points above the top of the price range at 1.2300
  • During the European session, quotations rise, breaching the upper limit of the range. A Buy Stop order is activated, and a buy position is opened. Stop Loss is placed beyond the lower limit of the range, and Take Profit is set at twice the Stop Loss.
DayMovement-2-1376x828.png


How to sell using the “Day Movement” strategy

The conditions for opening a sell position:
  1. On the H1 chart of the currency pair EUR/USD, GBP/USD, AUD/USD should form a local sideways range (flat). The time of its formation is 18:00-8:00 (GMT+2).
  2. A pending Sell Stop sell order is placed 10 points below the lower limit of the range.
Read more at R Blog - RoboForex

Sincerely,
RoboForex team
 
Situational Vs. Systematic Trading: Which One is More Efficient?

Author : Andrey Goilov

systematic-sitiational-trading.png


Dear Clients and Partners,

To be successful on financial markets, you need a neat trading system that will give you a clear understanding of how to enter and exit the market either with a profit or a loss. The rules of money management are also worth sticking to as they will psychologically prepare you for a series of losing trades as well as profitable ones.

Trading with a high-quality system is different from trading without one is also better in the sense that you do not need to think about whether the situation on the market is good enough to enter. You simply follow the rules and open or close trades, moving along the price chart.

Unfortunately, no one can tell if the current pattern will be executed or you will have to close it at the Stop Loss. To find out, you just have to trade the chosen method. Of course, you can use certain lifehacks and take measures to increase the probability of the execution of the signal, such as trading on a demo account until you receive two losing positions and only then moving to a real one. There are plenty of ways and methods of trading in the world, and every day millions of traders try to conquer the market.

In this article, we shall have a look at the pros and cons of both systematic and situational trading, discuss their differences, and speak about the practicability of each of them.

Systematic trading

Here, we are talking about a simple indicator-based system that will give the same signals to a dozen of different traders. As a rule, systematic trading does not allow for more than one opinion about the current market situation; the trader just needs to open a position and wait or to wait for a signal to enter the market.

In one of our posts, we spoke about the Ichimoku indicator. At first glance, it seems too complicated, but it boils down to trading the trend and waiting for the entrance signal to form. After that, we open a position and wait for the signals to form. For example, if the price breaks through the Ichimoku Cloud bottom-up, then you can buy.

ichimoku-flat-trend.png


If the price breaks through the Cloud top-down, the trend is likely to be descending, so you can sell. You do not need much time to make a decision, following the rules is enough.

Sure, in the times of a flat, you will be getting the breakaways all the time and either be opening and closing too many positions bringing no profit or suffering a series of insignificant losses. However, as soon as a trend begins, the market will be bringing the prices farther and farther from the entrance point. In such a case, you simply need to move the SL and hold the profit until the market reverses and closes your position.

Pros of trading along with the rules

It can often be heard that a good system is no more than 20% of success on the market while the remaining 80% is the ability to follow the rules of money management and stick to your own rules in the hard times, which will happen periodically.

As Victor Niederhoffer used to say: "In investments, as well as in life, the question is not whether you will be knocked down but when it will happen and whether you will manage to get up and keep fighting. The risk of failure is an essential part of human experience which is especially visible on financial markets dominated by speculation, which is the readiness to accept commercial risks".

A huge advantage of such an approach is the easiness of market analysis and decision-making. The lines have crossed — we sell, the lines have crossed back — we close the position and open a new one. If we hand the method to other traders, they will see the same crossings and will sell the same way due to the signal lines crossing. What is more, the trader feels less emotional pressure as he leaves decision-making to the system.

A drawback here is the behavior of the system in a flat. In such a situation, the prices remain in place, while the trader receives signals both to buy and to sell, constantly locking in losing positions.

Situational trading

This approach to trading and market analysis is different from the systematic one. In most cases, situational trading is graphic analysis where traders look for various patterns, such being, for example, Head and Shoulders, the Wolfe Waves, or any other pattern of technical analysis.

The difficult part here is that on D1 the Head and Shoulders pattern may be inversed, while on H1 it may be normal, and this is perplexing. What is more, if other graphic traders look at the very same chart, in the same lines they might see a Triangle or any other pattern, or simply say that it is not worth entering against the trend here.

Read more at R Blog - RoboForex

Sincerely,
RoboForex team
 
Dear traders!

This week, the CopyFX project by RoboForex' invites you to take part in the following competitions:

The 143rd competition of "Demo Forex" and 399th competition of "Week with CFD" have just started.
The 533rd competition of "Trade Day" begins on 08.02.2023 at 12:00.
The 447th competition of "KingSize MT5" will start on 09.02.2023 at 20:00.

If you are visiting our website for the first time and want to become a participant of our demo competitions, you just need to create an account and upon completing a simple registration procedure you can participate in any of the contests you like with just a couple of mouse clicks.

We invite everyone to our contests and wish you all good luck!

Sincerely,
RoboForex Contest
 
How To Trade the Abandoned Baby Pattern

Author : Victor Gryazin

03.01.2023-1536x662.jpg


Dear Clients and Partners,

In this review, we will get acquainted with the candlestick analysis strong reversal pattern "Abandoned Baby". Let's look at the features of its formation, and the trading techniques for this pattern.

How the “Abandoned Baby” pattern is formed

The Abandoned Baby candlestick pattern is a rare, strong reversal pattern that forms on the local highs and lows of the price chart. It consists of three candlesticks. The first one has a normal body, and the second one is a doji candle (it has practically no body, the open and close prices being almost the same). The third one closes in the opposite direction to the first candlestick. The second candlestick should have gaps (price gaps) on both sides.

As noted by the guru of candlestick analysis Steve Nison, the appearance of a doji after a strong white candlestick indicates the current overbought state of the financial instrument. And vice versa: the appearance of a doji after a black candlestick indicates an oversold condition of the asset. In the "Abandoned Baby" pattern, a doji opens with a gap from the first candlestick, followed by a gap in the opposite direction, with the third candlestick closing thereafter to confirm the reversal.

"Abandoned Baby" is very similar to "Morning Star" and "Evening Star" in its formation principle, but differs in the appearance of a doji candlestick with a gap on both sides. "Morning Star" and "Evening Star" do not require the average candlestick to be a doji or have gaps on both sides, so they are much more common on price charts.

“Bullish” pattern “Abandoned baby”

This is formed during a downtrend, at the lows of the price chart. The first black candlestick appears first. Against the backdrop of negative market sentiment, the next trading session opens with a gap down, but the "bears" do not succeed, and a doji appears on the chart. Seeing the weakness of the sellers, the bulls seize the initiative: the third candlestick opens with a gap up and closes with a confident white body.

A bullish "Abandoned Baby" reversal pattern forms on the chart as a result. Buyers have managed to seize the initiative, and are ready to keep pushing the price up. If the "bears" fail to close the gaps and drop the quotations below the doji low, the "bulls" are likely to go on the offensive and initiate an upward correction or even a trend reversal.

How to buy on the bullish “Abandoned Baby” pattern
  • During a downtrend, a bullish "Abandoned Baby" pattern appears on the local lows of the price chart
  • It is advisable to open a buy position when the price rises above the maximum of the third white candlestick in the pattern. Stop Loss is set at the doji low
  • To set Take Profit, you can be guided by Fibonacci retracement levels from the previous downtrend, significant support, and resistance levels
AbandonedBaby-3-1372x828.png


How to sell on the bearish “Abandoned Baby” pattern
  • During the upward trend, a bearish "Abandoned Baby" pattern is formed at the local highs on the price chart.
  • A sell position can be opened after the price decreases below the third black candlestick in the pattern. Stop Loss is set at the doji's maximum.
Read more at R Blog - RoboForex

Sincerely,
RoboForex team
 
How to Choose a Timeframe for Trading?

Author : Victor Gryazin

timeframe.jpg


Dear Clients and Partners,

In this review, we will speak about choosing a timeframe for trading. This is an important part of your trading strategy.

What is a timeframe?

A timeframe is a time interval for representing the quotations on the chart. As a rule, price movement is represented on the chart as candlesticks (or bars) with the same period, corresponding to the chosen timeframe. The larger the timeframe, the bigger "volume" of the price movement is shown by each candlestick on the chart.

You may set up any timeframe for the price chart but normally traders use basic conventional timeframes:
  • MN is a monthly timeframe, each candlestick shows the price movement during a month.
  • W1 is a weekly timeframe, each candlestick shows the price movement during a week.
  • D1 is a daily timeframe, each candlestick shows the price movement during a day.
  • H4 is a four-hour timeframe, each candlestick shows the price movement during four hours.
  • H1 is an hourly timeframe, each candlestick shows the price movement during an hour.
  • M30 is a 30-minute timeframe, each candlestick shows the price movement during 30 minutes.
The timeframe is chosen in the trading terminal. In such popular terminals as MetaTrader 4 and MetaTrader 5, there is a table of active buttons for the main timeframes on the Instrument board. Left-clicking the buttons, you can quickly switch from one timeframe to another.

timeframe-mt-en-1109x630.png


How to choose a timeframe?

To analyze the price chart, we normally use not one but several timeframes. Analyzing the price movements on several timeframes, the trader receives a vaster picture of the dynamics of the financial instrument. This helps to forecast price movements for different intervals depending on your trading strategy.

While for the general analysis of your financial instrument you may use all timeframes at once, for making trades you need a "narrower horizon". In many trend strategies based on the main rules of tech analysis, we usually choose two timeframes:

Timeframes for long-term trading

Long-term trading normally means a relatively small number of trades that remain in the market for a long time - from several weeks to several months. This trading style is similar to investing: you choose an instrument that promises a substantial movement and make decision mostly based on fundamental analysis.

Criteria for long-term trading:
  • Little time for trading: you spend less than 1/5 of your worktime on it.
  • The deposit is large, you may enter the market with a large position for a long term, place big Stop Losses, and withstand deep drawdowns (from 50,000 USD).
As the main timeframe for long-term trading, on which you will define the main trend and its aim, the MN (monthly) and W1 (weekly) timeframes will be the best. As an additional timeframe for finding entry points, use D1. In the picture, you can see these timeframes in use:

Read more at R Blog - RoboForex

Sincerely,
RoboForex team
 
Dear traders!

This week, the ContestFX project will continue, as usual, with the following demo competitions:

The 143rd competition of "Demo Forex" has been running since last Monday.
The 400th competition of "Week with CFD" has just started.
The 534th competition of "Trade Day" will start on 15.02.2023 at 12:00.
The 448th competition of "KingSize MT5" will start on 16.02.2023 at 20:00.

We remind you that all winners of our contests receive prize funds to their real accounts, and they can use them to earn money on the Forex market instead of investing their own savings as the initial deposit.

Join us!

Sincerely,
RoboForex Contest
 
Setting Up the "Support and Resistance Based on 240 Bars" Trading Strategy

Author : Andrey Goilov

10.01.2023-1536x662.jpg


Dear Clients and Partners,

Today we will look at the medium-term Support and Resistance Based on the 240 Bars strategy. Support and resistance levels will be automatically plotted using the SF Trend Lines indicator as "bullish" and "bearish" channels. The strategy involves trading the pairs EUR/USD, GBP/USD, USD/JPY, USD/CAD, USD/CHF, and NZD/USD on the four-hour chart.

In this article we will explain how to add the indicator to the trading terminal, discuss the rules for opening and closing positions, as well as the subtleties of setting Stop Loss and Take Profit.

Pic-1.png


Setting up the SF Trend Lines indicator
  • Download SF Trend Lines
  • Add it to the installed trading terminal by opening the MQL4 folder and pasting it into the Indicators folder
  • Add an indicator to the chart in MT4, working from the menu: Insert → Indicators → Custom → sf-trend-lines
  • You can change the colour of the trend lines in the settings, but it is important to leave the number of bars at 240 unchanged
SF Trend Lines builds a price channel with the upper boundary acting as critical resistance, so a pullback is expected from it. The lower boundary of this channel is a critical support area, so an upward bounce is expected from it.

The indicator does not build the entire chart with channels; it builds only the actual channel, which means you cannot assess the quality of signals on the history of the chart – only in real time. There can only be one channel on the H4 chart.

How to Buy with Support and Resistance Based on 240 Bars

1. The price should reach the bottom of the uptrend channel on the SF Trend Lines indicator chart.

2. The Williams' Percent Range (Williams' %R) indicator can be used as a confirmation signal. Its values should fall below the -80 level.

3. Stop Loss can be set behind the lower boundary line of the SF Trend Lines channel. If the price has already fallen below this line and rebounded, then the Stop Loss should be set 5-10 points below the candlestick's low.

4. Take Profit is based on a 1:4 profit/loss ratio. If Stop Loss is 30 points, Take Profit is 120.

Support and Resistance Based on the 240 Bars Buying Example
  • On the chart of the currency pair EUR/USD on 6 February 2023, after rebounding from the upper boundary of the "bullish" channel where there was a strong resistance level, the price fell and tested the support line of the indicator SF Trend Lines
  • The Williams' %R indicator was below -80, indicating that the currency pair was severely oversold
Pic-6.png

  • A long position was opened at 1.0786
  • The stop loss was placed below the support line, at 1.0756. Its size is 30 points
  • Take Profit was set at 1.0906 Its size is four times the size of the Stop Loss
Read more at R Blog - RoboForex

Sincerely,
RoboForex team
 
RoboForex: upcoming changes to the trading schedule in view of Presidents' Day in the US

roboforex-header.jpg


Dear Clients and Partners,

We are informing you that there will be some changes to the trading schedule during the Presidents' Day in USA.

This schedule is for informational purposes only and may be subject to further change.

MetaTrader 4 / MetaTrader 5 platforms

Schedule for trading on CFDs on US indices (US30Cash, US500Cash, USTECHCash) and Japanese index JP225Cash
  • 20 February 2023 – trading stops at 7:40 PM server time.
  • 21 February 2023 – trading starts as usual
.
Schedule for trading on Metals (XAUUSD, XAGUSD) and CFDs on oil (Brent, WTI)
  • 20 February 2023 – trading stops at 7:40 PM server time.
  • 21 February 2023 – trading starts as usual.
Schedule for trading on CFDs on US stocks
  • 20 February 2023 – no trading.
  • 21 February 2023 – trading starts as usual.
R StocksTrader platform

Schedule for trading on US Stocks, US ETFs, CFDs on US Stocks and ETFs
  • 20 February 2023 – no trading.
  • 21 February 2023 – trading starts as usual.
Schedule for trading on Metals (XAUUSD, XAGUSD), CFDs on Crude Oil (BRENT.oil, WTI.oil) and US Indices (US500, US30, NAS100)
  • 20 February 2023 – trading stops at 7:40 PM server time.
  • 21 February 2023 – trading starts as usual.
cTrader platform

Schedule for trading on Metals (XAUUSD, XAGUSD)
  • 20 February 2023 – trading stops at 7:40 PM server time.
  • 21 February 2023 – trading starts as usual.
Please take note of the above trading schedule changes when planning your trading activity.

* – This schedule is for informational purposes only and may be subject to further change.

Sincerely,
RoboForex team
 
Last edited:
Back
Top