• Please try to select the correct prefix when making a new thread in this folder.

    Discuss is for general discussions of a financial company or issues related to companies.

    Info is for things like "Has anyone heard of Company X?" or "Is Company X legit or not?"

    Compare is for things like "Which of these 2 (or more) companies is best?"

    Searching is for things like "Help me pick a broker" or "What's the best VPS out there for trading?"

    Problem is for reporting an issue with a company. Please don't just scream "CompanyX is a scam!" It is much more useful to say "I can't withdraw my money from Company X" or "Company Y is not honoring their refund guarantee" in the subject line.
    Keep Problem discussions civil and lay out the facts of your case. Your goal should be to get your problem resolved or reported to the regulators, not to see how many insults you can put into the thread.

    More info coming soon.

Discuss RoboForex.com

General discussions of a financial company
Dear traders!

This week, the ContestFx project will continue with the following competitions:

The 118th competition of "Demo Forex" has entered the final phase.
The 294th competition of "Week with CFD" has just kicked off.
The 427th competition of "Trade Day" will start on 27.01.2021 at 12:00.
The 343rd competition of "KingSize MT5" will start on 28.01.2021 at 20:00.

Let us remind you that participation in any desired competition becomes available for you after you go through a simple registration procedure, while the prize money will allow the winners to start trading on the Forex market without investing their own financial resources.

Good luck!

Sincerely,
RoboForex Contest
En mis 6 años como comerciante, nunca había visto una ejecución de órdenes tan malvada como esta.

Hoy, 18 de enero de 2021, el oro abre su sesión con un valor de 1828 el cual mantiene hasta media hora después de la apertura de Australia, en mi reloj local son las 20:30, hora con bastante liquidez más para pedidos pequeños como el mío. en comparación con las cuentas gigantes, tenía un total de 0.18 unidades de oro para la compra, estas estaban protegidas con una orden contraria al valor de 1824-23-22-20 y 1818, el corredor ejecuta estas órdenes contrarias al valor de 1803, lo que daña mucho mi cuenta y para colmo una hora después el valor del activo vuelve a la zona de mis compras, entonces lo que hizo no tiene justificación, el broker abre una orden de rebaja a un precio ridículo, mejor no abrir nada, pero sí, abre una orden de venta rebajada establecida en el valor de 1824-1823-1822 y 1818, sin embargo los abre al valor de 1803,Realmente es una sanción tremenda, llevo 6 años con este corredor y todo porque pude doblar mi cuenta en 5 días ha destruido todo mi trabajo y lo peor de toda mi confianza, ya no sé a qué corredor recurrir para, por favor, ocúpese de esto, ni la pérdida por caída ni la cobertura de la orden opuesta pueden salvarlos, PELIGRO CON CUENTAS GRANDES, el corredor no ha ofrecido ninguna compensación Yo mismo vi cómo el corredor movió mi precio y bajó y bajó por SÓLO SOLO COINCIDENCIA ABRE EL PEDIDO EL MÍNIMO DE TU VELA, DESTRUYENDO MI CUENTAni el stoop loss ni la cobertura de la orden opuesta pueden salvarlos, PELIGRO CON CUENTAS GRANDES, el corredor no ha ofrecido ninguna compensación Yo mismo vi como el corredor movió mi precio y bajó y bajó por SÓLO SOLO COINCIDENCIA ABRE EL PEDIDO EL MÍNIMO DE SU VELA , DESTRUYENDO MI CUENTAni el stoop loss ni la cobertura de la orden opuesta pueden salvarlos, PELIGRO CON CUENTAS GRANDES, el corredor no ha ofrecido ninguna compensación Yo mismo vi como el corredor movió mi precio y bajó y bajó por SÓLO SOLO COINCIDENCIA ABRE EL PEDIDO EL MÍNIMO DE SU VELA , DESTRUYENDO MI CUENTA

https://www.forexpeacearmy.com/forex-reviews/7374/roboforex-forex-brokers
 
How to invest 10,000 USD?

Author: Andrey Goilov

roboforex-header.jpg


Dear Clients and Partners,

A not long time ago, we discussed the possibilities of investing $1,000. And if it was a rather small amount, then $10,000 is looking much more fascinating for investments.

To find the correct answer to this question, we should take several things into account. First of all, goals and periods of investments. If the period is rather short, then one may risk and consider aggressive methods of investing. If you need to use the money, which you want to invest, in a couple of weeks or months, then you can choose an option of investing it in stocks that may bring profit in years, that’s why investment horizons are a very important parameter.

Another factor is your attitude to risks, which can be assessed by answering some questions, for example, how much will your life change if you lose this money? If your appetite for risks is okay, then you can try the currency market and trade with the leverage according to a chosen strategy.

Emotions have a very significant influence on investments: a lot of beginner investors tend to close positions when the market starts falling, at the time of a slight drawdown, which may sometimes be considered as a good time for buying. If emotions can’t deal with such drawdowns, it might be better to switch to conservative ways of investing.

What is the best way to invest $10,000?

The modern world offers plenty of ways to invest your money and some of them don’t even require you to leave home. However, you should remember that many of the offered investment methods are of speculative nature, while more aggressive ways imply significant risks. Moreover, unfortunately, but the previous results shouldn’t be considered as a prediction of receiving profit in the future because financial markets are quickly changing, as well as global affairs and events. Let’s discuss the most popular investment methods.
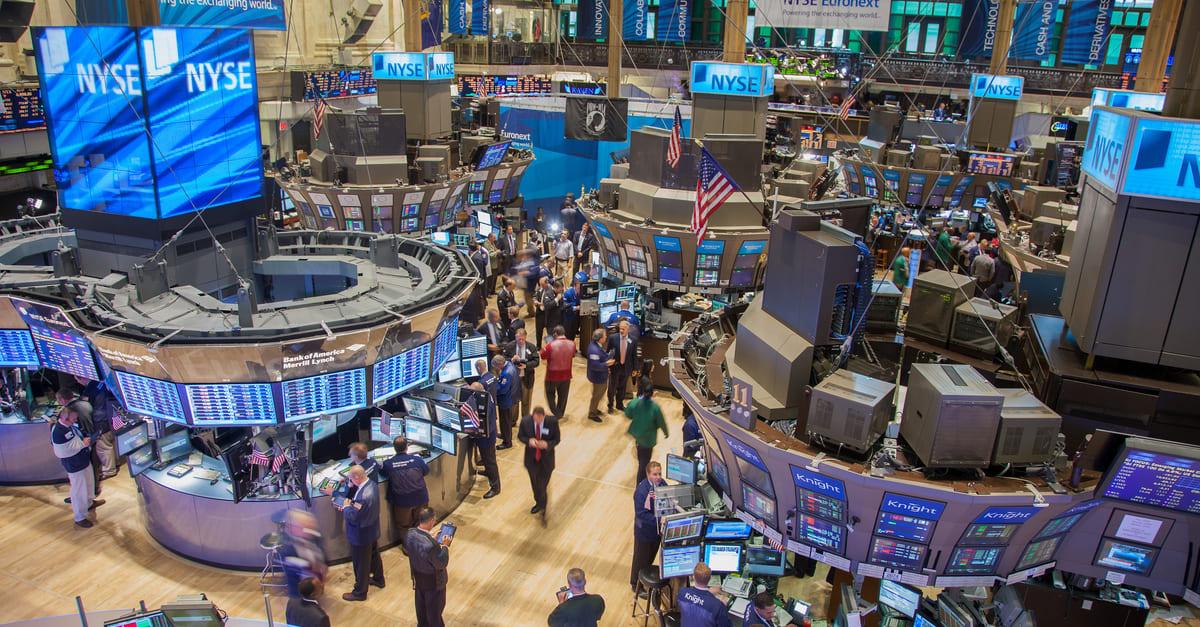
Stock market

stock-market.jpg


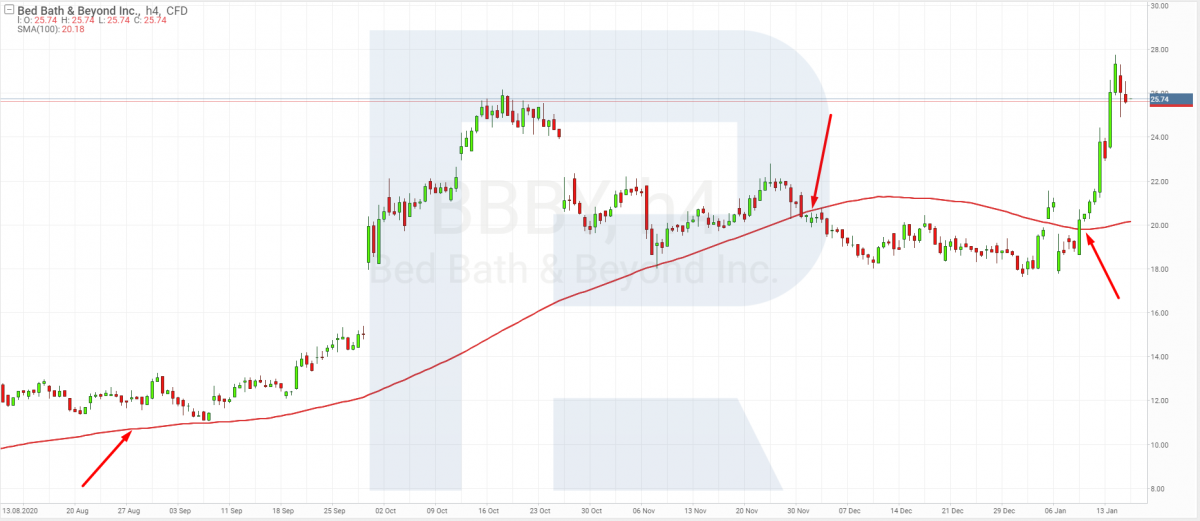
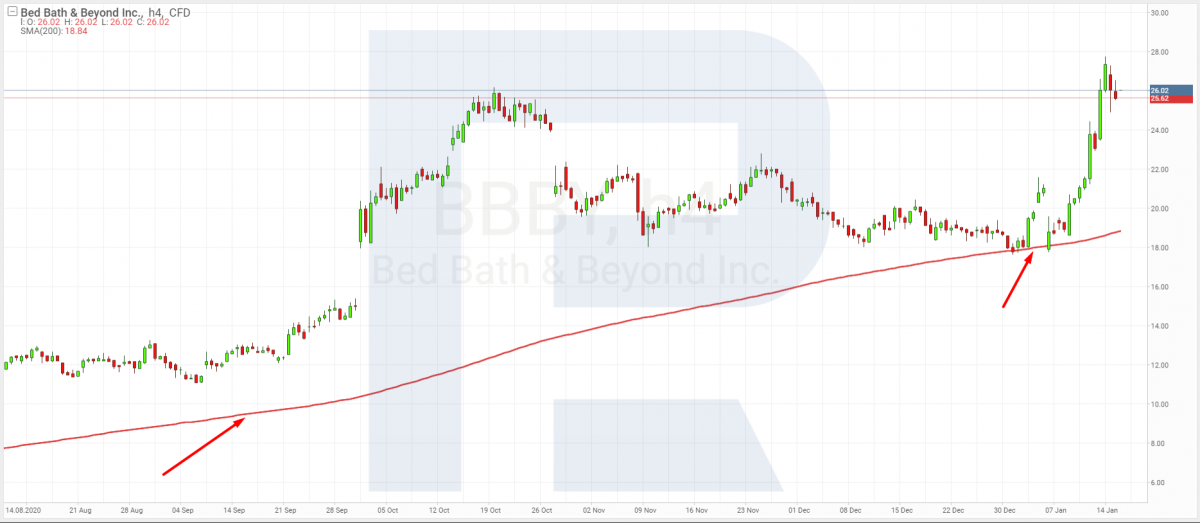
There is an opinion that if there is $10,000, one can trade on the stock market with comfort. Still, this trading implies not only buying stocks: an investor must follow the news and behavior of stocks. The most part on investors seeks to buy during the market meltdown because later it will recover and the price will go up. However, the anticipation of a rebound may take much time.

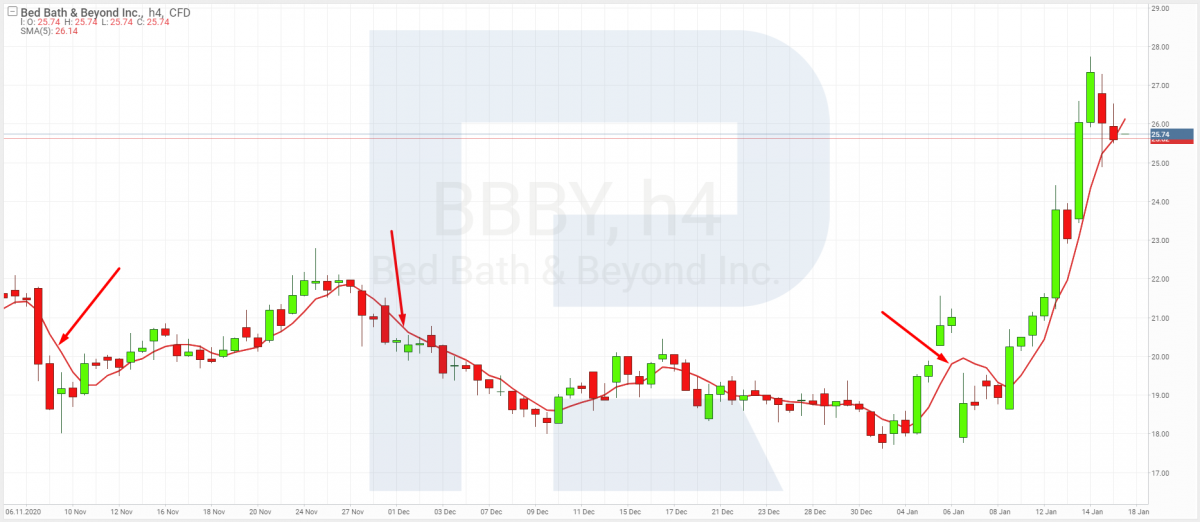
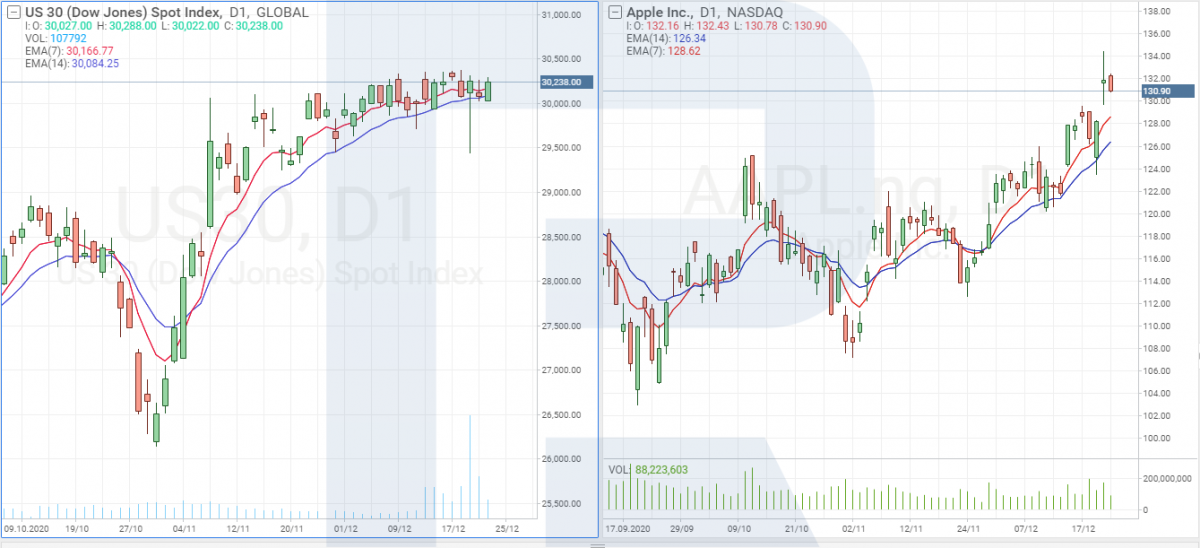
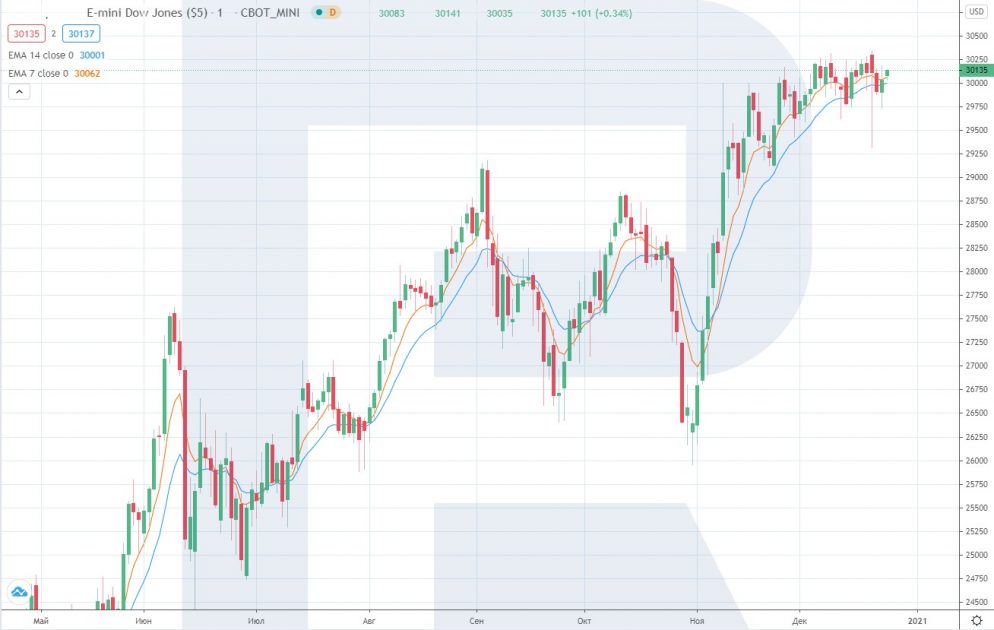
For example, Warren Buffett dissuades from choosing any particular stocks but offers to invest money in some unexpensive companies. If you take a closer look at Buffett’s portfolio, you will find shares of such companies as Apple, Bank of America, Coca-Cola, American Express, JP Morgan Chase, Moody’s, Goldman Sachs.

These companies’ shares plunged early in the year but they are growing again and, probably, may reach their peaks in the nearest future. Such market movements confirm that the best possible moment for buying stocks might be the time when they fall to lower prices because such investments are not considered to be short-term.

Read more at R Blog - RoboForex

Sincerely,
RoboForex team
En mis 6 años como comerciante, nunca había visto una ejecución de órdenes tan malvada como esta.

Hoy, 18 de enero de 2021, el oro abre su sesión con un valor de 1828 el cual mantiene hasta media hora después de la apertura de Australia, en mi reloj local son las 20:30, hora con bastante liquidez más para pedidos pequeños como el mío. en comparación con las cuentas gigantes, tenía un total de 0.18 unidades de oro para la compra, estas estaban protegidas con una orden contraria al valor de 1824-23-22-20 y 1818, el corredor ejecuta estas órdenes contrarias al valor de 1803, lo que daña mucho mi cuenta y para colmo una hora después el valor del activo vuelve a la zona de mis compras, entonces lo que hizo no tiene justificación, el broker abre una orden de rebaja a un precio ridículo, mejor no abrir nada, pero sí, abre una orden de venta rebajada establecida en el valor de 1824-1823-1822 y 1818, sin embargo los abre al valor de 1803,Realmente es una sanción tremenda, llevo 6 años con este corredor y todo porque pude doblar mi cuenta en 5 días ha destruido todo mi trabajo y lo peor de toda mi confianza, ya no sé a qué corredor recurrir para, por favor, ocúpese de esto, ni la pérdida por caída ni la cobertura de la orden opuesta pueden salvarlos, PELIGRO CON CUENTAS GRANDES, el corredor no ha ofrecido ninguna compensación Yo mismo vi cómo el corredor movió mi precio y bajó y bajó por SÓLO SOLO COINCIDENCIA ABRE EL PEDIDO EL MÍNIMO DE TU VELA, DESTRUYENDO MI CUENTAni el stoop loss ni la cobertura de la orden opuesta pueden salvarlos, PELIGRO CON CUENTAS GRANDES, el corredor no ha ofrecido ninguna compensación Yo mismo vi como el corredor movió mi precio y bajó y bajó por SÓLO SOLO COINCIDENCIA ABRE EL PEDIDO EL MÍNIMO DE SU VELA , DESTRUYENDO MI CUENTAni el stoop loss ni la cobertura de la orden opuesta pueden salvarlos, PELIGRO CON CUENTAS GRANDES, el corredor no ha ofrecido ninguna compensación Yo mismo vi como el corredor movió mi precio y bajó y bajó por SÓLO SOLO COINCIDENCIA ABRE EL PEDIDO EL MÍNIMO DE SU VELA , DESTRUYENDO MI CUENTA

https://www.forexpeacearmy.com/forex-reviews/7374/roboforex-forex-brokers
 
How to Trade Arthur A. Merrill’s M and W Patterns

Author: Andrey Goilov

roboforex-header.jpg


Dear Clients and Partners,

Arthur Merrill, the hero of this article, called his patterns “wave structures”. The name is connected to the popularity of Dow Theory, describing wave-like price movements, at those times. By the way, popular Elliott’s Waves are based on this theory.

Merrill tried to find the same logic in graphic structures because many sooner or later turn back to searching patterns on the chart. In the end, he singled out 32 graphic patterns and distributed them between two groups: 16 M-shaped and 16 W-shaped patterns. They indicate the end of either an ascending or descending trend, sort of reflecting one another mirror-like.

The history of Merrill’s patterns

The first attempt to describe such patterns is considered to belong to Robert Levi, a financier. In 1971, he took up studying five-pointed price patterns, trying to structure them but failed to complete his studies because the patterns were too abundant (about 2,000 patterns).

Levi abandoned the idea, and it was left behind for a decade. At the beginning of 1980, Arthur Merrill re-took studying the patterns, which resulted in singling out and structuring the five-pointed patterns below.

M1 and W16

The last point of the M1 pattern reflects the end of a decline, but the author says that it is not as much a reversal point, rather a point of being extremely overbought. As for classic tech analysis, this one is similar to the Wedge reversal pattern.

merrills-technical-figures-arthur-a.-merrill-m1-w16.jpg


Here, we also watch the pattern contract and the trend – reverse upon breaking the pattern away. To place the goal, calculate the height of the pattern and measure these points from the point of the breakaway.

M2 and W15

In the M2 pattern, the price goes in some sort of a downward zigzag, after which an upwards zigzag appears, but we do not wait for a renewal of the high as in M1. This pattern is similar to an Inverted Head and Shoulders from classic tech analysis. In the picture, the right “shoulder” is rather low but it still remains an example of our pattern. To estimate the goal, measure the pattern and place the goal as many points away from the breakaway point on the “neck”.

merrills-technical-figures-arthur-a.-merrill-m2-w15.jpg


Also, in a downward movement, when the price fails to demonstrate a new low under the previous one but shows a new high above the previous one, the trend reverses. This is the market’s nature. So even if your understanding of the pattern is simplistic, always keep in mind the potential of a trend reversal when the price cannot go on down and breaks through the nearest high.

Read more at R Blog - RoboForex

Sincerely,
RoboForex team
 
How to Use Moving Average for Buying Stocks?

Author: Maks Artemov

roboforex-header.jpg


Dear Clients and Partners,

The Moving Average has long been on the trading scene and has become an intrinsic part of many trading strategies. Though simple, the indicator works on almost all timeframes and with any instrument.

There are plenty of indicators based on the MA, being, in essence, the same old MA slightly alternated. This is a trend indicator, and its main task is to indicate the direction of the price, smoothing out noises and insignificant fluctuations.

Setting up the indicator

The Moving Average has several settings:
  • Period is the number of bars used for calculations. It can be 1 and higher.
  • Shift is the number of bars by which the period will be shifted.
  • Method: there are the Simple (SMA), Exponential (EMA), and Weighted (WMA) Moving Averages.
  • Apply to: close, open, high, or low.
Alternating these parameters, a trader can set up the indicator for a certain instrument and trading conditions. There are plenty of ways to use the indicator. MAs with large periods are normally used for medium-term trading. Trading intraday rather requires using MAs with periods below 100.

What it looks like on the chart

First of all, set the parameters. The smaller the period, the closer the MA will follow the price chart, mimicking the price. In the picture, we see EMA5, which means that the calculation period is 5 last bars, the shift is zero, apply to close.

ema-5-1-1200x522.png


If we choose period 100, the MA will follow the chart closely and sometimes cross it.

ema-100-2-1200x521.png


If we use a period above 100, the MA chart will move farther away from the price chart and close it rarer.

ema-200-3-1200x523.png


Using the MA for trading stocks

Based on the fact that the charts of stocks do not differ much from those of currency pairs or cryptocurrencies, you can use the indicator without significant limitations. Market players say that “bears live under the MA200 and the bulls – above it”. This means that, in the long run, the indicator speaks about the continuation of the current trend.

Read more at R Blog - RoboForex

Sincerely,
RoboForex team
 
How to Trade Arthur A. Merrill’s M and W Patterns

Author: Andrey Goilov

roboforex-header.jpg


Dear Clients and Partners,

Arthur Merrill, the hero of this article, called his patterns “wave structures”. The name is connected to the popularity of Dow Theory, describing wave-like price movements, at those times. By the way, popular Elliott’s Waves are based on this theory.

Merrill tried to find the same logic in graphic structures because many sooner or later turn back to searching patterns on the chart. In the end, he singled out 32 graphic patterns and distributed them between two groups: 16 M-shaped and 16 W-shaped patterns. They indicate the end of either an ascending or descending trend, sort of reflecting one another mirror-like.

The history of Merrill’s patterns

The first attempt to describe such patterns is considered to belong to Robert Levi, a financier. In 1971, he took up studying five-pointed price patterns, trying to structure them but failed to complete his studies because the patterns were too abundant (about 2,000 patterns).

Levi abandoned the idea, and it was left behind for a decade. At the beginning of 1980, Arthur Merrill re-took studying the patterns, which resulted in singling out and structuring the five-pointed patterns below.

M1 and W16

The last point of the M1 pattern reflects the end of a decline, but the author says that it is not as much a reversal point, rather a point of being extremely overbought. As for classic tech analysis, this one is similar to the Wedge reversal pattern.

merrills-technical-figures-arthur-a.-merrill-m1-w16.jpg


Here, we also watch the pattern contract and the trend – reverse upon breaking the pattern away. To place the goal, calculate the height of the pattern and measure these points from the point of the breakaway.

M2 and W15

In the M2 pattern, the price goes in some sort of a downward zigzag, after which an upwards zigzag appears, but we do not wait for a renewal of the high as in M1. This pattern is similar to an Inverted Head and Shoulders from classic tech analysis. In the picture, the right “shoulder” is rather low but it still remains an example of our pattern. To estimate the goal, measure the pattern and place the goal as many points away from the breakaway point on the “neck”.

merrills-technical-figures-arthur-a.-merrill-m2-w15.jpg


Also, in a downward movement, when the price fails to demonstrate a new low under the previous one but shows a new high above the previous one, the trend reverses. This is the market’s nature. So even if your understanding of the pattern is simplistic, always keep in mind the potential of a trend reversal when the price cannot go on down and breaks through the nearest high.

Read more at R Blog - RoboForex

Sincerely,
RoboForex team
 
Dear traders!

In the first week of February, RoboForex's project called ContestFX offers you the following competitions:

The 119th competition of "Demo Forex" and 295th competition of "Week with CFD" have just kicked off.
428th competition of "Trade Day" will start on 03.02.2021 at 12:00.
344th competition of "KingSize MT5" will start on 04.02.2021 at 20:00.

If you've never taken part in our exciting competitions, it's easy to do it: you just need to go through a simple registration procedure. After that, participation in any of your desired competitions will be available in just a couple of mouse clicks.

Join us, it won't be boring!

Sincerely,
RoboForex Contest
 
How to Invest in Dow Jones?

Author: Victor Gryazin

roboforex-header.jpg


Dear Clients and Partners,

The Dow Jones Industrial Average is one of the oldest and most famous stock indices over the globe. It is included in the top-three US indices and boasts the best capitalization among them. In this overview, I will demonstrate to you the structure of Dow Jones and give some advice on investing in it.

History of Dow Jones

The DJIA was created in 1896 by a journalist, editor of the famous Wall Street Journal Charles Henry Dow alongside his business partner Edward Davis Jones. Charles Dow used the average for tracking the stock dynamics of US leading companies with high revenue. Initially, the index consisted mostly of industrial companies producing and selling oil, gas, sugar, tobacco, cotton, etc.

The index has changed several times. In 1916, the list of companies was extended to 20, in 1928 – to 30, and this is the number of companies it includes now. During the Great Depression of the 1930s, the list has been reshuffled because many companies went bankrupt. In 1932, 8 members of the index were replaced by such companies as Coca Cola, the Procter&Gamble Company, etc.

The calculation formula of the index was also updated. When the DJIA was created, it showed just the arithmetical mean of those 12 stocks it contained. Today, we use the Dow correction factor that accounts for structural changes in the companies.

Ways to invest in Dow Jones

The DJIA is a popular high-liquidity asset for trading and investing. For the latter, you can use various financial instruments depending on your strategy: stocks, options, futures, CFDs, ETFs.

Buying stocks from the index

If an investor decides to collect a portfolio of Dow Jones stocks on their own, they will need to buy at least one stock of each company from the index. This will be costly due to the price of certain stocks from the index. Moreover, you will have to watch the market constantly, re-balancing your investment portfolio. The positive side of this investment option is that you will also have your dividends paid to you.

djia-stock-1200x548.png


Futures and options

Futures and options are standardized stock derivatives for the DJIA. Buying them can be interpreted as a trade with a whole portfolio of stocks from the index. Note that you do not get your stocks for real, only contracts for them.

Derivatives let experienced investors use complex strategies with different combinations of futures and options. As a rule, these instruments are used for rather short-term investments – six to twelve months. Long-term investments require changing contracts that are expiring for new ones, which might deteriorate your overall result.

djia-futures-994x630.jpg


Closing thoughts

The DJIA includes the stocks of the US 30 leading companies. It does not only identify the economic situation in the country but is also a popular investment instrument. Thanks to various financial instruments (stocks, futures, ETFs, options), you can use various strategies with the DJIA. The choice is yours, just never forget about risks.

Read more at R Blog - RoboForex

Sincerely,
RoboForex team
 
Back
Top