• Please try to select the correct prefix when making a new thread in this folder.

    Discuss is for general discussions of a financial company or issues related to companies.

    Info is for things like "Has anyone heard of Company X?" or "Is Company X legit or not?"

    Compare is for things like "Which of these 2 (or more) companies is best?"

    Searching is for things like "Help me pick a broker" or "What's the best VPS out there for trading?"

    Problem is for reporting an issue with a company. Please don't just scream "CompanyX is a scam!" It is much more useful to say "I can't withdraw my money from Company X" or "Company Y is not honoring their refund guarantee" in the subject line.
    Keep Problem discussions civil and lay out the facts of your case. Your goal should be to get your problem resolved or reported to the regulators, not to see how many insults you can put into the thread.

    More info coming soon.

Discuss RoboForex.com

General discussions of a financial company
RoboForex gives away $1,100,000 among its clients and partners

rf-news__11-years.jpg


Dear Clients and Partners,

Join the promotion for $1,100,000 to celebrate RoboForex’s 11th birthday! Each month from July 2021 to April 2022, there will be a giveaway of money prizes among traders with Prime account, Partners, and CopyFX Traders with Prime accounts.

Over 500 for the total of $1,100,000

will be given away over 10 months
  • 54 winners each month
    The prize pool of each giveaway is $110,000.

  • Up to 3 chances to win
    You can receive one coupon in all three categories each month.

  • Prizes up to $20,000
    Your prize can be immediately withdrawn from the account or used in further trading.

How to join?

Receive Coupons for fulfilling the conditions below. You can participate in monthly giveaways and receive Coupons in all 3 categories.

1.
Traders with Prime accounts
Trade with the best conditions: spreads from 0, commission for the trading volume of 1 million USD decreased to 10 USD. leverage up to 1:300.

Conditions for receiving a Coupon:
  • Deposit at least 300 USD to your account.
  • Perform at least 3* lots of trading operations per month.
* - Only the positions in currency pairs and metals opened in the current month are taken into account

Open Prime account

2. Partners
Attract clients to trade and receive up to 60% of the Company’s revenue.

Conditions for receiving a Coupon:
  • Partner commission at month-end is at least 300 USD
Become Partner

3. CopyFX Traders
Earn on your strategies at CopyFX and increase your chances to win a prize.

Conditions for receiving a Coupon:
  • Make the Top-30 of the best CopyFX Traders on Prime accounts in the current month.
Open CopyFX Prime account


Join the offer right now, take part in as many giveaways as possible, and increase your chance to win. Good luck!


More about the promotion >

Sincerely,
RoboForex team
 
Dear traders!

This week, the RoboForex company's project called ContestFX is waiting for you to participate in the following competitions:

The 124th competition of "Demo Forex" has gained "speed".
The 318th competition of "Week with CFD" has started today.
451st competition of "Trade Day" will start on 14.07.2021 at 12:00.
367th competition of "KingSize MT5" will start on 15.07.2021 at 20:00.

We remind you that participation in our demo competitions is completely free and all winners receive funds as a reward to their real accounts, so they can use them to perform trading operations on the Forex market without investing their own financial savings required as an initial deposit.

We wish good luck to all of you!!

Sincerely,
RoboForex Contest
 
Top-7 Oscillators for Trading

Author: Victor Gryazin

roboforex-header.jpg


Dear Clients and Partners,

Trading indicators have long become useful instruments in traders’ work. This article is devoted to seven popular oscillators that help detect the current market situation and give signals for opening and closing positions.

1. The MACD (Moving Average Convergence/Divergence)

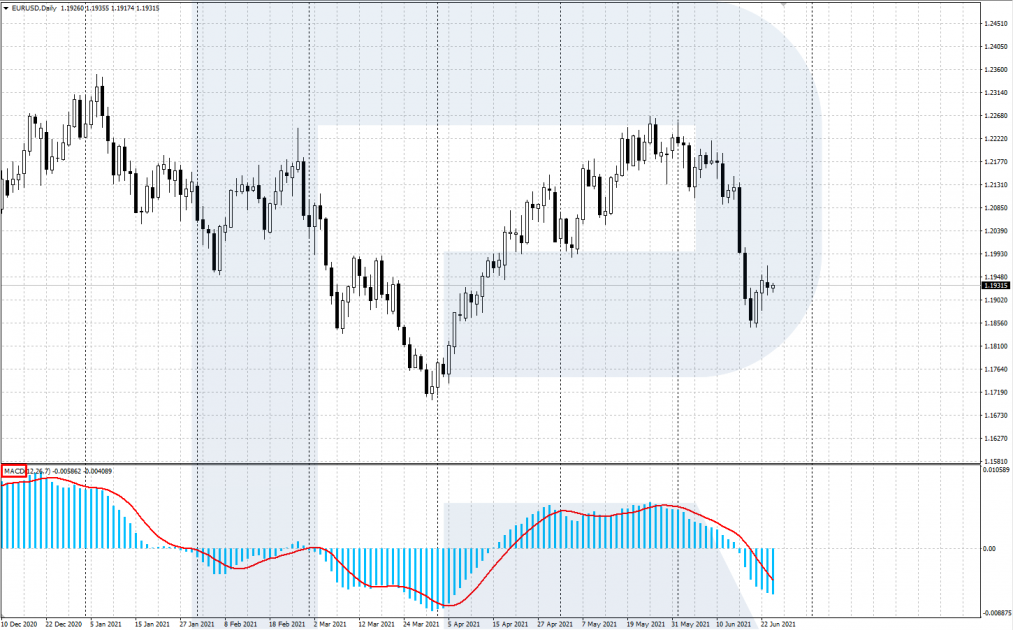
This is one of the most popular oscillators. It was created by a famous trader and analyst Gerald Appel. As the name of the indicator tells us, the indicator is comprised of several MAs with different parameters.

The indicator is calculated in a separate window on the terminal desktop and consists of two lines, one of them presented by a bar histogram. A trading signal is basically a crossing of the two lines or a divergence of their extremes (highs and lows) with the price chart. A divergence might be predicting a correction or even a trend reversal.

Top7-oscillators-MACD-1013x630.png


2. RSI (Relative Strength Index)

RSI is a normalized oscillator. The developer and popularizer of the indicator is J. Welles Wilder.

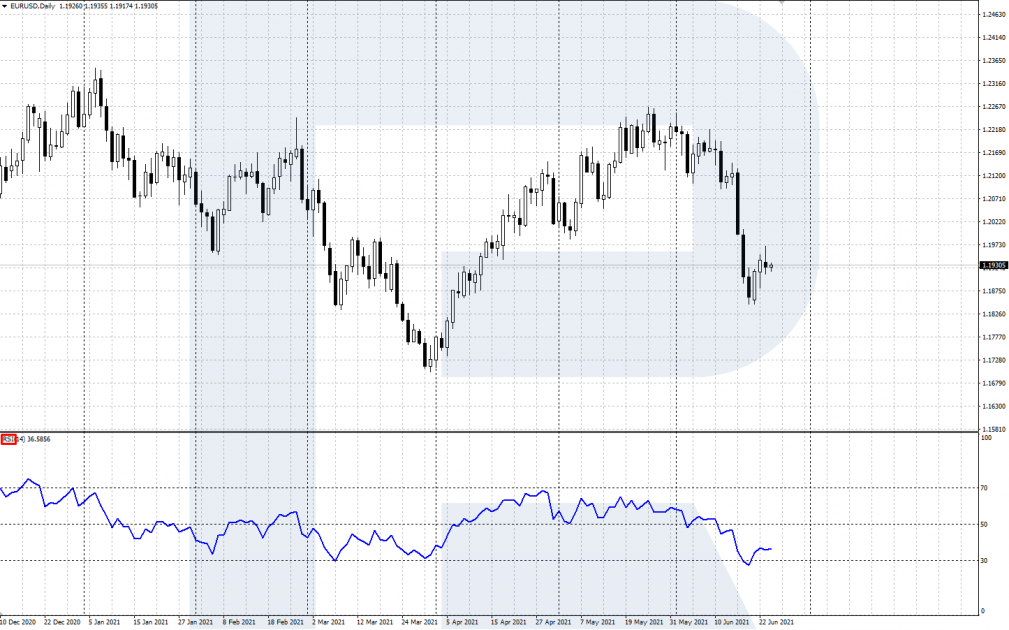
RSI shows the position of current prices compared to the previous period. It has become a great option for trading flats as it shows how much the price has deviated from its average.

RSI is displayed in a separate window under the chart of your asset. Trading signals are generated by levels 30, 50, and 70. The area above 70 is called overbought. There signals to sell appear. The area below 30 is called oversold, and there signals to buy emerge. If there is a bright trend in the market, use RSI by the trend only.

Top7-oscillators-RSI-1009x630.png


3. The Stochastic Oscillator

The Stochastic Oscillator was created by a famous trader George Lane. He noted that prices move in some sort of cycles: going from one level to another, it sometimes becomes in turns oversold and overbought. The Stochastic shows whether buyers and sellers can close the day at the reached highs/lows.

Stochastic is a normalized oscillator, displayed in a separate window under the price chart and consisting of two lines: %K is fast and %D is slow. Values vary from 0% to 100%; at the levels of 20% and 80% signal lines are drawn. They single out the oversold (0-20%) and overbought (80-100%) areas. These areas are used for finding signals to buy and sell.

Read more at R Blog - RoboForex

Sincerely,
RoboForex team
 
How to Trade the Engulfing Pattern?

Author: Dmitriy Gurkovskiy

roboforex-header.jpg


Dear Clients and Partners,

This overview is devoted to the Engulfing pattern; to how it forms and works. This candlestick pattern is easy to note on the chart. It forecasts a reversal of the actual trend.

How does the Engulfing pattern form?

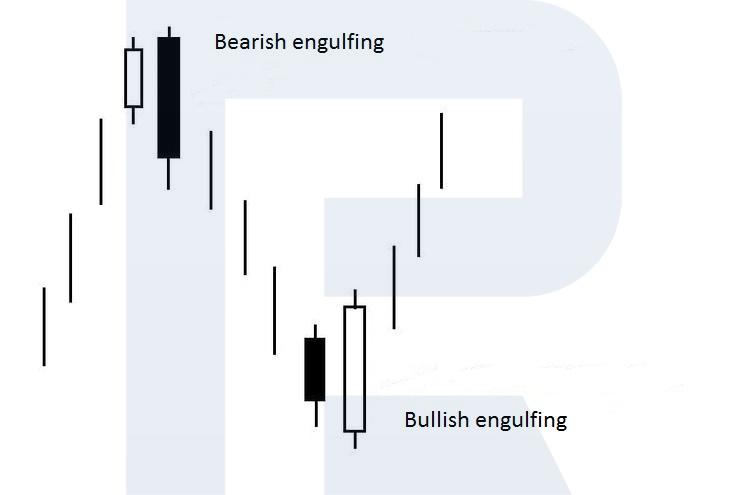
The Engulfing pattern is a reversal candlestick pattern that forms on the local highs and lows of the price chart in an uptrend or downtrend. It consists of two candlesticks: the first one has a relatively small body, while the second one is of the opposite color and has a larger body that fully covers (engulfs) the first candlestick.

In terms of the market behavior, an Engulfing pattern means that the actual trend is losing its power and tempo — the first candlestick demonstrates this. The previous movement loses strength, and the market balance is feeble.

The appearance of the next mighty candlestick of the pattern that engulfs the previous one and closes in the opposite direction, signifies the beginning of a correction that might even turn into a reversal of the current trend.

Types of the Engulfing pattern

Depending on the color of the second engulfing candlestick, two types of the pattern are sungled out: the Bullish engulfing and the Bearish engulfing.

Bullish engulfing

The pattern forms in a downtrend at the local lows of the price chart. The first small black candlestick of the pattern shows that bears are losing power; then a large white candlestick appears, fully engulfing the body of the first one. This means that bulls are advancing, feeling the bears' weakness.

Next thing, the price goes upwards, and an ascending correction starts. This is confirmed by the quotations rising higher than the high of the large bullish candlestick, the second one.

Bearish engulfing

The pattern forms in an ascending impulse at the local highs of the price chart. The first small white candlestick means that bulls are tired and need a pause. The large black candlestick that follows shows that bears are using their chance, counterattacking.

Then the quotations go down, and a descending correction starts. This is confirmed by falling under the low of the second candlestick, the large and white one.

Engulfing-en.jpg


Closing thoughts

Reversal candlestick patterns called Bullish engulfing and Bearish engulfing form at the local extremes of the price chart in an uptrend or downtrend. They predict a possible correction or even a reversal.

The efficacy of the patterns increase in presence of certain enforcing factors and alongside tech analysis patterns, support/resistance levels, and signals of trading indicators. Before trading for real, practise the patterns on a demo account.

Read more at R Blog - RoboForex

Sincerely,
RoboForex team
 
Dear traders!

This week, the ContestFX project brings to your attention the following demo competitions:

The 124th competition of "Demo Forex" has crossed its "Equator".
The 319th competition of "Week with CFD" has just started.
At 12:00, July 21st, 2021, starts the 452nd competition of "Trade Day".
At 20:00, July 22nd, 2021, starts the 368th competition of "KingSize MT5".

If you've never been a participant in our competitions, it is enough for you to go through a simple registration procedure and get access to any of your desired competitions in just a couple of mouse clicks.

Join us!

Sincerely,
RoboForex Contest
 
RoboForex: important information regarding GE reverse stock split on July 30th, 2021

roboforex-header.jpg


Dear Clients and Partners,

On July 30th, 2021, General Electric (GE, GE.ny) will have its stock go through a reverse split with a ratio of 1:8.

A reverse stock split is a corporate action as a result of which the company reduces the number of issued shares by a specific multiplier and simultaneously increases the value of each share by that multiplier. GE's split for example will mean that a shareholder who had 8 shares that are worth 13 USD each or 104 USD in total will have 1 share worth 104 USD.

How will it influence positions and orders?

If you have open positions in GE or plan to open such positions, please pay attention to the following changes, which will happen between 31st of July and 2nd of August.

MetaTrader 4 / MetaTrader 5 accounts
  • All pending orders (Buy Limit, Buy Stop, Sell Limit, Sell Stop, Buy Stop Limit, Sell Stop Limit, Stop Loss and Take Profit) orders on GE will be cancelled before the session opens at 16:31 on the 2nd of August.
  • The opening price of all positions that are open as of 15:00 (server time) on the 2nd of August on GE will be multiplied by 8.
  • The volume of all open positions on GE will be divided by 8.
  • In case the total exposition in GE is not a multiple of 8, the account will retain an open position with a volume that is a multiple of 8. The remaining volume will be closed at the last price of the 30th of July (Bid price will be used for Buy positions and Ask price for Sell positions).
Example:

In case you had one position with a total volume of 42 shares purchased at a price of 12, as of the 2nd of August, your account will have one open position with a volume of 5 and an opening price of 96 (12*8) and cash transaction with an amount equal to the result of closing the remaining 2 shares at the last price of the 30th of July.

In case you had several positions, they will all be combined into one position. The new position will have the opening price based on an average weighted price of all positions held before the split. If you had 3 following positions, 10 shares purchased at a price of 12; 20 shares purchased at a price of 12.5; 12 shares purchased at a price of 13, as of 2nd of August, your account will have:
  • an average weighted price of all positions is (10*12+20*12.5+12*13)/42= 12.52.
  • one open position with a volume of 5 and an opening price of 100.16 (12.52*8).
  • 2 positions closed with 0 result.
  • cash transaction with an amount equal to the result of closing the remaining 2 shares at the last price of the 30th of July.
In case the total exposition in GE is less than 8, the position will be closed at the last price of 30th of July (Bid price will be used for Buy positions and Ask price for Sell positions).

R Trader accounts

The Split procedure will run on the server at 15:00 server time.
  • During the procedure, all active pending orders (Buy Limit, Sell Limit, Take Profit, and Stop Loss) for GE and GE.ny will be cancelled.
  • The opening price of all positions that are open as of 15:00 (server time) on the 2nd of August will be multiplied by 8.
  • The volume of all open positions will be divided by 8.
  • If you hold more than one position in any of those instruments in one direction, they will all be combined into one position. The new position will have the opening price and a volume based on an average weighted price of all positions held before the split.
  • In case a deal receives fractional shares, such shares will be liquidated for cash transaction - "Split cash correction". The volume of other deals for the related instrument will be reset to 0 and moved to History Tab.
Pay attention to Expert Advisors (EA)

If you are using an Expert Advisor (EA), we suggest that you double-check with its developers whether its code needs any modifications to ensure that the EA operates correctly after the stock split.

The historical charts in your trading terminal will be updated to reflect the new prices of the instruments. Please, take into account this information when planning your trading activity.

All other aspects of trading conditions shall remain the same unless otherwise stated.

Sincerely,
RoboForex team
 
How to Trade VIX?

Author: Andrey Goilov

roboforex-header.jpg


Dear Clients and Partners,

Traders have always been trying to analyze and forecast future price movements. There are plenty of ways of making such forecasts and analyses. Some use chart patterns, some construct complicated trading systems based on indicators. However, there is always an alternative to all these approaches, which is VIX analysis.

This instrument is the index of future volatility of the US stock market. It is also known as "the fear index" because it can demonstrate the market sentiment. When the index values grow, this might mean that the market is expecting serious movements, such as corrections or even global crises. This information, in turn, can be used for making trading decisions.

This article is devoted to VIX and the ways of trading it and its derivatives.

What is VIX?

VIX, or the Volatility Index, was created in 1993 in Chicago Board Options Exchange. Speaking rather particularly, it represents the opinion of traders on the stock market behavior over the next 30 days.

VIX is calculated by the Black-Scholes formula based on 8 stocks from the S&P 500. VIX values can give an idea of how volatile next market movements will be, and this information, in turn, might help investors make a good trading decision.

Some say that market volatility will grow alone guide the growth of the index values. And if the index values are low, the market will remain stable, while any expectations of volatility surges or some malfunctions in the global economy will be useless.

For example, in March 2020, the index values rose extremely high, reaching the level of 2008 when the world got immersed in a tremendous economic crisis. Indeed, the beginning of 2020 was rather unstable, and investors were pretty scared, which resulted in a serious slump of stocks.

Now it is clear that while the market is falling deeper and deeper, panic and uncertainty among investors only grows, and VIX values rise. With VIX, you can try catching the beginning of panic as well as its potential end and start buying cheaper shares without any hurry.

How to trade VIX?

Most often, the fear index is invested in via ETFs or ETNs. Let us focus on some of the instruments.

ProShares VIX Short-Term Futures ETF (VIXY)

This is a rather popular instrument among other ETFs. It represents the volatility dynamics of VIX based on the S&P 500 VIX Short-Term Futures Index, which, in turn, consists of a set of short-term VIX futures.

However, I would recommend VIXY to experienced investors only. As a rule, when the investor understands well what they need, they either try to make a profit on the growth of the S&P 500 volatility or hedges from a significant market slump.

iPath B S&P 500 VIX Short-Term Futures ETN (VXX)

This one is a popular instrument among ETNs. It offers an access to a daily moving long position in VIX futures of the first and second month. VXX represents expectations of investors about the future direction of VIX at the moment when its futures expire.

The asset is volatile, and its movements can reach 10% a day, but high risks mean high potential profit that might be interesting for aggressive traders. Note that VIX movements may have no correlation with VXX, there is a certain lag.

Traders also note that VXX does not suit long positions but it still has negative correlation with the S&P 500. Hence, in large corrections, traders can make money on the growth of volatility with iPath B S&P 500 VIX Short-Term Futures ETN (VXX).

Closing thoughts

In essence, VIX represents the volatility of the US stock market. If its values rise high, investors are afraid of an approaching market correction. And if VIX values are low, this means investors are confident about future market growth.

Note that investments in VIX are thought to be risky, recommended to short-term and aggressive investors only. The "buy and hold" principle is useless here, you will have to keep tracking trades and market behavior on the whole to avoid serious losses.

The best time to invest in volatility is a financial crisis because market players will freak out and sell their assets, which will provoke the growth of volatility and a surge in VIX.

Do not forget about derivatives, such as ETFs and ETNs: they are available and east to sell and buy as any stocks in the marke.

Read more at R Blog - RoboForex

Sincerely,
RoboForex team
 
Dear traders!

This new week, the RoboForex company's project called ContestFX will, as usual, continue with the following competitions:

The 124th competition of "Demo Forex" is reaching its end.
The 320th competition of "Week with CFD" has started today.
453rd competition of "Trade Day" will start on 28.07.2021 at 12:00 at 20:00.
369th competition of "KingSize MT5" will start on 29.07.2021 at 20:00.

We remind you that for winning any of our competitions we present winners with the prizes in the form of real money to their real trading accounts, which they can use in trading in the Forex market without investing personal savings as an initial deposit.

Do not miss your chance!

Sincerely,
RoboForex Contest
 
Best Medium-term Strategies: Larry Williams's Moving-Average Based Strategy

Author: Timofey Zuev

roboforex-header.jpg


Dear Clients and Partners,

Larry Williams described this strategy in his book "Long-term Secrets to Short-term Trading". It suits both Forex and other financial markets. With timeframes, things are more complicated: technically, the strategy suits TFs from M1 to MN but as long as from opening to closing the position more than one candlestick can pass, trading on small TFs can be unprofitable due to fixed spreads, like in Forex.

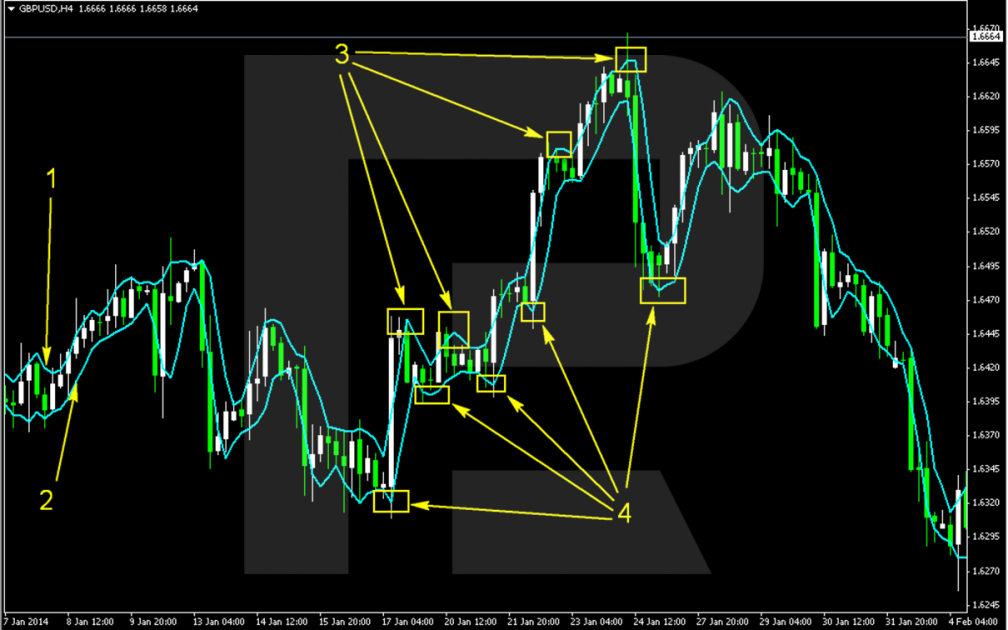
The desktop of Larry Williams strategy

1-1008x630.png


Explications:
  1. A Simple Moving Average drawn through High.
  2. A Simple Moving Average drawn through Low.
  3. Local highs of the SMA (High).
  4. Local lows of the SMA (Low).
As a result, we get a channel that will work by a special algorithm along the prevailing trend. The prevailing trend is the one that has recently renewed local extremes of the MAs. If the highs have been renewed, the trend is ascending; if the lows have been renewed, the trend is descending.

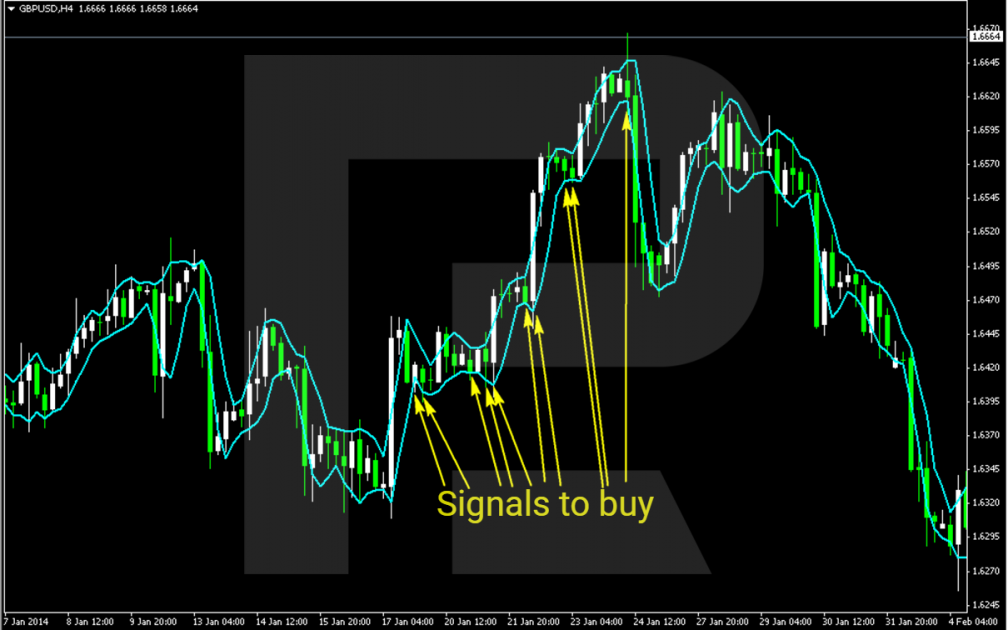
Signals to buy by the strategy

Larry Williams suggests the following conditions for buying: in an uptrend, open a position when the price touches the SMA (Low) and close it when the price touches the SMA (High). As soon as one trade is closed, open another one and keep going until the trend changes to descendin. If a signal to buy coincides with a trend reversal, skip the signal and start trading when the trend becomes ascending again.

An example of signals to buy:

2-en-1008x630.png


Note that in the picture, there are several buying opportunities, but keep in kind that only one position must be opened and closed before you open the next one.

Read more at R Blog - RoboForex

Sincerely,
RoboForex team
 
Back
Top