Vlad RF
RoboForex Representative
- Messages
- 487
How to Use Accumulative Swing Index in Trading
Author: Victor Gryazin

Dear Clients and Partners,
This article explains what Accumulative Swing Index is, what signals it gives, how it is calculated and set up in a trading terminal, and, naturally, how it is used in trading.
What Accumulative Swing Index shows
Accumulative Swing Index (ASI) was invented and made popular by a famous trader, financial analyst, and creator of several other indicators Wells Wilder. He described the work of ASI in detail in his book New Concepts in Technical Trading Systems, published in 1978.
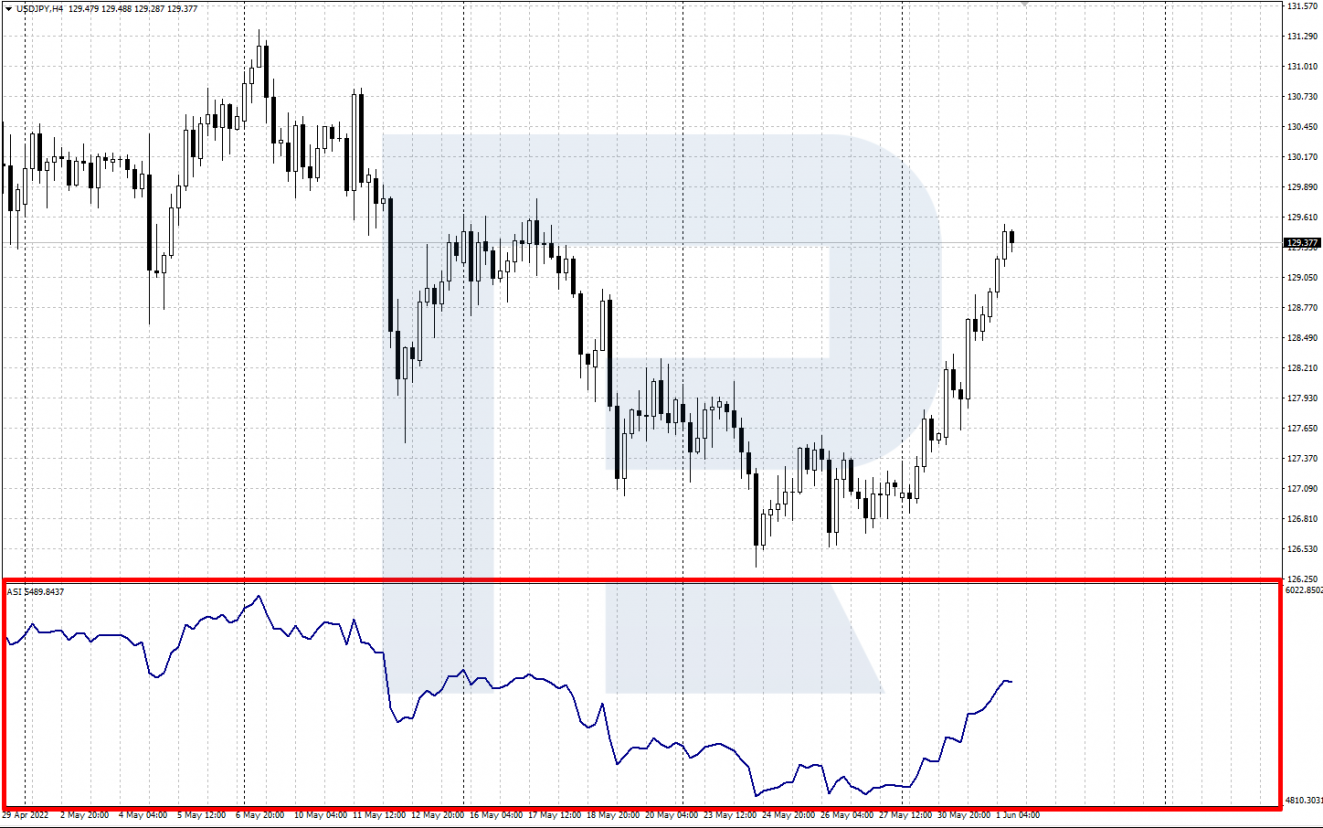
For calculating ASI, prices of the current and preceding timeframes are used – Close, Open, High, Low. The results help to assess current price dynamics of the instrument in question. The indicator appears in a separate window under the price chart and looks like one main line.
The line allows seeing the direction of the current market trend and confirms (or not) breakaways and bounces off the support/resistance levels on the chart. Growing ASI confirms an actual uptrend and falling ASI indicates a downtrend.
How to install Accumulative Swing Index to trading terminal
Accumulative Swing Index is not among standard indicators in most trading terminals, which means to use it in MetaTrader 4, one needs to download the installation file and install the indicator. The file can be found on, for example, MetaQuotes Ltd.
This is how ASI is installed on MetaTrader 4: Main Menu – File – Open data catalogue – MQL4 – Indicators – paste the file to the folder – restart the terminal.
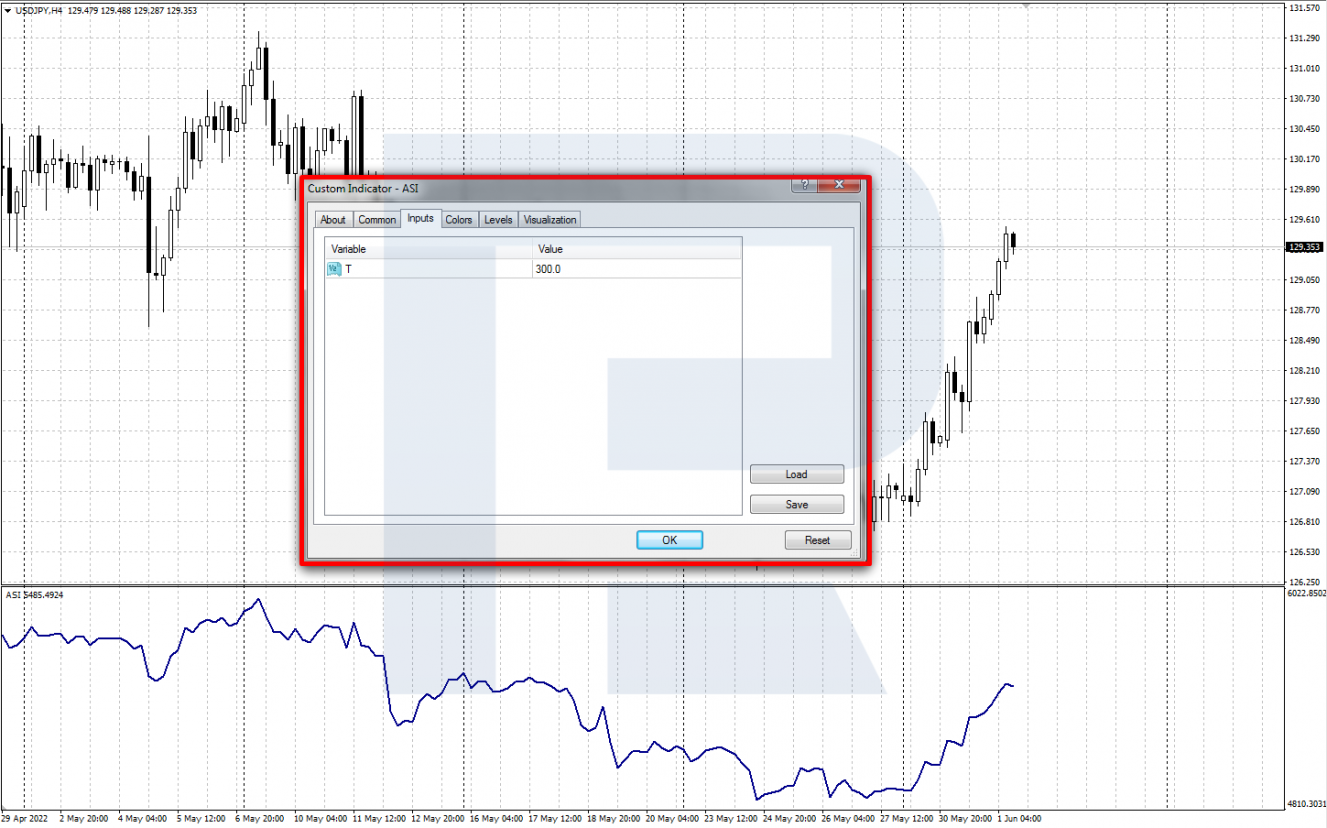
This is how ASI is added to the price chart: Main Menu – Insert – Indicators – User – ASI.
Accumulative Swing Index is normally used with preset parameters (variable T = 300).
Closing thoughts
Accumulative Swing Index is a price change indicator created by a famous market guru Wells Wilder. ASI helps to determine the direction of the current market trend and can become a good support to complex technical analysis.
For trading with the indicator, divergences and confirmations of support/resistance lines breakaways can be used. Before applying the signals for real, practising on a demo account is highly advisable.
Read more at R Blog - RoboForex
Sincerely,
RoboForex team
Author: Victor Gryazin
Dear Clients and Partners,
This article explains what Accumulative Swing Index is, what signals it gives, how it is calculated and set up in a trading terminal, and, naturally, how it is used in trading.
What Accumulative Swing Index shows
Accumulative Swing Index (ASI) was invented and made popular by a famous trader, financial analyst, and creator of several other indicators Wells Wilder. He described the work of ASI in detail in his book New Concepts in Technical Trading Systems, published in 1978.
For calculating ASI, prices of the current and preceding timeframes are used – Close, Open, High, Low. The results help to assess current price dynamics of the instrument in question. The indicator appears in a separate window under the price chart and looks like one main line.
The line allows seeing the direction of the current market trend and confirms (or not) breakaways and bounces off the support/resistance levels on the chart. Growing ASI confirms an actual uptrend and falling ASI indicates a downtrend.
How to install Accumulative Swing Index to trading terminal
Accumulative Swing Index is not among standard indicators in most trading terminals, which means to use it in MetaTrader 4, one needs to download the installation file and install the indicator. The file can be found on, for example, MetaQuotes Ltd.
This is how ASI is installed on MetaTrader 4: Main Menu – File – Open data catalogue – MQL4 – Indicators – paste the file to the folder – restart the terminal.
This is how ASI is added to the price chart: Main Menu – Insert – Indicators – User – ASI.
Accumulative Swing Index is normally used with preset parameters (variable T = 300).
Closing thoughts
Accumulative Swing Index is a price change indicator created by a famous market guru Wells Wilder. ASI helps to determine the direction of the current market trend and can become a good support to complex technical analysis.
For trading with the indicator, divergences and confirmations of support/resistance lines breakaways can be used. Before applying the signals for real, practising on a demo account is highly advisable.
Read more at R Blog - RoboForex
Sincerely,
RoboForex team