Solid ECN | Daily Technical | Video | Major Products

NZD/USD
Technical Forecast


NZD USD is trading just above a fresh low for the month after prices fell sharply overnight. Prices continue to trade within the December range, with the 23.6% Fibonacci retracement providing a level of support.

A break below that would expose the December low at 0.670. If that level breaks, prices may resume the downward trend seen back in November. Alternatively, a rebound will have bulls looking to overtake the falling 26-day Exponential Moving Average.​

nzdusd_forecast_712022.png
 
GBPUSD
Correcting, but Growth may Resume​


Current trend
The GBP/USD pair is confidently recovering its positions, adjusting to the mid-term downward trend. During the week, the price tested the 1.355 level, but could not break through it, as the US currency received support after the release of positive employment data and the publication of the minutes of the last meeting of the US Fed. According to the document, the regulator can start raising the interest rate much faster than previously planned, since the national labor market is close to full employment, and the inflation growth is protracted (the December employment indicator from ADP increased from 505K to 807K).

Nevertheless, the downward correction in the asset may be temporary, since the pound quotes are supported by the decision of the British authorities to abandon strict quarantine measures against the background of another wave of coronavirus in the country. During the week, British Prime Minister Boris Johnson once again stated that the current restrictions are sufficient to overcome the consequences of the pandemic, however, it already has a short-term negative effect on the economy. Thus, according to Springboard analysts, the number of customers in British stores decreased by 18.6% in December, as citizens minimized contacts, fearing to become infected with the new Omicron strain, and many of them were forced to work from home. As a result, sales volume, which usually grows before the New Year holidays, may decrease significantly, which, in turn, will slow down the recovery of the national economy. It also should be noted that in December, the index of business activity in the UK services sector decreased from 58.5 to 53.6, which was less than 53.2 expected by the market.

Support and resistance
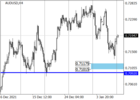
The key level for the “bulls” remains of 1.355, Fibo retracement 38.2%. Fixing above it will give the prospect of growth to 1.3672,(Fibo retracement 50.0%) and 1.3794 (Fibo retracement 61.8%). It will be possible to talk about a serious decline in quotes in case of a breakdown of 1.3428(Fibo retracement of 23.6%) and the middle line of the Bollinger Bands with targets at 1.3306 and 1.3184.

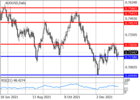
The upward movement of the Bollinger Bands and the growth of the MACD histogram in the positive zone indicate the continuation of the upward trend, but the downward reversal of the Stochastic does not exclude the continuation of the decline.

Resistance levels: 1.3550, 1.3672, 1.3794.
Support levels: 1.3428, 1.3306, 1.3184.​

gbpusd_712022.png
 
USDCAD
Technical Analysis​


Current trend
The USD/CAD pair continues to trade within a wide ascending channel. In the middle of last month, the price reached the area of 1.2939, but could not break through higher and began to decline.

Currently, the instrument is testing 1.2695, (Fibo retracement 23.6%), the breakdown of which will allow the quotes to decline to the levels of 1.2575 (Fibo retracement 38.2%) and 1.2480 (the lower limit of the ascending channel, Fibo retracement 50.0%). The level of 1.2939 is still the key one for the "bulls". In case of its breakout, the growth will be able to continue to the levels of 1.3062 and 1.3184 (the upper line of the ascending channel).

In general, the mid-term uptrend in the asset remains, but technical indicators do not exclude a correction within its framework: Stochastic is trying to reverse down, the MACD histogram is preparing to move into the negative zone and form a sell signal.

Support and resistance
Resistance levels: 1.2939, 1.3062, 1.3184.
Support levels: 1.2695, 1.2575, 1.2480.​

usdcad_technical analysis_712022.png
 
USDCAD
USD Remains Under Pressure​


Current trend
During the Asian session, the USD/CAD pair shows ambiguous trading dynamics, consolidating near the level of 1.2650 around the local lows of December 8.

The American currency remains under moderate pressure after publishing ambiguous statistics on the US labor market for December last Friday. In particular, the number of new jobs amounted to only 199K, having fallen from the previous 249K, although the market forecasts assumed a steady growth of 400K. The published data are slightly at odds with the earlier released minutes of the US Federal Reserve, in which the American regulator tried to take a tougher stance about the reduction of existing incentives.

In turn, the corresponding Canadian report, published at the same time as the American one, was a little more optimistic. The employment indicator for December slowed down from 153.7K to 54.7K but was much better than experts' expectations of 27.5K. At the same time, the unemployment rate, as in the case of the United States, fell from 6% to 5.9%.

Support and resistance
On the daily chart, Bollinger bands steadily decline. The price range expands but not as fast as the "bearish" dynamics develop. The MACD indicator is going down, maintaining a strong sell signal (the histogram is below the signal line). Stochastic maintains a confident downward trend, but it is near its lows, signaling the dollar may become oversold in the ultra-short term.

Resistance levels: 1.2700, 1.2743, 1.2777, 1.2812.
Support levels: 1.2600, 1.2558, 1.2500, 1.2450.​

usdcad_1012022.png
 
AUD/USD
Positive statistics support the instrument​


Current trend
The AUD/USD pair trades above the level of 0.7158, supported by the macroeconomic statistics.

Thus, the number of preliminary building permits in Australia rose by 3.6%, despite the forecast of 3.2%. The previous value was revised downward to –13.6%. Investors expect the November retail sales data to be released tomorrow at 02:30 (GMT+2). According to forecasts, it will amount to 3.9%. Positive economic data from Australia temporarily restrain the trading instrument from further decline, leaving a chance for the "bulls" to break through the level of 0.7265.

Additional support to the asset was provided by publishing data on the US labor market last Friday. December Nonfarm Payrolls amounted to 199K against the forecast of 400K, but the previous figure was corrected upward from 210K to 249K. Unemployment decreased again and amounted to 3.9%, although analysts had forecast a decline of 0.1% to 4.1%.

On the other hand, Australia is starting to vaccinate children aged 5–12 years after the number of infections increased significantly on New Year's holidays, exceeding 116K cases per day. The virus forces Queensland to postpone its annual school reopening by a month until early February. The epidemiological situation is worsening, although politicians cite positive scientific studies on the effect of the Omicron strain on mortality to maintain optimism. For a while, it may support buyers of the Australian dollar, but given the planned rate hikes by the US Federal Reserve in 2022, the pair's growth looks limited.

Support and resistance
The long-term trend is downwards. In December, the pair gained support at 0.6995, after which it started an upward correction, within which it tested the resistance level of 0.7265. If this level is held, the fall will continue with the target at the December low.

The medium-term trend is upwards towards the target zone 2 (0.7329–0.7313). Last week, the price corrected, approaching the key support for the trend around 0.7117–0.7101. After the test of key support, it is worth opening long positions.

Resistance levels: 0.7265, 0.7457, 0.7541.
Support levels: 0.7158, 0.6995, 0.6830.​
 

Attachments

  • audusd_analysis_1.png
    audusd_analysis_1.png
    15.9 KB · Views: 1
  • audusd_analysis_2.png
    audusd_analysis_2.png
    21.8 KB · Views: 1
BTC is losing ground amid events in Kazakhstan


Current trend
Last week, the BTC/USD pair continued to decline and tested the level of 41000.00.

The instrument was pressured by two negative factors – the publication of the minutes of the last meeting of the US Federal Reserve, filled with the “hawkish” rhetoric, and the events in Kazakhstan. In the minutes of the American regulator, it was noted that it could start raising rates earlier than planned, as the factors of inflation growth in the country persist. Experts believe that the first increase may take place in March, and the December positive data on the US labor market only strengthens confidence in this. The prospect of an imminent tightening of monetary policy puts pressure on alternative assets, including digital ones.

Events in Kazakhstan, where more than 18% of the world's cryptocurrency mining is concentrated, led to a decrease in the activity of large mining pools and a decrease in the BTC hash rate by 12%. Currently, the situation is normalizing, however, the first cryptocurrency does not receive the necessary support to restore lost positions.

Support and resistance
The key “bearish” level is 41000.00. Its breakdown allows further decline to 37500.00 (Murrey [–2/8]). The breakout of 43750.00 (Murrey [–1/8]) allows growth to 46400.00 (middle line of Bollinger bands) and 50000.00 (Murrey [0/8]). The continuation of the decline seems more likely since the reversal of Bollinger bands downward and the increase in the MACD histogram in the negative zone indicate that the downtrend continues. Stochastic's exit from the oversold zone does not exclude an upward correction but its potential seems limited.

Resistance levels: 43750.00, 46400.00, 50000.00.
Support levels: 41000.00, 37500.00.​

btcusd_technical analysis.png
 
Gold
Traders prefer bond​


Current trend
Gold quotes continue to trade near the psychological level of 1800.0, correcting in a downtrend. Serious fluctuations in the asset are unlikely in the near future.

Investors are awaiting concrete action from the US Fed, and the movement in XAU/USD is likely to begin after the start of the interest rate hike cycle. The change in the volume of the quantitative easing (QE) program does not have a strong impact on the price of the precious metal, so traders will wait for more serious drivers to appear, leaving part of their capital in bonds, which now show a higher yield than gold. For example, since January 1, the yield on 10-year US bonds has grown from 1.512% to 1.765%, and gold quotes during this period have decreased from 1830 to 1792 dollars per ounce.

According to the Commodity Futures Trading Commission (CFTC), the number of investor positions in gold last week fell to 211.4K from 213.2K a week earlier. This distribution confirms the fact that there are now much more interesting assets for investors than metals, which have not actually changed the current trend since last summer.

Support and resistance
On the daily chart, the price is trading within the global sideways channel, moving towards the lower border. Technical indicators are ready to reverse and give a signal for the start of sales: fast EMAs have reached the signal line with a readiness to cross it, and the histogram of the AO oscillator is forming descending bars, quickly approaching the transition level.

Support levels: 1770.0, 1725.0.
Resistance levels: 1831.0, 1870.0.​

gold_technical analysis.png
 
USD/JPY Wave Analysis

The pair may grow.
On the daily chart, the third wave of the higher level 3 of (1) develops, within which the first wave of the lower level i of 3 formed, a correction developed as the second wave ii of 3, and the third wave iii of 3 develops. Now, the third wave of the lower level (iii) of iii has formed, a local correction has ended as the wave (iv) of iii, and the fifth wave (v) of iii is developing. If the assumption is correct, the pair will grow to the levels of 118.00–120.60. In this scenario, critical stop loss level is 113.10.​

usdjpy_wave analysis_11122_#1.pngusdjpy_wave analysis_11122_#2.png
 
XAG/USD Elliot Wave Analysis

The pair may grow.

On the daily chart, the first wave of the higher level (1) of 3 formed, a downward correction developed as the wave (2) of 3, and the development of the third wave (3) of 3 started. Now, the first wave of the lower level i of 1 of (3) has formed, a local correction has developed as the wave ii of 1, and the formation of the wave iii of 1 has started, within which the development of the wave (iii) of iii has started. If the assumption is correct, the price will grow to the levels of 26.76–28.68. In this scenario, critical stop loss level is 21.40.​

silver_wave analysis_1.pngsilver_wave analysis_2.png
 
ETH/USD, Technical Analysis


Current trend
Last week, ETH/USD continued to decline and reached four-month lows around 3125.00 (Murray [2/8]), while leaving the descending channel. Further movement of quotations is likely to continue to the levels of 2812.50 (Murray [1/8]) and 2500.00 (Murray [0/8]).

In general, the downtrend in the asset remains, which is confirmed by the downward reversal of Bollinger Bands and the increase in the MACD histogram in the negative zone; however, the reversal of Stochastic from the overbought zone does not exclude an upward correction. In case of a breakout of the lower border of the descending channel in the area of 3270.00, the trend is likely to change to the levels of 3540.00 (Fibonacci retracement 61.8%, the center line of Bollinger Bands) and 3750.00 (Fibonacci retracement 50.0%, Murray [4/8]). Nevertheless, a decline in quotations is the most likely scenario at the moment.

Support and resistance
Resistance levels: 3270, 3540, 3750
Support levels: 3125, 2812, 2500​

ethusd_technical analysis.png
 
Back
Top