Solid ECN | Daily Technical | Video | Major Products

eurusd-forum-1.png


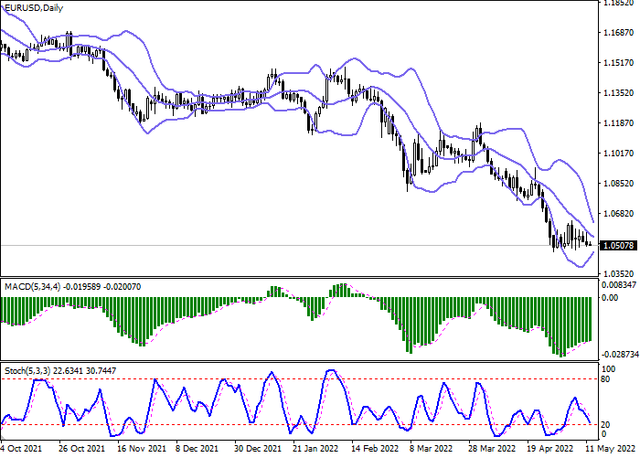
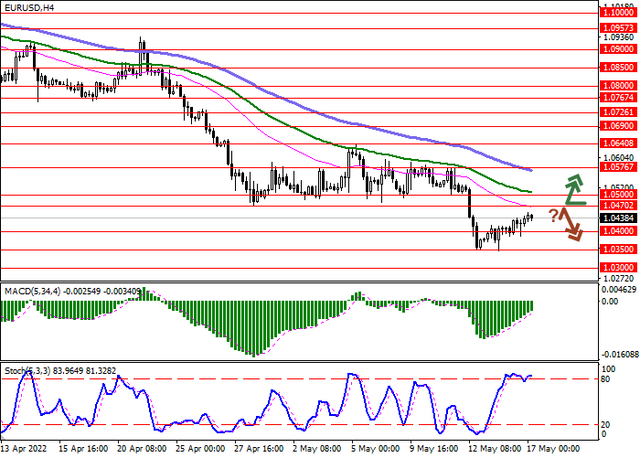
The European currency traded with mixed dynamics against the US dollar during the Asian session, consolidating near 1.05. The day before the euro made an attempt to grow, having received support from the optimistic statements of the President of the European Central Bank (ECB), but the "bulls" failed to consolidate on new local highs. EURUSD eventually returned to the "red" zone, continuing the development of flat dynamics in the short term.

The European regulator is likely to complete the asset buyback at the beginning of Q3 2022, after which it will start raising the interest rate. This was stated by the ECB President Christine Lagarde the day before, speaking in Ljubljana. Last month, officials continued their "dovish" policy from 2011 and left the interest rate on the main refinancing operations, the rate on the deposit facility and the rate on the marginal lending facility at 0.00%, -0.50% and 0.25%, respectively. Experts believe that the ECB will increase the figures in July and September, and bring the deposit rate to 1.5% within two years. However, much will depend on the development of the military conflict in Ukraine, where the situation is still extremely tense.

Meanwhile, Hungary announced its readiness to impose an embargo on Russian resources, but the Minister of Foreign Affairs and Trade, Péter Szijjártó, voiced a number of demands. In particular, he noted that the country expects concrete measures from the EU to reduce the negative consequences for the national economy if a decision is made. According to Szijjártó, official Budapest will support the pan-European embargo if it does not concern oil pipelines. Now about 65% of oil from Russia comes through the Druzhba pipeline, and the Hungarian economy does not yet have alternative options for replacing these resources.

Macroeconomic statistics from Europe published on Wednesday did not have a noticeable impact on the instrument's dynamics. Consumer Price Index in Germany in April showed an increase of 0.8%, which also fully coincided with market expectations. In annual terms, inflation fixed at around 7.4%.

eurusd-1.png


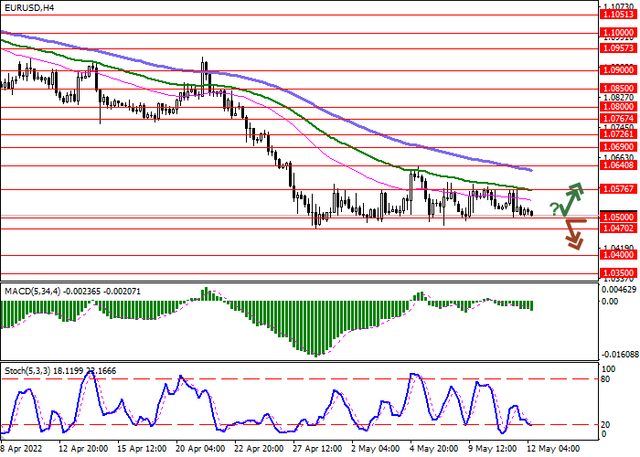
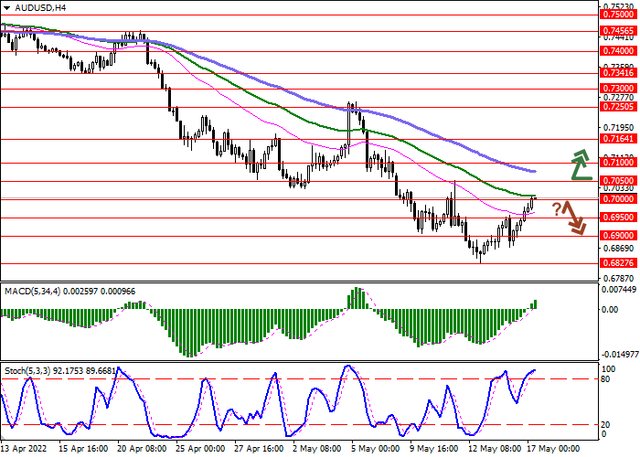
Bollinger Bands on the D1 chart still maintain a moderate downward direction. The price range is actively narrowing, reflecting the emergence of multidirectional trading dynamics in the short term. MACD is growing preserving a weak buy signal (located above the signal line). Stochastic, on the contrary, keeps its downward direction, indicating the predominance of "bearish" sentiment in the ultra-short term.

To open new trading positions, it is necessary to wait for the signals from technical indicators to be clarified.

Resistance levels: 1.0576, 1.064, 1.069, 1.0726 | Support levels: 1.05, 1.047, 1.04, 1.035

eurusd-2.png
 
gbp-forum-1.png


The British pound shows an uptrend in trading, correcting after another decline the day before, as a result of which GBPUSD updated its lows since May 2020. The growth of the pound on Friday is due to the strengthening of technical factors, while the fundamental picture changes slightly and still contributes to the further weakening of the British currency.

gbpusd-1.png


Due to the difficult situation in the labor market, the disruption of product supply chains, as well as rising energy prices, the cost of living crisis will affect about 1 million Britons, the National Institute for Economic and Social Research (NIESR) has calculated. According to the data presented, inflation in the country may accelerate to 14.4% by the end of this year, reaching 40-year peak levels. Against this background, about 250K people may find themselves in extreme poverty, and the economy itself may go into recession. To solve the problem, concrete measures of assistance from the government, totaling 4.2 billion pounds, will be required.

gbpusd-2.png


Bollinger Bands in D1 chart demonstrate a stable decrease. The price range is changing slightly, but remains rather spacious for the current level of activity in the market. MACD is trying to reverse upwards but preserves its previous sell signal (located below the signal line). Stochastic has been located in close proximity to its lows for quite a long time, which points to the risk of oversold GBP in the ultra-short term.

Resistance levels: 1.225, 1.24, 1.25, 1.26 | Support levels: 1.2163, 1.2074, 1.2, 1.19
 
usdjpy-forum-2.png


The US dollar is slightly declining against the Japanese yen in Asian trading, once again trying to consolidate below 129.00. The positions of the American currency are under some pressure after the publication of disappointing macroeconomic statistics last Friday. In addition, traders are in a hurry to close long positions in the asset, fearing a corrective decline in the US government bonds, which retreated from their record highs at the end of last week.

The Japanese currency is supported today by the statistics from Japan on producer inflation. Producer Price Index accelerated in April from 0.8% to 1.2%, which turned out to be stronger than analysts' neutral forecasts. The Producer Price Index for corporate goods over the same period YoY strengthened from 9.5% to 10%, while the market expected a slight decline to 9.4%.

Last week it became known that Japan and the United States will develop cooperation in the field of research and production of semiconductors. It is predicted that the partnership agreement will be signed during the meeting scheduled for May 23. This will allow Japan to reduce its dependence on supplies from South Korea and Taiwan. In addition, the parties will work on projects in the defense, space, and cyberspace sectors. At the moment, the Japanese government intends to adjust the defense budget, increasing it to 106 billion dollars and bringing it to 2% of Gross Domestic Product against the backdrop of growing geopolitical tensions from China, North Korea and Russia, as well as the escalation of the military conflict in Ukraine.

usdjpy-1.png


On the D1 chart, Bollinger Bands are gradually reversing horizontally. The price range is narrowing actively, reflecting the emergence of ambiguous dynamics of trading in the short term. MACD is going down preserving a stable sell signal (located below the signal line). At the same time, the current indicator readings weakly correlate with real market dynamics. Stochastic stopped the development of the "bearish" dynamics near the level of "20", indicating the emergence of multidirectional trading in the ultra-short term.

To open new positions, it is necessary to wait for the trade signals to become clear.

Resistance levels: 129.39, 130.00, 130.79, 131.33 | Support levels: 128.62, 127.5, 127, 126.3

usdjpy-2.png
 
usdchf-forum-1.png


The US dollar is confidently leading the pair with the Swiss franc, and the current growth already claims to be the most significant since the fall of 2010, when USDCHF exchange rate strengthened by more than 20K points in two months. Now the quotes of the trading instrument are in the area of 1.0027.

One of the main reasons for the rapid uptrend is the negative situation with the increase in prices for products within the country. According to a recent report, the Swiss Producer Price Index added 1.3% in April to 108.4 points, well above 100.0 of early last year. The main increase in prices was observed for oil products and metallurgy products. Compared to March 2021, inflation across the entire product line was 6.7%, a significant jump for the conservative Swiss economy.

The American currency is trading steadily above the level of 104.000 in the USD Index, continuing to ignore the negative macroeconomic statistics and strengthening against the background of statements by the US Federal Reserve, as well as the head of the White House. The day before, Joe Biden said that the US government intends to reduce the budget deficit by 1.5 trillion dollars. The decision should help reduce inflationary pressures, while the US president did not specify what steps the authorities would take. In February of this year, the federal debt exceeded 30 trillion dollars and amounted to 30.012 trillion dollars.

usdchf.png


On the global chart of USD/CHF, the price is trading in an active uptrend. Technical indicators are in the state of a stable buy signal, indicating a likely continuation of growth: fast EMAs on the Alligator indicator are above the signal line, and the AO oscillator histogram is increasing in the buy zone.

Support levels: 0.9935, 0.9718 | Resistance levels: 1.0050, 1.0200​
 
eurusd-forum-1.png


The European currency shows a mixed dynamics of trading against the US dollar during the Asian session, consolidating near 1.044 and expecting new drivers to appear on the market. The day before, the euro showed weak growth, continuing the development of Friday's momentum, which allowed the instrument to retreat from record lows since January 2017.

In the meantime, the news and macroeconomic background remained quite negative, and the reasons for the growth of the instrument were mainly technical factors. Yesterday's data from Europe somewhat disappointed buyers; however, in general, they didn't influence the situation on the market much. The eurozone Trade Deficit in March amounted to 17.6 billion euros, which turned out to be significantly worse than last month's data (-11.3 billion euros) and forecasts that suggested an improvement in dynamics to -6.6 billion euros.

Today, investors are focused on the updated statistics on the dynamics of GDP in the euro area for Q1 2022. Earlier data indicated that the European economy grew by 0.2% QoQ and 5% YoY. Also during the day, quarterly Employment statistics will be published and a speech by the President of the European Central Bank (ECB) Christine Lagarde will take place, where the official is likely to correct the regulator's forecasts regarding the vector of monetary policy in the near future.

eurusd-1.png


In the D1 chart, Bollinger Bands are reversing horizontally. The price range is slightly widening from below but does not conform to the surge of the "bearish" sentiment of the end of the previous week yet. MACD indicator is growing, having formed a new buy signal (located above the signal line). Stochastic is showing similar dynamics, having rebounded from the level of "20" and signaling in favor of the development of corrective growth in the ultra-short term.

Resistance levels: 1.047, 1.05, 1.0576, 1.064 | Support levels: 1.04, 1.035, 1.03, 1.025

eurusd-2.png
 
audusd-forum-1.png


The Australian dollar shows active growth against the US currency during trading in Asia, testing a strong psychological barrier at the level of 0.7000. AUD/USD renews local highs from May 11, although yesterday the Australian dollar showed a sharp drawdown, which was caused by the publication of disappointing macroeconomic statistics from China.

Retail Sales in China fell sharply by 11.1% in April after falling by 3.5% a month earlier, although analysts had expected a decline of 6%. The pace of Industrial Production in the country in April showed a decline of 2.9% after rising by 5% in March. The forecasts assumed that positive dynamics would remain at the level of 0.7%.

The Australian dollar is being supported today by the minutes of the meeting of the Reserve Bank of Australia (RBA). The regulator was rather optimistic about the prospects for inflation, noting that it is likely to return to target levels as external risks stabilize. Representatives of the department expect that by mid-2024, consumer prices may fall to the upper limit of the indicated range of 3%. As for interest rates, the RBA expects them to increase further to 1.5% by the end of 2022 and to 2.5% by the end of 2023.

audusd-1.png


On the D1 chart, Bollinger Bands are gradually reversing horizontally. The price range is narrowing from above, remaining spacious enough for the current activity level in the market. MACD indicator is growing having formed a stable buy signal (located above the signal line). Stochastic shows similar dynamics, quickly approaching its highs and reflecting the risks of overbought Australian dollar in the ultra-short term.

Resistance levels: 0.7, 0.705, 0.71, 0.7164 | Support levels: 0.6950, 0.69, 0.6827, 0.675

audusd-2.png
 
gbpusd-forum-1.png


The pair may continue to decline
Against the backdrop of a depreciation of the American currency, the GBPUSD pair is correcting within the local trend around 1.2343.

Today the pressure on the pound may be exerted by data on the labor market in the UK for April. According to statistics, the unemployment rate was 3.7%, down from 3.8% in March. The level of labor productivity remained around 0.7%. It is worth noting another reduction in the number of applications for unemployment benefits, which decreased by 56.9K, after a decrease of 46.9K a month earlier. Thus, it becomes obvious that the growth rate of the UK economy is not as high as previously expected, which negatively affects the national currency.

The main driver of yesterday's asset growth was the US dollar, which in the index fell by half a point, reaching 104.200 amid the publication of a renewed forecast for the growth of the US economy for 2022 and 2023. According to the new forecast of The Goldman Sachs Group Inc., due to the serious tightening of monetary policy, GDP for 2022 was lowered to 2.4% from 2.6% in the previous forecast, and GDP for 2023 was lowered to 1.6% from 2.2% before. Also, investors could react negatively to the NY Empire State report, according to which the index of manufacturing activity in the US fell to 11.60 points in May from 24.60 points in April.

gbpusd.png


The asset has left the global downstream channel and is currently completing a reverse test of the passed support. Technical indicators keep a sell signal: indicator Alligator's EMA fluctuations range is still quite wide, and the histogram of the AO oscillator is trading deep in the sell zone.

Resistance levels: 1.245, 1.3 | Support levels: 1.216, 1.19​
 
GBPUSD, the pound is consolidating at local highs

The British pound is trading with mixed dynamics against the US currency during the morning session, holding in the area of local highs from May 5 and resistance at around 1.2500.

The pound was supported the day before by strong data on the UK labor market for March-April. Claimant Count Change in April decreased by 56.9 thousand after falling by 81.6 thousand a month earlier. Analysts expected a decline of only 38.8 thousand. The Average Earnings Excluding Bonus accelerated in March from 4.1% to 4.2%, which coincided with experts' estimates. The Average Earnings Including Bonus accelerated its growth from 5.6% to 7.0%, which turned out to be significantly better than the market's expectations of a slowdown to 5.4%. ILO Unemployment Rate in the UK in March fell from 3.8% to 3.7% with neutral forecasts.

Today, investors are awaiting the publication of statistics on consumer inflation for April. Current forecasts suggest a further acceleration of the indicator from 7% to a new record high of 9.1%. If market expectations are justified, pressure on the Bank of England may increase sharply, forcing the regulator to act more decisively on the issue of tightening monetary policy.

gbpusd-1.png


In the D1 chart, Bollinger Bands are reversing horizontally. The price range narrows slightly from above, but still remains spacious enough for the current level of market activity. MACD grows, preserving a stable buy signal (located above the signal line). Stochastic retains upward direction but is located near its highs, which indicates the risks of overbought instrument in the ultra-short term.

Resistance levels: 1.25, 1.26, 1.2674, 1.28 | Support levels: 1.24, 1.225, 1.2163, 1.21

gbpusd-2.png
 
USDCHF, the asset is back below 1
During the Asian session, the USDCHF pair shows a slight corrective growth, testing the level of 0.9940 for a breakout.

The instrument was actively declining yesterday, although the US macroeconomic background was quite optimistic. In particular, retail sales for April came out noticeably better than expected, reducing the risks that the US Federal Reserve will slow down the pace of monetary tightening.

Data from the EU attracted a little more attention from investors. Thus, the EU GDP for the first quarter of 2022 rose by 0.3% QoQ, which was better than the previous estimate of 0.2%. The growth rate of the European economy was also revised upward from 5% to 5.1% YoY. The employment rate increased from 2.2% to 2.6%.

The growth in demand for risky assets was also facilitated by news from China, where the authorities plan to finally lift quarantine restrictions on Shanghai from June 1 this year. The PRC continues to maintain a "zero tolerance" policy for COVID-19.

usdchf-1.png


On the daily chart, Bollinger bands are growing moderately. The price range is narrowing from above, reflecting the appearance of corrective dynamics in the ultra-short term. The MACD indicator is falling, forming a fairly strong sell signal (the histogram is below the signal line). Stochastic shows similar dynamics, being approximately in the center of its working area and signaling in favor of developing the "bearish" trend in the ultra-short term.

Resistance levels: 1, 1.005, 1.01, 1.015 | Support levels: 0.99, 0.9847, 0.977, 0.97

usdchf-2.png
 
usdjpy-forum-1.png


The US dollar shows moderate growth against the Japanese yen in Asian trading, recovering from the active decline the day before, which led to the renewal of local lows from May 12.

The instrument is testing 129.00 for a breakout, receiving support from good macroeconomic statistics from Japan. In particular, investors welcomed yesterday's data release, which reflected a weaker slowdown in the Japanese economy in Q1 2022. The GDP showed a decline of 0.2% QoQ and 1% YoY, while forecasts suggested a contraction of 0.4% QoQ and 1.8% YoY.

Today, the yen is supported by strong data on the Machinery Orders. In March, volumes rose by 7.1% MoM and 7.6% YoY, although analysts had projected a 3.7% increase in both figures. Only the data on the dynamics of exports were somewhat disappointing. In April, Exports from Japan slowed down from 14.7% to 12.5%, which turned out to be worse than the average analysts' forecasts of a decline to only 13.8%. With persistently high Imports (although they also sank from 31.2% to 28.2%), this led to an increase in the Trade Deficit from 1019 billion to 1618 billion Japanese yen.

usdjpy-2.png


In the D1 chart, Bollinger Bands are reversing horizontally. The price range expands from below, making way for new local lows for the "bears". MACD is going down preserving a stable sell signal (located below the signal line). Stochastic shows a more modest decline, reacting to the emergence of upward dynamics during the morning session on May 19.

Resistance levels: 129.39, 130, 130.79, 131.33 | Support levels: 128.62, 127.88, 127.5, 127

usdjpy-1.png
 
Back
Top