Solid ECN | Daily Technical | Video | Major Products

usdchf-forum-1.png


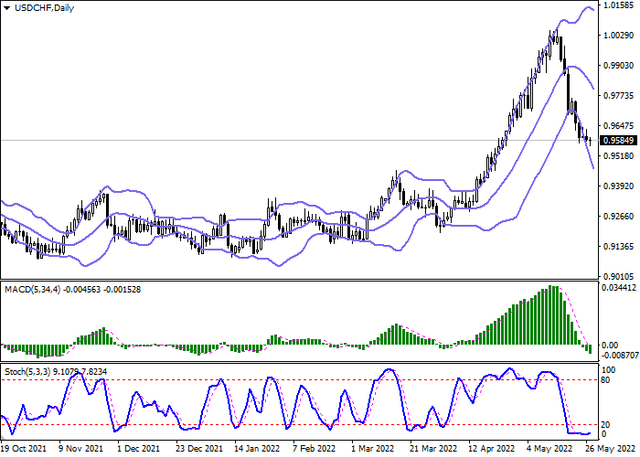
During the Asian session, the USDCHF pair is slightly corrected, renewing local lows from April 26. The asset is preparing to end trading with a fairly confident decline and continue the development of a strong "bearish" momentum formed last week.

The pressure on quotes is again exerted by uncertain US macroeconomic statistics, which increases the risk that the US Federal Reserve will break the interest rate hike cycle after its planned increase in June and July. Traders fear that the actions of financial regulators, which are due to the fight against high inflation, will lead to a noticeable slowdown in global economic growth. According to the revised data, the contraction of the US economy for the first quarter of this year amounted to 1.5%, which was 0.1% worse than the previous estimate.

On Friday, traders expect the publication in the US of April data on the dynamics of income and expenses of American citizens. Current forecasts suggest that revenue growth will remain flat at 0.5%, while spending could slow from 1.1% to 0.7%.

usdchf-1.png


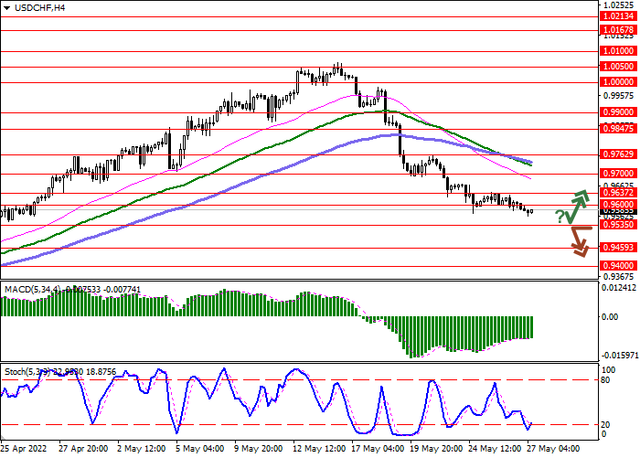
On the daily chart, Bollinger Bands are steadily declining: the price range expands, letting the "bears" renew local lows. The MACD indicator falls, keeping a strong sell signal (the histogram is below the signal line). Stochastic is close to its lows, signaling that USD may become oversold in the ultra-short term.

Resistance levels: 0.96, 0.9637, 0.97, 0.9762 | Support levels: 0.9535, 0.9459, 0.94, 0.93

usdchf-2.png
 
usdcad-forum-1.png


USDCAD, H4
On the four-hour chart, below the resistance level of 1.2875, there is the formation of successive Shooting Star candlestick analysis patterns, after which the asset showed a significant decrease. In the process of downward dynamics, the Three Black Crows pattern was formed, which is a model for the continuation of the "bearish" trend. Further decline of USDCAD to the nearest support level of 1.2654 is expected, fixing below which will allow the quotes to continue moving towards the area of 1.2558–1.247. An alternative scenario may be relevant in case the price breaks through the resistance level of 1.2771.

usdcad-1.png


USDCAD, D1
The daily chart shows the formation of a Head and Shoulders price pattern, the Neck line of which has been overcome. The quotes tested the broken level, forming an Evening Star candlestick analysis model at 1.2875. A confirming signal of price fixing is the formed Three Black Crows pattern of continuation of the downtrend. At the moment, under the level of 1.2733, it is possible to build a Bearish Belt Hold figure. In case of successful overcoming of the support level of 1.2654, the quotes will most likely continue their decline to the zone of 1.2558–1.247.

Support levels: 1.2654, 1.2558, 1.2470 | Resistance levels: 1.2771, 1.2875, 1.2973​
 
audusd-forum-1.png


The Australian dollar shows an uncertain decline, correcting after two sessions of fairly active growth, as a result of which AUDUSD updated local highs from May 5. The US dollar is trying to recover its positions, but so far the further decline of the instrument is limited by restrained optimism from China.

Tomorrow restrictions on the work of enterprises will be lifted in Shanghai, which will mean the end of the quarantine caused by another wave of coronavirus, which had an extremely negative impact on the supply of a number of high-tech products to world markets. The Beijing authorities are also partially easing the restrictions and gradually allowing the operation of some public transport and retail facilities. Optimism about the Chinese economy was also confirmed by macroeconomic publications from China. Non-Manufacturing PMI in May rose from 41.9 to 47.8 points, which, however, turned out to be worse than optimistic forecasts of an increase to 50.7 points. NBS Manufacturing PMI strengthened in May from 47.4 to 49.6 points, which coincided with the average market forecasts. In addition, investors reacted positively to the growth in Private Sector Credit in Australia in April from 0.4% to 0.8%, as well as the increase in Company Gross Operating Profits from 2% to 10.2% in Q1 2022.

audusd-1.png


Bollinger Bands on the daily chart show a steady increase. The price range is narrowed, being spacious enough for the current activity level in the market. MACD is growing, maintaining a strong buy signal (the histogram is above the signal line and is consolidating above the zero level). Stochastic reached its highs, which points to the risks of overbought Australian dollar in the ultra-short term.

Resistance levels: 0.7202, 0.725, 0.73, 0.7341 | Support levels: 0.715, 0.71, 0.705, 0.7

audusd-2.png
 
gbpusd-forum-1.png


The pound is trading with mixed dynamics during the morning session, consolidating near 1.2600. The day before, the British currency showed a moderate decline, retreating from its local highs of April 26, which was the market's reaction to the resumption of growth in the US dollar against the backdrop of fairly strong American macroeconomic statistics. In particular, investors drew attention to the increase in the S&P/Case-Shiller Home Price Indices in March from 20.3% to 21.2%, while the Chicago PMI rose from 56.4 to 60.3 points in May, with the analysts' forecast at the level of 55.0 points.

In turn, the macroeconomic background from the UK turned out to be mixed: the volume of Consumer Credit in April increased from 1.303 billion pounds to 1.399 billion pounds, with preliminary market estimates of a decline to 1.2 billion pounds. At the same time, the Mortgage Approvals over the same period decreased from 69.531 thousand to 65.974 thousand, which turned out to be noticeably worse than expected correction to 69.000 thousand.

gbpusd-1.png


Bollinger Bands in D1 chart show moderate growth. The price range is narrowing, reflecting the emergence of ambiguous dynamics of trading in the ultra-short term. MACD is gradually reversing into a downward plane, being located near the zero level and keeping the previous buy signal (the histogram is above the signal line). Stochastic shows similar dynamics, rapidly retreating from its highs, which signal that the pound is overbought in the ultra-short term.

Resistance levels: 1.2600, 1.2674, 1.2800, 1.2900 | Support levels: 1.2500, 1.2400, 1.2250, 1.2163

gbpusd-2.png
 
eurusd-forum-1.png


The European currency shows mixed trading dynamics against the US dollar, consolidating near 1.0650 after two sessions of decline, which led to the renewal of local lows from May 23.

Pressure on the euro has intensified since Tuesday after the release of inflation data for May in the eurozone. The Harmonised Index of Consumer Prices accelerated from 3.5% to 3.8%, which turned out to be higher than the market's neutral forecasts, and the Core Consumer Price Index in May updated a record at 8.1%, while analysts had expected only 7.7%. In addition, disappointing Retail Sales data in Germany were published yesterday: in April, in annual terms, the indicator fell by 0.4% after falling by 1.7% a month earlier, although preliminary market estimates assumed a positive dynamics at the level of 4.0%, and on a monthly basis, sales fell by 5.4% after rising by 0.9% in March.

In turn, some support for the single currency is provided by the expectations that the European Central Bank (ECB) will launch a cycle of raising interest rates. So far, the members of the regulator's board have not agreed on any specific timing for the start of tightening monetary policy, but it is clear that with the current price pressure, this will happen soon.

eurusd-1.png


Bollinger Bands in D1 chart show moderate growth. The price range is narrowing, reflecting appearance of multi-directional dynamics in the short term. MACD is reversing downwards forming a new sell signal (the histogram consolidated below the signal line). Stochastic is showing similar dynamics; however, the indicator line is rapidly approaching its lows, indicating the risks of EUR being oversold in the ultra-short term.

Resistance levels: 1.0700, 1.0747, 1.0800, 1.0850 | Support levels: 1.0640, 1.0600, 1.0500, 1.0459

eurusd-2.png
 
audusd-forum-1.png


During the Asian session, the Australian dollar is slightly declining, correcting after a sharp rise the day before, which led to a renewal of local highs from April 22. The quotes of AUDUSD were supported by not the most confident macroeconomic statistics from the US, which were released the day before. In particular, a report from Automatic Data Processing (ADP) reflected weaker growth in private non-farm payrolls in May, rising by just 128K from a 202K increase a month earlier, with experts forecasting 300K, slightly lowering investor expectations for the May US labor market report, which will be published today.

This week, The Australian published information about the readiness of the Chinese authorities to postpone the conclusion of security pacts with a number of island states in the Indo-Pacific region. The document concerns the laying of submarine cables, the construction of berths, the development of shipbuilding, as well as other areas of cooperation, including China's investment in the development of these regions. Experts believe that the country, to which the island states will join, will eventually gain control over the entire Pacific Ocean, and the Chinese authorities probably will not give up trying to conclude these agreements.

audusd-1.png


Bollinger Bands on the daily chart show a steady increase. The price range is expanding from above but it fails to conform to the surge of "bullish" activity at the moment. MACD grows, preserving a stable buy signal (located above the signal line). Stochastic, having approached its highs is reversing into a horizontal plane, indicating the overbought instrument in the ultra-short term.

Resistance levels: 0.7300, 0.7341, 0.7400, 0.7450 | Support levels: 0.7250, 0.7202, 0.7150, 0.7100

audusd-2.png
 
usdjpy-forum-1.png


Japan legalizes stablecoins
The US dollar shows a slight decrease in Asian trading, holding near 131 and local highs from May 9, having received a moderate upward impetus after the publication of a rather strong report on the US labor market for May last Friday. At the same time, statistics on business activity were slightly worse than market forecasts, as well as indicators of Average Wages and overall Unemployment. The data allow investors to hope for a continuation of the US Fed's "hawkish" policy of raising interest rates by 50 basis points at least during the June and July meetings.

The Bank of Japan, in turn, maintains a wait-and-see attitude, although issues of growing inflationary pressure are already affecting the national economy. An extensive block of macroeconomic statistics will be released this week, and the updated quarterly GDP statistics, which will be published on Wednesday, will take center stage in publications. The previous estimate indicates a contraction of the country's economy in Q1 2022 by 0.2% QoQ and 1.0% YoY.

Meanwhile, the Japanese government is stepping up regulation of the national crypto asset market. Last week, Parliament approved a bill according to which stablecoins can officially be considered digital money as early as 2023. Only licensed financial institutions and payment system operators, as well as trust companies, will be able to issue them. The tokens will be backed by the yen or other national currencies, at a ratio of 1:1, since their holders must have the right to redeem at face value. In addition, lawmakers plan to publish rules for stablecoin issuers in the near future. Thus, Japan became the first country to develop a phased legal framework for the circulation of digital assets, designed to protect crypto investors and maintain market stability.

usdjpy-1.png


Bollinger Bands in D1 chart show moderate growth. The price range is expanding but it fails to conform to the surge of "bullish" activity at the moment. MACD grows, preserving a stable buy signal (located above the signal line). Stochastic, having approached its highs, is also trying to reverse into a descending plane, indicating the risks of overbought USD in the ultra-short term.

Resistance levels: 131, 132, 133, 134 | Support levels: 130, 129.39, 128.62, 128

usdjpy-2.png
 
nzdusd-forum-1.png


The American currency is losing ground again

The NZDUSD pair is correcting upwards of around 0.6523 due to the stable Q1 New Zealand macroeconomic indicators.

According to data provided by the National Statistical Office (Stats NZ), total imports of services increased by 35.0% to 1.4B New Zealand dollars compared to March 2021, while exports of services added 12.0% to 376M New Zealand dollars. Imports of transport services showed the largest increase, up 82.0% to 1.5B New Zealand dollars, a quarterly record on record. The main reason for the positive dynamics was removing border restrictions introduced due to the coronavirus pandemic. The country's external economic activity will continue to recover, strengthening the position of the national currency.

The US currency is near 102 in the USD Index against the backdrop of the active publication of macroeconomic data, which investors perceive inconsistently. Thus, the unemployment rate in the US in May amounted to 3.6%, which coincided with the April value but was worse than the 3.5% expected by analysts. One of the reasons that prevented a more significant correction was another outflow of workers from the US non-farm sector: the value increased by 390K, below 436K a month earlier, while private non-farm employment decreased to 333K from 405K a month previously. Multidirectional statistics act as a catalyst for pressure on the US dollar.

nzdusd.png


The instrument moves within the global downward channel, approaching the resistance line. Technical indicators reversed and gave a buy signal: fast EMAs on the Alligator indicator crossed the signal line upwards, and the AO oscillator histogram forms bars above the zero level.

Resistance levels: 0.6557, 0.6746 | Support levels: 0.6432, 0.6212​
 
audusd-forum-1.png


Australian dollar remains under pressure
During the Asian session, the AUDUSD pair shows ambiguous trading dynamics, consolidating near the level of 0.7200.

On Tuesday, investors are focused on the decision of the Reserve Bank of Australia (RBA) on interest rates, which added activity to a fairly calm market. The regulator decided to increase the value by 50 basis points, contrary to the expected growth of only 25, from 0.35% to 0.85%. The accompanying statement noted that inflation in the country increased significantly, although it remained on average lower than in other advanced economies. Officials predictably identified the consequences of the COVID-19 pandemic and the development of the military conflict in Ukraine as external factors. Negative dynamics within the country were also noted, particularly a reduction in production capacity and a poor labor market. RBA forecasts suggest that inflationary risks will continue to grow but will be adjusted to 2–3% target levels next year.

Macroeconomic statistics from Australia exert little pressure on the positions of the instrument. Thus, the service sector's activity index from AiG in May fell sharply from 57.8 to 49.2 points, which was worse than the average analysts' forecasts.

Meanwhile, investors are watching the rhetoric of the Chinese authorities regarding the development of relations with Australia. Thus, Chinese Foreign Minister Wang Yi, as part of a tour of eight countries in the Asia-Pacific region, announced the need to restart them. It is worth noting that the activity of Chinese representatives in the region is of concern to official Canberra since the Chinese authorities have already managed to sign more than fifty agreements with island states on trade and security, while another ten countries are still considering such a possibility. Experts believe that the state to which the island regions will join will eventually gain control over the entire Pacific Ocean, and the Chinese authorities will probably not give up trying to conclude these agreements.

audusd-1.png


On the daily chart, Bollinger Bands are actively growing: the price range is narrowing, indicating the emergence of multidirectional trading dynamics in the short term. The MACD indicator is trying to reverse into a downward plane, forming a new sell signal (the histogram is trying to settle below the signal line). Stochastic remains confidently down but is rapidly approaching its lows, indicating that the Australian dollar may become oversold in the ultra-short term.

Resistance levels: 0.7202, 0.7250, 0.7300, 0.7350 | Support levels: 0.7150, 0.7100, 0.7050, 0.7000.

audusd-2.png
 
eurusd-forum-1.png


Consolidation pending the results of the ECB meeting
The European currency shows a slight decrease against the US dollar during the Asian session, consolidating near 1.0680. Activity on the market remains quite low, as the news background changes slightly.

Yesterday investors were focused on the statistics on Factory Orders in Germany: in April, the figure showed a decrease of 2.7% after falling by 4.2% a month earlier, although analysts had expected a growth of 0.5%. In annual terms, the negative dynamics increased from –2.9% to –8.9%, which also turned out to be worse than the average market forecasts. Slight support for the instrument was provided only by data on Sentix Investor Confidence in the euro area, which rose from –22.6 to –15.8 points in June, while analysts expected an increase to only –20.0 points. Today, investors are waiting for the publication of updated statistics on the dynamics of the Eurozone GDP for Q1 2022. Previous estimates suggested growth of the region's economy by 0.3% QoQ and 5.1% YoY. Also during the day, Employment Change statistics for Q1 2022 will be released.

The eurozone economy is under unprecedented pressure, forcing the European Central Bank (ECB) to tighten monetary policy at its June 9 meeting. Currently, most experts are in favor of two 50 basis points rate hikes in July and September. More "hawkish" rhetoric is unlikely, so a depreciation of the euro can be expected.

Meanwhile, the European authorities are trying to replace the volumes of Russian oil, which now cannot be delivered to the region due to economic sanctions. This week it became known that the US State Department lifted the ban on the supply of Venezuelan "black gold" to Europe by Eni S.p.A. and Repsol S.A. It is noted that deliveries will begin as early as next month and initially will be able to replace Russian energy only partially, having an insignificant impact on prices, but experts agree that this is only the first step to open the Venezuelan oil market.

eurusd-1.png


On the D1 chart Bollinger Bands are trying to reverse horisontally. The price range is narrowing, reflecting the emergence of ambiguous dynamics of trading in the ultra-short term. MACD is going down, keeping a fairly stable sell signal (located below the signal line). Stochastic is showing similar dynamics being located in the middle of its area.

Resistance levels: 1.0700, 1.0747, 1.0800, 1.0850 | Support levels: 1.0640, 1.0600, 1.0500, 1.0459

eurusd-2.png
 
Back
Top