Solid ECN | Daily Technical | Video | Major Products

CAC 40 - French stock market is correcting upwards

Thales Group, a company producing information systems for aerospace, military and maritime applications, recorded quarterly revenue at the level of analysts' expectations in the region of 4.05 billion euros, surpassing the figure of the previous period at the level of 3.74 billion euros; and advertising and communication company Publicis Groupe reflected revenue of 3.07 billion euros, the best result since 2016. Macroeconomic data will also be published today, including Services and Manufacturing PMIs, where a decline to 52.7 points and 50.8 points, respectively, is projected.

cac.png


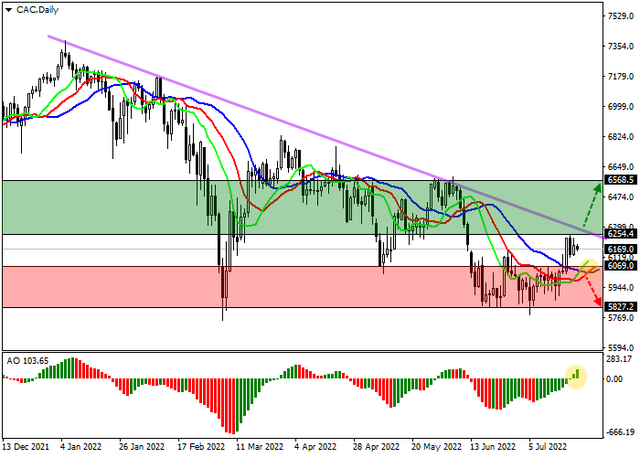
The asset quotes are in the global downtrend, approaching the resistance line. Technical indicators have already reversed and issued a new buy signal: the fast Alligator indicator EMAs crossed the signal line from below, and the histogram of the AO oscillator moved to the buy area, forming ascending bars.

Support levels: 6070, 5827 | Resistance levels: 6254, 6568​
 
In the shares of the American company Snap, which owns the Snapchat application, a global downtrend is developing, and at the moment the quotes of the trading instrument are around 16.00.

On the daily chart, a global downtrend is forming, which is the result of the implementation of the Triangle pattern, and after the price gap with the boundaries of 15 – 22, the price makes attempts to work it out.

On the four-hour timeframe, it is clearly seen that the most serious attempt to close this price gap is taking place right now, since the quotes have already overcome the key level of 15.5 and continue to grow actively. Nevertheless, another serious obstacle for the upward movement is the resistance line of the global trend at 17.00, the overcoming of which will become the main marker of a change in the trend.

snap.png


Technical indicators are ready to issue a buy signal: the range of EMA fluctuations on the Alligator indicator is trying to begin expanding in the direction of growth, and the histogram of the AO oscillator has already moved to the buy zone.​
 
Crude Oil: technical analysis

Quotes of Crude Oil have continued to decline since the end of last month and have now left the ascending channel, testing the 95.45 mark (Fibo retracement 50.0%). Consolidation of the price below it will allow the movement to continue up to 87.5. The key for the "bulls" is a strong resistance level of 102.5 (the middle line of the Bollinger Bands), the breakout of which will act as catalysts for upward dynamics to the area of 106.25, 112, however, this option is currently estimated as less probable.


Technical indicators point out the continuation of the current trend: the Bollinger Bands and the Stochastic have reversed downwards, the MACD histogram is stable in the negative zone.

Resistance levels: 102.5, 106.25, 112 | Support levels: 95.45, 87.5, 85​
 

AUDUSD - Upward correction in the asset​

At the recent Australian Strategic Business Forum – Melbourne, the head of the Bank of Australia, Philip Lowe, announced a preliminary forecast that inflation in the country would accelerate, and new anti-records may be reflected in the quarterly report, after which another peak in consumer prices will probably have to at the end of the year. Analysts suggest that in the second quarter, the figure will increase from the current 5.1% to 6.3% against the continued decline in key sectors of the economy. Thus, in June, Manufacturing PMI fell to 55.7 points from 56.2 points, and Service PMI – to 50.4 points from 52.6 points a month earlier. In his speech, the head of the financial department also said that the neutral key rate at the current inflation rate should be at least 2.5%, while now it consolidates at 1.35%. Faster labor productivity growth will likely be a catalyst for the higher value.


The price remains inside the Expanding formation pattern on the global chart, rising within the local trend. Technical indicators signal the presence of an upward correction: fast EMAs on the Alligator indicator have almost reached the signal line, and the AO oscillator histogram has approached the transition level.

Support levels: 0.6855, 0.671 | Resistance levels: 0.6978, 0.712​
 
XAUUSD - Investors are actively reducing short positions

The current growth was the reaction of traders to the slowdown in the USD dynamics, which has been putting pressure on the quotes of the precious metal for two months now. The proximity of the US Federal Reserve meeting, scheduled for Wednesday, July 27, provoked an outflow of investor capital into conservative gold, which traditionally acts as a safe-haven asset in situations of uncertainty. Of course, if the interest rate is increased by 75 or even 100 basis points, a short-term decline in the trading instrument is inevitable, but after that, the global correction may resume.

gold.png


On the weekly chart, the formation of a long-term downward channel continues, with dynamic boundaries of 1800.0–1650.0. The price is trying to start a new wave of growth. Technical indicators are holding a sell signal, which is slightly weakening: fast EMAs on the Alligator indicator have begun to approach the signal line, and the AO oscillator histogram is forming new rising bars in the sell zone.

Support levels: 1695, 1650 | Resistance levels: 1741, 1786​
 
Nasdaq 100 - US stock market corrects

The corporate segment of the stock market continues to publish financial statements for the second quarter. So, shares of Snap Inc., owner of the Snapchat messenger, became the leader of the fall yesterday, after the net loss per share increased to –0.26 dollars from –0.22 dollars in the previous period. Quarterly revenue also fell short of analysts' expectations, amounting to 1.1B dollars against the forecast of 1.14B dollars. Meanwhile, financial services firm American Express Co. released positive data with revenue of 13.4B dollars, well above its preliminary estimate of 12.5B dollars, while earnings per share of 2.57 dollars improved its forecast from 2.42 dollars.

nq.png


The index quotes continue to form a global downward channel, rising towards the resistance line. Technical indicators are in a buy signal: fast EMAs on the Alligator indicator are holding above the signal line and expanding the range of fluctuations. At the same time, the AO oscillator histogram steadily rises in the buying zone.

Support levels: 11816, 11087 | Resistance levels: 12688, 13531​
 
EURUSD - The development of the energy crisis increases pressure on the euro

The European economy continues to slide smoothly into recession, and one of the key factors in the current downturn is the rapid development of the energy crisis. So, yesterday, the Russian company Gazprom, which supplies gas to the EU countries, announced that one of the turbines of the gas pipeline would be stopped for repair, and the total volume of pumping from July 27 will decrease to 33M cubic meters per day. Thus the low level of supplies will be corrected by almost half. The head of the European Commission, Ursula von der Leyen, called on the leadership of the EU states to prepare for a complete halt in supplies from Russia against the background of the sanctions policy. To avoid critical consequences, the official announced the need to save resources even in those territories where dependence on Russian resources is insignificant. Earlier, a document was presented: it obliged all states of the region to submit projects for a voluntary reduction in gas consumption by 15% by the end of March next year by the end of September this year, which was criticized. Yesterday, there were reports of numerous adjustments being made to adapt to a particular country's needs. Today, the project was agreed upon at a special meeting of EU energy ministers in Brussels.

eurusd.png


Despite serious pressure, the EUR/USD pair is within the global downward channel, approaching the resistance line. Technical indicators continue to hold a sell signal, which is gradually weakening: fast EMAs on the Alligator indicator are approaching the signal line, and the AO oscillator histogram continues to form upward bars.

Support levels: 1.0130, 0.9952 | Resistance levels: 1.0278, 1.0494​
 
NZDUSD - New Zealand households face rising cost of living

Yesterday, Statistics New Zealand (Stats NZ) published data on the cost of living index for various household groups, noting an increase in the indicator in June of this year by 7.4% compared to the same period in 2021. Thus, the cost of living for households with high average expenses increased by 8.1%, and for households with low expenses – by 6.5%, reflecting the most rapid negative dynamics since 2008, the key drivers of which, as noted, were high tariffs for gasoline and utilities.

nzdusd.png


The NZDUSD pair continues to trade within a global downtrend, gradually rising towards the local resistance level. Technical indicators are ready to reverse and signal to start buying: fast EMAs on the Alligator indicator have almost reached the signal line, and the AO oscillator histogram has moved into the buying zone, having formed the first rising bar.

Support levels: 0.6213, 0.6062 | Resistance levels: 0.6315, 0.6421​
 
S&P 500 in anticipation of the publication of corporate reports

Today, several major players in the US market will present data on the results of the second quarter. Thus, the world leader in information technology, software, and IT services, Microsoft Corp., expects revenue growth at 52.43B dollars, higher than 49.36B dollars shown a quarter earlier. In turn, the Alphabet Inc. holding, which owns the Google brand, predicts a figure of 70.04B dollars against 68.01B dollars. Visa Inc. will record quarterly revenue in the region of 7.06B dollars, which is in line with the 7.19B dollars shown in the previous period.

spx.png


The index quotes are traded within a global downward channel, heading towards the resistance line. Technical indicators keep a stable buy signal: fast EMAs on the Alligator indicator are above the signal line, and the AO oscillator histogram is in the buy zone, continuing to form rising bars.

Support levels: 3907, 3674 | Resistance levels: 4013, 4182​
 
ad-3.png


AUDUSD - Inflation in Australia may accelerate

The AUDUSD pair started the week with an upward movement and is currently testing the level of 0.6958. However, consolidation above it seems less likely, as investors refrain from opening new trading positions, waiting for two key releases on Wednesday – the publication of inflation data in Australia and the decision of the US Federal Reserve on the interest rate.

Thus, Q2 CPI is likely to be poor: the indicator will consolidate around 6.1–6.3% YoY, which is twice the target of the Reserve Bank of Australia (2.0–3.0%) and thus will reach the high since 1990. Implementation of the forecast or its exceeding will confirm the fears of the head of the regulator, Philip Lowe, who recently stated that “psychological inflation” is forming in the country when consumers rush to spend available capital, expecting further price increases, which only exacerbates the negative dynamics, which, in turn, could push agency officials to accelerate the pace of interest rate adjustments to 75 basis percentage points, increasing the risks of the national economy going into recession.

audusd.png


The trading instrument is within the long-term downward channel, and now the price is testing 0.6958, consolidation above which will allow quotes to strengthen to the area of 0.708. Otherwise, the price decline will resume to 0.6835, 0.6713. Technical indicators do not give a single signal: Bollinger bands are horizontal, Stochastic is leaving the overbought zone, forming a sell signal, and the MACD histogram is preparing to move into the positive zone.

Resistance levels: 0.6958, 0.708 | Support levels: 0.6835, 0.6713, 0.6591​
 
Back
Top