Solid ECN | Daily Technical | Video | Major Products

Silver Technical analysis

H4

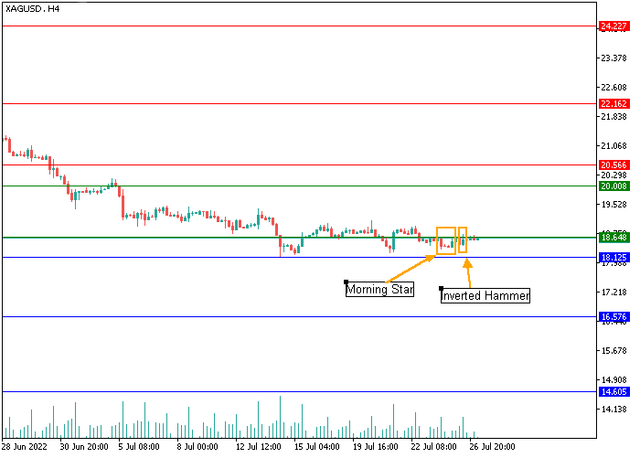
On the four-hour chart, there is a long-term consolidation of the asset in the range of 18.12–20, and at the moment, above 18.12, the quotes have formed a Morning star candlestick analysis model, which is a reversal formation at the bottom. Also, an Inverted hammer pattern has formed, the green color of which emphasizes the "bullish" strength. The combination of these figures indicates that the trading instrument has reached the bottom and a high probability of further recovery to the resistance level of 20.56, the breakout of which will increase the upward dynamics to the zone of 22.16−24.22. An alternative scenario is possible if the "bulls" fail to hold the key level of 18.12. The instrument may drop to the range of 16.57–14.6.
silver-1.png


D1
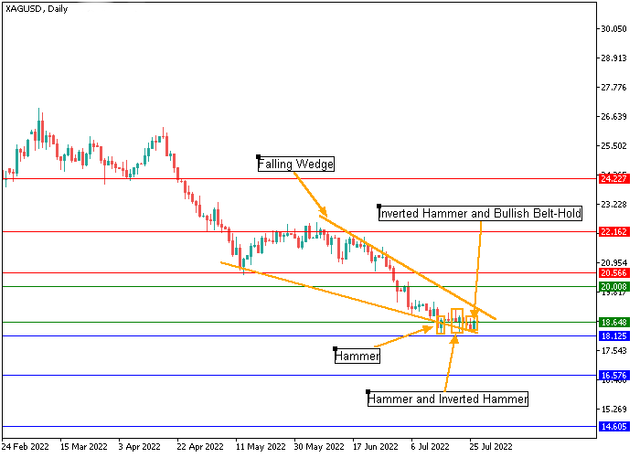
On the daily chart, the falling Wedge price pattern is being completed. The fact that the asset has reached the bottom is also indicated by the appearance above the support level of 18.12 of a series of Hammer and Inverted hammer figures. Also, the confirmation of the increasing activity of buyers can serve as a model of a "bullish" Belt hold. In this situation, the probable scenario of the price movement seems to be the breakout of the upper border of the Wedge with further growth to the area of 20.56−24.22.

Support levels: 18.12, 16.57, 14.6 | Resistance levels: 20.56, 22.16, 24.22
silver-2.png
 
AUDUSD, H4

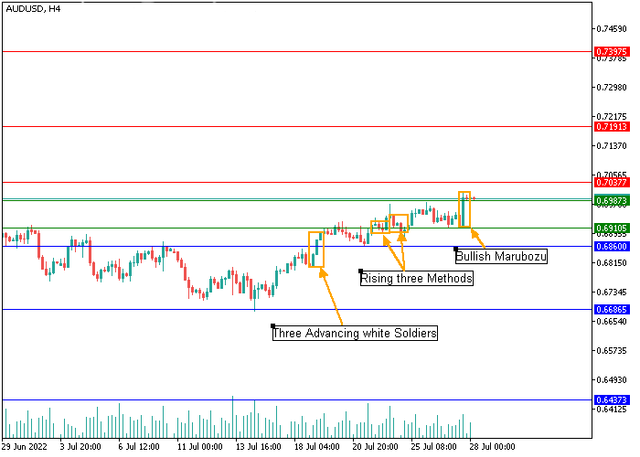
On the four-hour chart, at 0.6860, there is the formation of the Three advancing white soldiers pattern, meaning buyers have seized the initiative and intend to restore positions. In turn, the appearance of the Three “bullish” steps pattern also signals the continuation of the upward dynamics, and the “bullish” Marubozu pattern indicates the predominance of “bullish” sentiment. In the current situation, the asset will most likely continue to recover to the resistance level of 0.7037, which will allow the quotes to head to the zone of 0.7191−0.7397. An alternative scenario is possible after the consolidation below the support level of 0.6860, and then the downward movement may intensify to 0.6437.

audusd-1.png


AUDUSD, D1

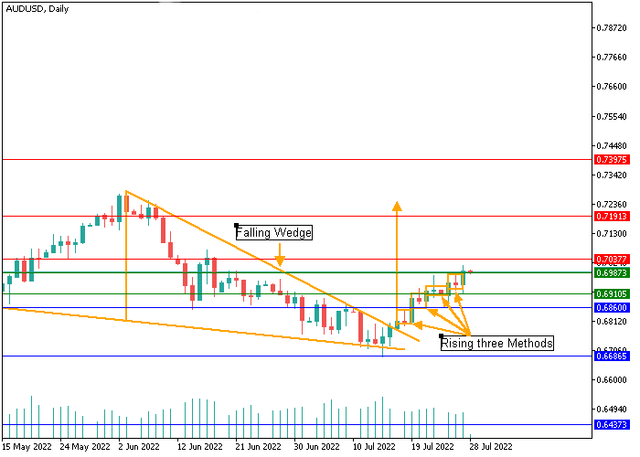
On the daily chart, a Falling wedge price pattern is being formed, from which the asset managed to break up, but its implementation has not yet been completed. The “bullish” mood for the instrument is also confirmed by a series of formed Three “bullish” steps figures, which serve as signals for the continuation of the uptrend. Most likely, the trading instrument will strengthen the upward dynamics to 0.7037, consolidation above which will become a catalyst for the movement of quotations to the area of 0.7191−0.7397.

Support levels: 0.686, 0.6686, 0.6437 | Resistance levels: 0.7037, 0.7191, 0.7397

audusd-2.png
 
NZDUSD, H4
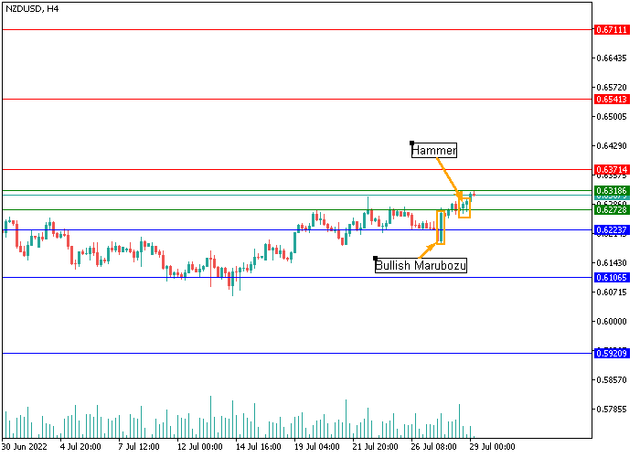
On the four-hour chart, at the support level of 0.6223, a Marubozu pattern is forming, signaling that the buyers have seized the initiative. The appearance of two Hammer patterns also confirms the strengthening of the "bullish" sentiment. In the current situation, the continuation of the upward trend towards the resistance level of 0.6371 is possible, consolidation of the price above which will allow the asset to recover lost positions and head to the area of 0.6541− 0.6711. If the "bears" break the support level of 0.6223, the negative dynamics will develop to 0.5920.

nzdusd-1.png


NZDUSD, D1
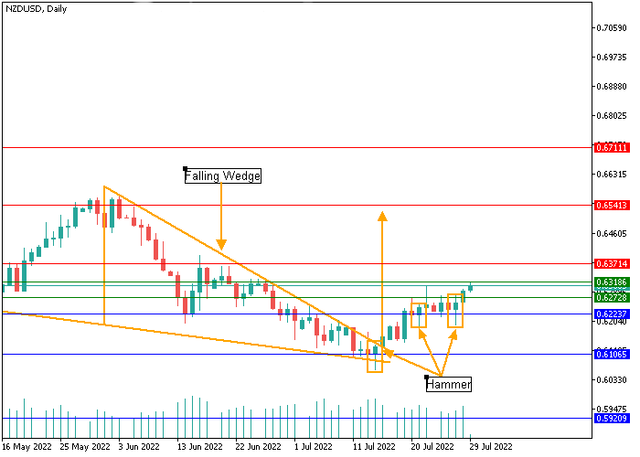
On the daily chart, there is a falling Wedge price pattern, from where the price of the trading instrument went upwards. Its development has not yet been completed, and the upward dynamics of quotations are intensifying. It is confirmed by forming a series of Hammer reversal patterns, signaling the bottom has been reached. Currently, the price is trying to break the resistance level of 0.6371. If successful, the quotes will continue to move to the area of 0.6541− 0.6711.

Support levels: 0.6223, 0.6106, 0.592 | Resistance levels: 0.6371, 0.6541, 0.6711

nzdusd-2.png
 
Last week, the BTCUSD pair had ambiguous dynamics.

First, the price fell to the 22200 area due to fears of a sharp increase in interest rates and the "hawkish" rhetoric from US Federal Reserve officials, as inflation in the country reached a record level of 9.1%. The regulator's decision was restrained, the interest rate was raised only by 75 basis points, and the head of the department, Jerome Powell, acknowledged the possibility of a further slowdown in its growth, which provoked a positive trend in "digital gold." The following data on the US gross domestic product (GDP) decline in the second quarter by 0.9%, which means the beginning of a technical recession in the US economy, contributed to an even greater decline in the dollar and the strengthening of alternative assets. Investors have again turned to cryptocurrencies as shelter assets, fearing worsening economic problems, which has caused enthusiasm among members of the digital community. Thus, the CEO of the Binance exchange, Changpeng Zhao, said in an interview with CNBC that the current increase in inflation, along with the decline in the world's leading economies, could lead to further popularization of digital assets. The businessman also considers holding the important mark of 20000 by the price as a positive moment, from which the beginning of a new growth cycle is possible.

However, the current situation does not yet mean a reversal of the long-term downtrend since the US Federal Reserve, despite the likely slowdown in monetary policy tightening, will not completely abandon it, and the final quarterly US GDP data may turn out to be better than the preliminary ones, which will once again force investors to buy the dollar.

btc.png


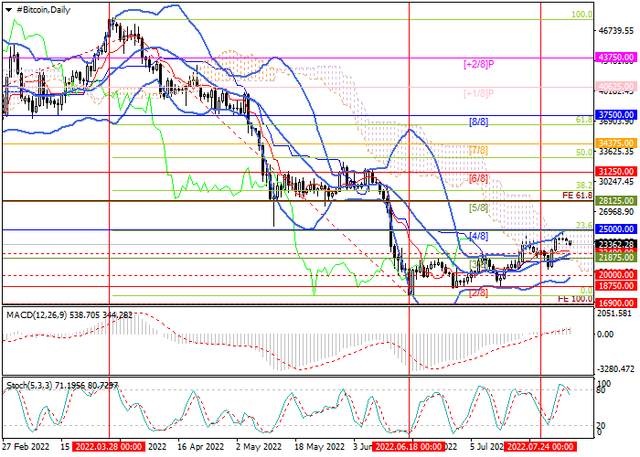
The price corrected downwards from the area of 24600, but for a serious decline, it needs to consolidate below the middle line of Bollinger bands around 22400. In this case, the quotes will be able to drop to 20000 (bottom line of Bollinger bands) and 18750. Otherwise, growth will resume to 25000 and 28125. Technical indicators suggest that the short-term uptrend will continue, as Bollinger bands are directed upwards, the MACD histogram is increasing in the positive zone, while Stochastic is leaving the overbought zone, but so far, the downside potential is seen as limited.

Resistance levels: 25000, 28125, 31250 | Support levels: 22400, 20000, 18750​
 
GBPUSD - Trading within the global downward channel

At the end of last week, almost 80% of all train traffic in the country came to a halt, paralyzing the domestic supply chains of goods due to the strike of railway workers, caused by a sharp increase in prices for food and goods, which has been going on since the beginning of summer. Also, the British pound is negatively affected by macroeconomic statistics: the volume of mortgage lending in June fell to 5.27B pounds from 8.04B in May, while the volume of private net loans fell to 7.1B from 8.9B a month earlier. The reason for the negative dynamics of the indicator was the active increase in the interest rate, which prevents consumers from planning the cost of loans.

gbpusd.png


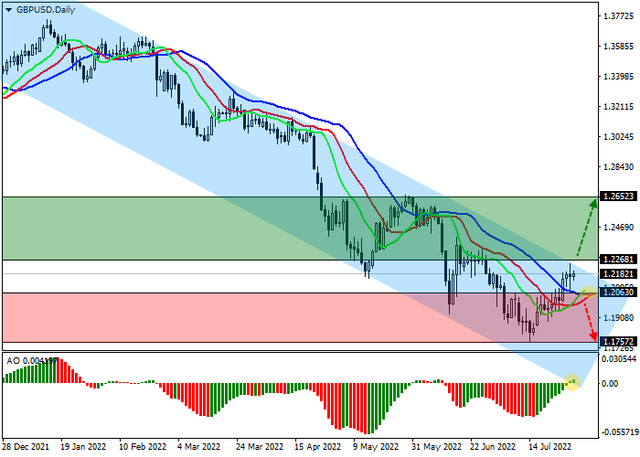
The trading instrument is moving within the global downward channel, approaching the resistance line. Technical indicators reversed and gave a stable buy signal: indicator Alligator’s EMA oscillation range expands upwards, and the histogram of the AO oscillator is forming rising bars in the buying zone.

Resistance levels: 1.2268, 1.2652 | Support levels: 1.2063, 1.1757​
 
Last week, the BTCUSD pair had ambiguous dynamics.

First, the price fell to the 22200 area due to fears of a sharp increase in interest rates and the "hawkish" rhetoric from US Federal Reserve officials, as inflation in the country reached a record level of 9.1%. The regulator's decision was restrained, the interest rate was raised only by 75 basis points, and the head of the department, Jerome Powell, acknowledged the possibility of a further slowdown in its growth, which provoked a positive trend in "digital gold." The following data on the US gross domestic product (GDP) decline in the second quarter by 0.9%, which means the beginning of a technical recession in the US economy, contributed to an even greater decline in the dollar and the strengthening of alternative assets. Investors have again turned to cryptocurrencies as shelter assets, fearing worsening economic problems, which has caused enthusiasm among members of the digital community. Thus, the CEO of the Binance exchange, Changpeng Zhao, said in an interview with CNBC that the current increase in inflation, along with the decline in the world's leading economies, could lead to further popularization of digital assets. The businessman also considers holding the important mark of 20000 by the price as a positive moment, from which the beginning of a new growth cycle is possible.

However, the current situation does not yet mean a reversal of the long-term downtrend since the US Federal Reserve, despite the likely slowdown in monetary policy tightening, will not completely abandon it, and the final quarterly US GDP data may turn out to be better than the preliminary ones, which will once again force investors to buy the dollar.

btc.png


The price corrected downwards from the area of 24600, but for a serious decline, it needs to consolidate below the middle line of Bollinger bands around 22400. In this case, the quotes will be able to drop to 20000 (bottom line of Bollinger bands) and 18750. Otherwise, growth will resume to 25000 and 28125. Technical indicators suggest that the short-term uptrend will continue, as Bollinger bands are directed upwards, the MACD histogram is increasing in the positive zone, while Stochastic is leaving the overbought zone, but so far, the downside potential is seen as limited.

Resistance levels: 25000, 28125, 31250 | Support levels: 22400, 20000, 18750​
 
NZDUSD - New Zealand housing market is stable

Yesterday, Statistics New Zealand (Stats NZ) released its June report on the state of the housing market: building permits decreased by 3.0% from the May dynamics of –0.5%, and the adjusted value lost 2.3% compared to 0.5% recorded earlier. However, there is a positive trend: the actual number of houses built in June amounted to 50.736K, which is 14% more than last year, and the number of new houses per thousand residents is 9.9 units against 8.7 units. This statistic may indicate that the global construction market is stable, and the local slowdown does not seriously impact it.

nzdusd.png


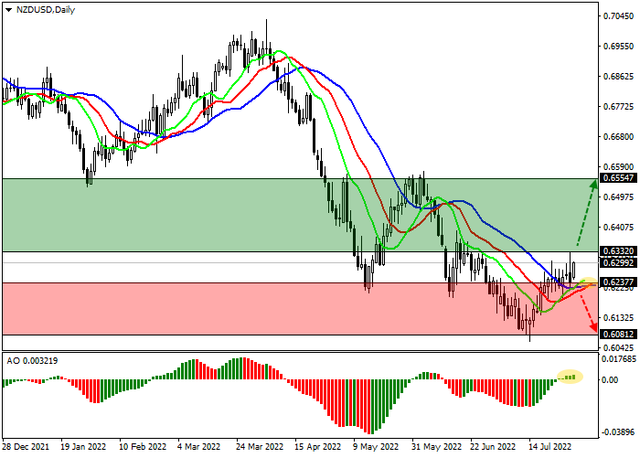
The trading instrument is moving within the global downtrend, rising towards the local resistance. Technical indicators reversed and gave a signal to buy: fast EMAs on the Alligator indicator crossed the signal line upwards, and the AO oscillator histogram moved into the buying zone, forming several upward bars.

Resistance levels: 0.6332, 0.6555 | Support levels: 0.6237, 0.6081​
 
The shares of Caterpillar, a global manufacturer of construction and mining equipment, are trading within a global corrective trend, around 194.

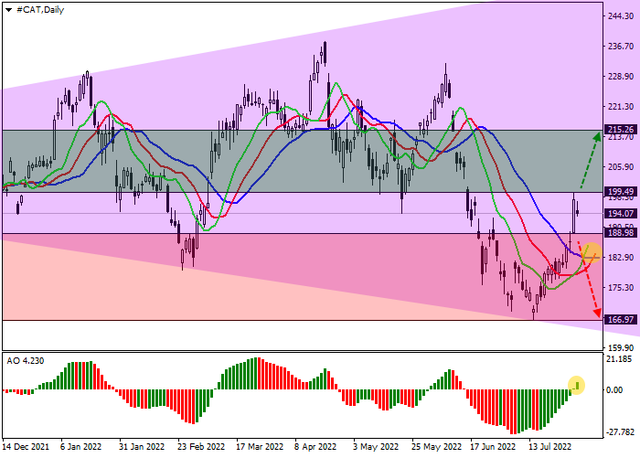
On the daily chart of the asset, a global Expanding formation pattern with dynamic boundaries of 165–250 is forming, within which an upward wave with the target near the resistance line around 250 develops. A reversal has formed on the four-hour chart, and there is no doubt that the upward dynamics will continue. Since the current wave is the seventh, the probability of quotes going beyond the lower border of the pattern around 165 is extremely small.

cat.png


It is confirmed by technical indicators that have reversed and are holding a stable buy signal: fast EMAs on the Alligator indicator crossed the signal line and began to expand the range of fluctuations, and the AO oscillator histogram is forming new bars in the buy zone.​
 
USDCHF - American currency is actively losing ground

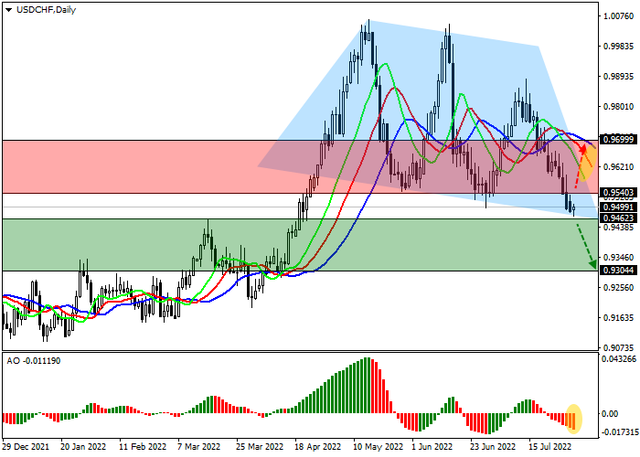
The dynamics of the franc are rather negative since there are still no factors for its growth, and investors perceive the published macroeconomic statistics as neutral: the index of economic expectations published monthly by the Leibniz Center for European Economic Research in Mannheim (ZEW) reached –57.2 in July, which was better than the absolute June anti-record of –72.7 points but it is still lower than the peak of the coronavirus pandemic in 2020. The Zurich Polytechnic Federal Institute (KOF) Switzerland's index of leading economic indicators has been declining for fifteen consecutive months, and in July, the indicator was 90.1 points, falling from 95.2 points in June. Given that it is a leading indicator of the gross domestic product (GDP) trend, it can be assumed that the growth of the Swiss economy will continue to slow down in the second quarter.

usdchf.png


On the weekly chart of the asset, the price is correcting within the possible Head and shoulders pattern, preparing to continue a local decline. Technical indicators have completely reversed and gave a sell signal: fast EMAs on the Alligator indicator crossed the signal line downwards, and the AO oscillator histogram moved into the sell zone, continuing to form down bars.​
 
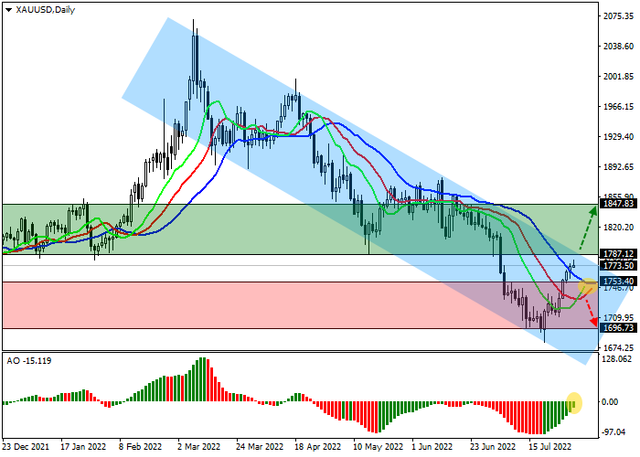
Gold is correcting at 1774 amid strengthening of the downtrend of the US dollar, which fell from 108 to 105 in the USD Index, acting as a catalyst for the movement of capital into safe-haven assets.

Swap dealers have seen a record liquidation of short positions since the week before last, and the continuation of this trend may mean that the trend in gold is likely to change soon. The report of the US Commodity Futures Trading Commission (CFTC) also showed a decrease of 5.153K contracts in this category, which significantly reduced the difference in the accumulated positions. Now buyers have 92.205K contracts, and sellers have 174.234K contracts.

The situation on the gold market is developing in such a way that the balance of sellers and buyers may soon change in favor of the latter. At the very least, the number of general speculative positions backed by money obviously slowed down the decline: if in early July they were adjusted by an average of 15 - 20K contracts per week, last week the reduction was only 2.3K contracts.

gold.png


On the global chart of the asset, the formation of a wide descending channel with dynamic boundaries 1780 – 1650 continues, and now the price is making its first attempt to overcome the resistance line. Technical indicators weaken a sell signal: fast EMAs on the Alligator indicator have almost approached the signal line, and the AO oscillator histogram is forming upward bars, approaching the transition level.

Support levels: 1753, 1696 | Resistance levels: 1787, 1847​
 
Back
Top