SOLID ECN LLC
Solid ECN Representative
- Messages
- 511
S&P 500: the beginning of the reporting season has disappointed investors
Current trend
Due to a not very positive start to corporate reporting, the leading index of the US economy, S&P 500, corrects downwards, trading around 4655.0.
Among the index's major components, financial conglomerate JPMorgan Chase & Co. was one of the first to publish its data, showing a quarterly income of $29.26B, which was below $29.65B a quarter earlier and $29.78B predicted by analysts. Despite the poor earnings performance, earnings per share were $3.33, well above the $3.01 expected. Bad news came from the large pharmacy chain Walgreens Boots Alliance. The company said some pharmacies would close over the weekend as the state is understaffed by the continued spread of the omicron strain. These reports come after fourth-quarter earnings of $33.9B were reported, well ahead of the $32.88B forecasted.
Securities again began to rise, putting additional pressure on the stock market. Leading 10-year US bonds are trading at 1.793%, up from Friday's 1.750%.
Growth leaders include Las Vegas Sands Corp. (+14.15%), Wynn Resorts Ltd. (+8.60%), and Discovery Inc. (+7.04%).
Among the decline leaders there are JPMorgan Chase & Co. (–6.15%), Monster Beverage Corp. (–4.73%), and Simon Property Group Inc. (–4.47%).
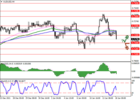
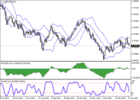
Support and resistance
The index quotes move within a global upward channel near the support line. Technical indicators reversed and gave a local sell signal: indicator Alligator's EMA fluctuations range expands downwards, and the histogram of the AO oscillator trades in the sell zone.
Resistance levels: 4710.0, 4800.0.
Support levels: 4593.0, 4500.0.