Solid ECN | Daily Technical | Video | Major Products

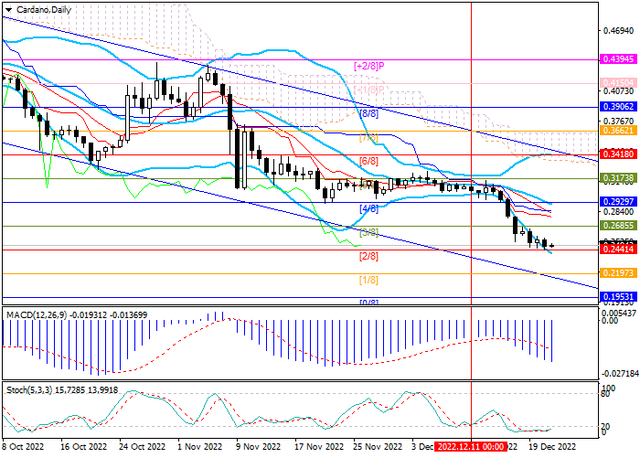
XRPUSD - Murray analysis

The XRPUSD pair continues to trade within the long-term descending channel: last week the quotes reached its upper limit around 0.3906 (the Murray level [4/8]), but they could not break higher and resumed the decline.

xrp.png


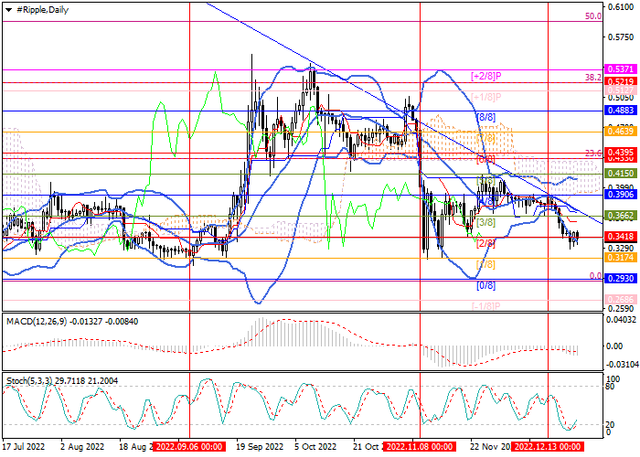
Currently, the price has fallen to the area of 0.3418 (Murray level [2/8]), consolidation below which will give the prospect of further decline to the levels of 0.2930 (Murray level [0/8], the area of June lows) and 0.2686 (Murray level [-1/8]). The key for the "bulls" is the 0.3662 mark (the Murray level [3/8]), supported by the middle line of the Bollinger Bands, in case of its breakout, the price will leave the framework of the descending channel and will be able to rise to the levels of 0.4150 (the Murray level [5/8]) and 0.4395 (the Murray level [6/8], the Fibo retracement 23.6%).

Resistance levels: 0.3662, 0.415, 0.4395 | Support levels: 0.3418, 0.2930, 0.2686​
 

EURUSD breaches the minor resistance​

The EURUSD pair begins today with new positivity to breach the resistance that appears on the chart and attempts to hold above it, reinforcing the expectations of continuing the bullish trend, opening the way to head towards our waited target at 1.0745. The EMA50 and stochastic provide positive signals that support the expected rise, which will remain valid conditioned by the price stability above 1.0580.

eurusd.png


The expected trading range for today is between 1.0570 support and 1.0745 resistance.​
 
NZDUSD Faces Solid Support

The NZDUSD pair touched 0.6275 level and found solid support there, to show some bullish bias and retest the broken neckline of the head and shoulders’ pattern that appears on the chart, waiting to resume the negative trades to break the mentioned level and head towards 0.6130 as a next target. Therefore, the bearish trend scenario will remain valid for the upcoming period unless breaching 0.6385 and holding above it.

nzdusd-tech.png


The expected trading range for today is between 0.6250 support and 0.6365 resistance​
 

ADAUSD - Under pressure from general market negative factors

The ADAUSD pair is falling along with the main part of the cryptocurrency market, having tested 0.2441 (Murrey levels [2/8]) this week. The coin is under pressure from general market negative factors: the consequences of the bankruptcy of the FTX digital exchange and the results of the last meeting of the US Federal Reserve.

Last week, the US regulator confirmed the need to continue raising the interest rate and keep it at high levels until at least 2024: investors' expectations for softening hawkish rhetoric did not materialize, and the dollar resumed strengthening against alternative assets. The consequences of the cessation of FTX are expressed, first of all, in the loss of confidence on the part of traders: by the middle of this month, 200.0K BTC worth about 3.4B dollars were withdrawn from the market, not counting other tokens, and soon this process is more likely everything will continue. Also, many cryptocurrency companies associated with the platform are experiencing problems: for example, market maker Auros announced restructuring its activities due to the company losing access to 20.0M dollars blocked on the bankrupt crypto exchange. According to Coinbase's Cryptocurrency Market Outlook 2023 report, market conditions will continue to push investors to leave altcoins for safer currencies – BTC and ETH, and the price of ADA will remain under pressure in the medium term.

ada.png


The trading instrument is moving within the long-term downward channel. Consolidation of the price below 0.2441 (Murrey levels [2/8]) will give the prospect of further decline to 0.2197 (Murrey levels [1/8]) and 0.1953 (Murrey levels [0/8]). The key "bullish" seems to be 0.2929 (Murrey levels [4/8], middle line of Bollinger bands). Its breakout will give the prospect of further growth to 0.3173 (Murrey levels [5/8]) and 0.3418 (Murrey levels [6/8], the upper limit of the downward channel).

Resistance levels: 0.2929, 0.3173, 0.3418 | Support levels: 0.2441, 0.2197, 0.1953​
 
EURUSD

The EURUSD pair faced negative pressure yesterday to attack 1.0580 level but it keeps its stability above it, and begins today with new bullish bias motivated by stochastic positivity, waiting to head towards our main expected target at 1.0745. Therefore, the bullish trend scenario will remain active as long as 1.0580 level remains intact.

eurusd.png


The expected trading range for today is between 1.0550 support and 1.0710 resistance.​
 
Gold Breaks the Support

Gold price traded with strong negativity yesterday to break the bullish channel’s support line and head towards potential visit to 1776.25 level, making the bearish bias suggested for today, supported by moving below the EMA50. Therefore, we are waiting for more expected decline in the upcoming sessions, noting that breaching 1800 will stop the negative pressure and lead the price to recover again, taking into consideration that the markets might witness mixed trades due to the general weak volumes, caused by the holidays season.

gold-tech.png


The expected trading range for today is between 1775 support and 1810 resistance.​
 
USDTRY - Turkish authorities intend to prevent currency fluctuations in the last week of the year

Last week, the main financial regulator of the Republic of Turkey sent out notices to commercial banks asking them to refrain from buying large amounts of US currency for their corporate clients so as not to provoke an increase in the USDTRY pair before the new year. Since the beginning of autumn, the agency has already artificially limited foreign exchange operations several times, focusing on the priorities set by the country's leadership, which believes that only loose monetary policy can lead to economic growth and record inflation is only a temporary problem that will be resolved along with the macroeconomic recovery indicators.

Meanwhile, Turkey is still pursuing its attempts to take a central place in the energy agenda of the Mediterranean, the Caspian Sea, and the Middle East and reduce its dependence on the supply of resources from outside. Last week, President Recep Tayyip Erdogan announced the discovery of a new gas field in the Black Sea, whose reserves are estimated at 58.0B cubic meters, and the total cost is 1.0T dollars. The total gas volume in Turkish territorial waters has risen to 710.0B cubic meters.

usdtry.png


On the four-hour chart, the quotes of the USDTRY pair are moving within the next wave of the global side corridor. Technical indicators continue to hold a stable buy signal.

Support levels: 18.68, 18.62 | Resistance levels: 18.74, 18.785​
 

EURUSD - Trading near the resistance line of the rising corridor​

Yesterday, November data on borrowings in the EU countries were presented, which was poor: the volume of loans to enterprises grew by 8.4% instead of the expected 8.6%, and to the private sector – by 4.1% instead of 4.3%. Today, investors will pay attention to the dynamics of the Spanish consumer price index in December, and, according to analysts' forecasts, the index, harmonized with EU standards, may slow down from 6.7% to 6.0%.

eurusd.png


On the daily chart, the quotes of the EUR/USD pair show corrective growth and are confidently holding near the resistance line of the ascending corridor. Technical indicators point to continued growth.

Support levels: 1.0574, 1.0396 | Resistance levels: 1.0691, 1.0849​
 
EURUSD | GBPUSD | USDJPY
27.12.2021​


Today we will be looking at euro dollar, GBP USD, and USD JPY weekly and daily charts.

The Euro Dollar downside momentum from 1.226 eased at the Fibonacci 61.8 level near 1.118. The candles formed a "bullish Doji star" and a "hammer" pattern forecasting an upcoming trend reversal. The pattern can be spotted in the daily chart. Indicator-wise, the MACD shows a divergence in the trend. So far the outcome of the MACD divergence was the trend decline slowing down around 1.118 and moving sideways. Minor resistance exists at 1.138. With a break of this fragile sealing, the instrument would probably target 1.15. On the other hand, we'll witness more decline in the pair if the support at 1.118 fails.

GBP USD bounced from the 38.2 retracement level of the Fibonacci, and it is trading close to the minor support at 1.341. With a breach in the said level, the pound sterling surge to 1.366 would probably be seen in the next few days. 38.2 Fibo at 1.3158 is the conservative support. If this level breaks, the next target would be level 50 of the Fibonacci retracement around 1.225.

If you find the content useful, please subscribe to the channel and hit the link button.

USDJPY
The bulls have an outstanding performance against the bears on the JPY USD pair. Buyers didn't cute their pressure on passing the resistance at 114.4, and the market is on its way to test the sealing for the fifth time in the last 10 days. Support is at 111.66. As long as this level holds, the market trend is bullish. Resistance is at 115.53, with a break of the level, the path of the bull to 118.66 will be paved.​


Please note that foreign exchange and other leveraged trading involve a significant risk of loss. It is not fit for all investors and you should make sure you realize the risks involved, seeking independent advice if necessary.

Nice!
 
Back
Top