Solid ECN | Daily Technical | Video | Major Products

USD/CAD, Elliot Wave Analysis

The pair may grow.

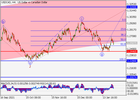
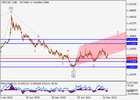
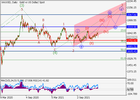
On the daily chart, a downward correction developed as the wave of the higher level 4, and the development of the fifth wave 5 started, within which the wave (1) of 5 forms. Now, the third wave of the lower level 3 of (1) is developing, within which the wave i of 3 has formed, and a local correction has ended as the wave ii of 3. If the assumption is correct, the pair will grow to the levels of 1.3200–1.3410. In this scenario, critical stop loss level is 1.2446.​

usdcad_1.pngusdcad_2.png
 
USD/CHF, Elliot Wave Analysis


The pair is in a correction, a fall is possible
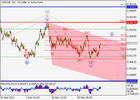
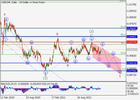
On the daily chart, the first downward wave of the higher level (1) of 3 formed, and an upward correction developed as the second wave (2) of 3, within which the wave C of (2) formed. Now, the development of the third wave (3) of 3 has started, within which the first wave of the lower level i of 1 of (3) has formed, and the development of the local correction ii of 1 of (3) is ending. If the assumption is correct, after the end of the correction, the pair will fall to the levels of 0.8921–0.8758. In this scenario, critical stop loss level is 0.9373.​

usdchf_1.pngusdchf_2.png
 
The pound is under pressure from the results of the US Fed meeting

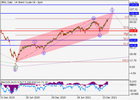
Currently, the pound is under pressure from the outcome of the US Fed meeting. The regulator, as expected, announced its intention to raise the interest rate on short-term loans by 0.25% in the near future, but the exact date was not announced, however experts continue to believe that this will happen in March. In addition, a reduction in the balance sheet of the US Fed was announced, which now significantly exceeds the required volume. Commenting on the current situation, the head of the regulator Jerome Powell noted that the recovery of the labor market and rising inflation suggest that the economy no longer needs serious stimulation. At the same time, the risks of a long delay in inflation at current levels and even its growth remain, but officials do not consider this scenario to be basic. In general, Powell's comments indicate the intention of the department to continue tightening monetary policy, which in the long term will support the US currency.

Resistance levels: 1.3550, 1.3672, 1.3732.
Support levels: 1.3427, 1.3366, 1.3306.​

gbpusd_1.png
 
Brent Crude Oil, Elliot Wave Analysis


The price may grow.

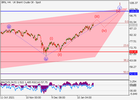
On the daily chart, the upward wave C forms, within which the first wave 1 of (1) of C develops. Now, the fifth wave of the lower level v of 1 is forming, within which the wave (iii) of 1 is developing. If the assumption is correct, the price will grow to the levels of 100.00–115.00. In this scenario, critical stop loss level is 69.45.​

oil_1.pngoil_2.png
 
Gold, Elliot Wave Analysis

The pair may grow.
On the daily chart, the fifth wave of the higher level (5) develops, within which the first entry wave 1 of (5) formed, the correctional wave 2 of (5) developed, and the wave 3 of (5) forms. Now, the third wave of the lower level iii of 3 is developing, within which the wave (iii) of iii is forming. If the assumption is correct, the pair will grow within the wave to the levels of 1919.90–2067.60. In this scenario, critical stop loss level is 1752.82.​

gold_1.pnggold_2.png
 
AUD/USD
The instrument renews December lows
by Solid ECN Securities


Current trend
The Australian dollar is showing mixed trading dynamics against the US currency during the Asian session, holding near the local lows of December 6 and getting ready to test the psychological support at 0.7.

Insignificant support for the Australian currency at the end of the week is provided by statistics from Australia on producer inflation. The Producer Price Index for Q4 2021 increased by 1.3% after rising by 1.1% in the previous period. Market forecasts assumed a sharp slowdown in the indicator to 0.3%.

Support and resistance
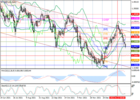
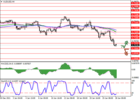
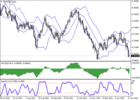
Bollinger Bands in D1 chart demonstrate a stable decrease. The price range is expanding, but it fails to catch the development of "bearish" rally at the moment. MACD is going down preserving a stable sell signal (located below the signal line). Stochastic has reached its lows, signaling about the risks of oversold AUD in the ultra-short term.

Resistance levels: 0.7050, 0.7100, 0.7128, 0.7160.
Support levels: 0.7000, 0.6950, 0.6900.​

audusd_1.pngaudusd_2.png
 
S&P 500
Trend change to downward


The S&P 500 has lost 9.7% from its peak this year and is likely to continue its downtrend amid an outflow of investor capital in anticipation of the upcoming tightening of the monetary policy by the US Federal Reserve.

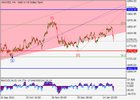
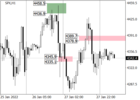
The medium-term trend in the asset changed to a downtrend last week with reaching the target zone (4376-4354), which was broken this week, opening a new target for the "bears" at the target zone (4146-4123). The trend boundary is shifting to the area of 4550.0–4437.0, from where it is possible to search for new short positions.

The short-term trend is downward. Yesterday, market participants broke through the support zone 4345.9–4335.1, and now the target for sales is the target zone 4237–4216. In addition, the key trend resistance at 4389–4378 was tested the day before, which led to a new wave of sales.

Resistance levels: 4437, 4550, 4674
Support levels: 4223, 4123, 4050.​

sp500_1.pngsp500_2.png
 
WTI Crude Oil, Elliot wave analysis

The price may grow.
On the daily chart, the upward wave C forms, within which the first wave 1 of (1) of C develops. Now, the fifth wave of the lower level v of 1 of (1) is developing, within which the wave (iii) of 1 is forming. If the assumption is correct, the price will grow to the levels of 100.00–110.00. In this scenario, critical stop loss level is 75.​

oil_1.pngoil_2.png
 
Back
Top