• Please try to select the correct prefix when making a new thread in this folder.

    Discuss is for general discussions of a financial company or issues related to companies.

    Info is for things like "Has anyone heard of Company X?" or "Is Company X legit or not?"

    Compare is for things like "Which of these 2 (or more) companies is best?"

    Searching is for things like "Help me pick a broker" or "What's the best VPS out there for trading?"

    Problem is for reporting an issue with a company. Please don't just scream "CompanyX is a scam!" It is much more useful to say "I can't withdraw my money from Company X" or "Company Y is not honoring their refund guarantee" in the subject line.
    Keep Problem discussions civil and lay out the facts of your case. Your goal should be to get your problem resolved or reported to the regulators, not to see how many insults you can put into the thread.

    More info coming soon.

Discuss SolidECN.com

General discussions of a financial company
etf-1.png


They're easy to invest in, have low fees, and often perform very well

With a net worth of more than $82 billion, Warren Buffett is one of the most successful investors of all time. His investing style, which is based on discipline, value, and patience, has yielded results that have consistently outperformed the market for decades. While regular investors—that is, the rest of us—don’t have the money to invest the way Buffett does, we can follow his one of his ongoing recommendations: Low-cost index funds are the smartest investment most people can make.

As Buffett wrote in a 2016 letter to shareholders, “When trillions of dollars are managed by Wall Streeters charging high fees, it will usually be the managers who reap outsized profits, not the clients. Both large and small investors should stick with low-cost index funds.”

If you’re thinking about taking his advice, here’s what you need to know about investing in index funds.

What Is an Index Fund?
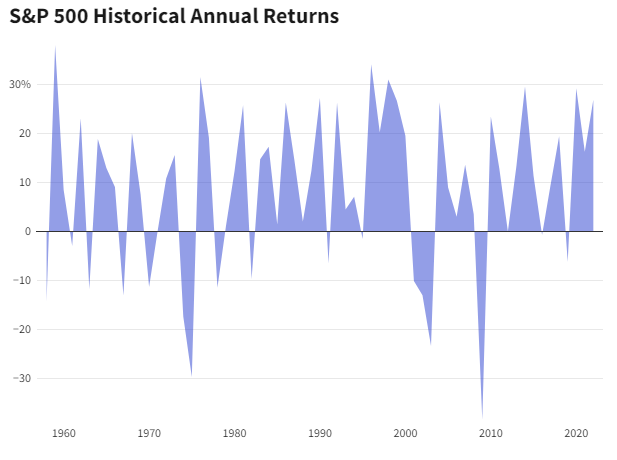
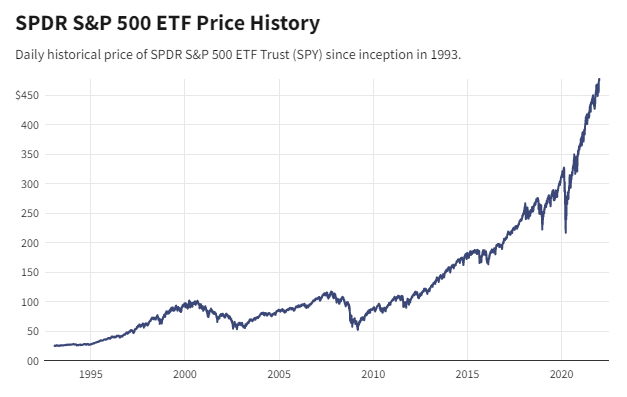
An index fund is a type of mutual fund or exchange-traded fund (ETF) that holds all (or a representative sample) of the securities in a specific index, with the goal of matching the performance of that benchmark as closely as possible. The S&P 500 is perhaps the most well-known index, but there are indexes—and index funds—for nearly every market and investment strategy you can think of. You can buy index funds through your brokerage account or directly from an index-fund provider, such as BlackRock or Vanguard.

etf-2.png


When you buy an index fund, you get a diversified selection of securities in one easy, low-cost investment. Some index funds provide exposure to thousands of securities in a single fund, which helps lower your overall risk through broad diversification. By investing in several index funds tracking different indexes you can built a portfolio that matches your desired asset allocation. For example, you might put 60% of your money in stock index funds and 40% in bond index funds.

The Benefits of Index Funds
The most obvious advantage of index funds is that they have consistently beaten other types of funds in terms of total return.

One major reason is that they generally have much lower management fees than other funds because they are passively managed. Instead of having a manager actively trading, and a research team analyzing securities and making recommendations, the index fund’s portfolio just duplicates that of its designated index. Index funds hold investments until the index itself changes (which doesn’t happen very often), so they also have lower transaction costs. Those lower costs can make a big difference in your returns, especially over the long haul.

etf-3.png


“Huge institutional investors, viewed as a group, have long underperformed the unsophisticated index-fund investor who simply sits tight for decades,” wrote Buffett in his 2014 shareholder letter. “A major reason has been fees: Many institutions pay substantial sums to consultants who, in turn, recommend high-fee managers. And that is a fool’s game.” What's more, by trading in and out of securities less frequently than actively managed fund do, index funds generate less taxable income that must be passed along to their shareholders.

Index funds have still another tax advantage. Because they buy new lots of securities in the index whenever investors put money into the fund, they may have hundreds or thousands of lots to choose from when selling a particular security. That means they can sell the lots with the lowest capital gains and, therefore, the lowest tax bite.​
 
what-is-spread-1.png


A spread can have several meanings in finance. Generally, the spread refers to the difference between two prices, rates, or yields. In one of the most common definitions, the spread is the gap between the bid and the ask prices of a security or asset, like a stock, bond, or commodity. This is known as a bid-ask spread.​
  • In finance, a spread refers to the difference between two prices, rates, or yields​
  • One of the most common types is the bid-ask spread, which refers to the gap between the bid (from buyers) and the ask (from sellers) prices of a security or asset​
  • Spread can also refer to the difference in a trading position – the gap between a short position (that is, selling) in one futures contract or currency and a long position (that is, buying) in another​

Understanding Spread
Spread can also refer to the difference in a trading position – the gap between a short position (that is, selling) in one futures contract or currency and a long position (that is, buying) in another. This is officially known as a spread trade.

what-is-spread-3.png


In underwriting, the spread can mean the difference between the amount paid to the issuer of a security and the price paid by the investor for that security—that is, the cost an underwriter pays to buy an issue, compared to the price at which the underwriter sells it to the public.

In lending, the spread can also refer to the price a borrower pays above a benchmark yield to get a loan. If the prime interest rate is 3%, for example, and a borrower gets a mortgage charging a 5% rate, the spread is 2%.

The bid-ask spread is also known as the bid-offer spread and buy-sell. This sort of asset spread is influenced by a number of factors:​
  • Supply or "float" (the total number of shares outstanding that are available to trade)​
  • Demand or interest in a stock​
  • Total trading activity of the stock​
  • For securities like futures contracts, options, currency pairs, and stocks, the bid-offer spread is the difference between the prices given for an immediate order—the ask—and an immediate sale – the bid. For a stock option, the spread would be the difference between the strike price and the market value.​

what-is-spread-4.png


One of the uses of the bid-ask spread is to measure the liquidity of the market and the size of the transaction cost of the stock. For example, on Jan. 11, 2022, the bid price for Alphabet Inc., Google's parent company, was $2,790.86 and the ask price was $2,795.47.1 The spread is $4.61. This indicates that Alphabet is a highly liquid stock, with considerable trading volume.

The spread trade is also called the relative value trade. Spread trades are the act of purchasing one security and selling another related security as a unit. Usually, spread trades are done with options or futures contracts. These trades are executed to produce an overall net trade with a positive value called the spread.

Spreads are priced as a unit or as pairs in future exchanges to ensure the simultaneous buying and selling of a security. Doing so eliminates execution risk wherein one part of the pair executes but another part fails.

open account.png

 
broker-1.png


A long-term investment strategy is one that entails holding investments for more than a full year. This strategy includes holding assets like bonds, stocks, exchange-traded funds (ETFs), mutual funds, and more. Individuals who take a long-term approach require discipline and patience, That's because investors must be able to take on a certain amount of risk while they wait for higher rewards down the road.

Many market experts recommend holding stocks for the long term. The S&P 500 experienced losses in only 11 of the 47 years from 1975 to 2022, making stock market returns quite volatile in shorter time frames.1 However, investors have historically experienced a much higher rate of success over the longer term.

broker-1.png


In a low-interest rate environment, investors may be tempted to dabble in stocks to boost short-term returns, but it makes more sense—and pays out higher overall returns—to hold on to stocks for the long term. In this article, we show how you may be able to benefit from holding stocks for a longer period of time.

Long-term investments almost always outperform the market when investors try and time their holdings.
Emotional trading tends to hamper investor returns.
The S&P 500 posted positive returns for investors over most 20-year time periods.
Riding out temporary market downswings is considered a sign of a good investor.
Investing long-term cuts down on costs and allows you to compound any earnings you receive from dividends.

Better Long-Term Returns
The term asset class refers to a specific category of investments. They share the same characteristics and qualities, such as fixed-income assets (bonds) or equities, which are commonly called stocks. The asset class that's best for you depends on several factors, including your age, risk profile and tolerance, investment goals, and the amount of capital you have. But which asset classes are best for long-term investors?

If we look at several decades of asset class returns, we find that stocks have generally outperformed almost all other asset classes. The S&P 500 returned an average of 11.82% per year between 1928 and 2021. This compares favorably to the 3.33% return of three-month Treasury bills (T-bills) and the 5.11% return of 10-year Treasury notes.

broker-2.png


Emerging markets have some of the highest return potentials in the equity markets, but also carry the highest degree of risk. This class historically earned high average annual returns but short-term fluctuations have impacted their performance. For instance, the 10-year annualized return of the MSCI Emerging Markets Index was 2.89% as of April 29, 2022.3

Small and large caps have also delivered above-average returns. For instance, the 10-year return for the Russell 2000 index, which measures the performance of 2,000 small companies, was 10.15%.4 The large-cap Russell 1000 index had an average return of 13.57% for the last 10 years, as of May 3, 2022.56

Ride Out Highs and Lows
Stocks are considered to be long-term investments. This is, in part, because it's not unusual for stocks to drop 10% to 20% or more in value over a shorter period of time. Investors have the opportunity to ride out some of these highs and lows over a period of many years or even decades to generate a better long-term return.

broker-3.png


Looking back at stock market returns since the 1920s, individuals have rarely lost money investing in the S&P 500 for a 20-year time period. Even considering setbacks, such as the Great Depression, Black Monday, the tech bubble, and the financial crisis, investors would have experienced gains had they made an investment in the S&P 500 and held it uninterrupted for 20 years.

While past results are no guarantee of future returns, it does suggest that long-term investing in stocks generally yields positive results, if given enough time.​

open account.png

1:1000 Leverage | Spread from Zero | %40 Deposit Bonus | Negative Balance Protection
 
broker.png


Have you ever wondered what happened to your socks when you put them into the dryer and then never saw them again? It's an unexplained mystery that may never have an answer. Many people feel the same way when they suddenly find that their brokerage account balance has taken a nosedive. Where did that money go?

Fortunately, money that is gained or lost on a stock doesn't just disappear. Read to find out what happens to it and what causes it.​
  • When a stock tumbles and an investor loses money, the money doesn't get redistributed to someone else.​
  • Essentially, it has disappeared into thin air, reflecting dwindling investor interest and a decline in investor perception of the stock.​
  • That's because stock prices are determined by supply and demand and investor perception of value and viability.​
1.png


Disappearing Money
Before we get to how money disappears, it is important to understand that regardless of whether the market is rising–called a bull market–or falling–called a bear market–supply and demand drive the price of stocks. And it's the fluctuations in stock prices that determines whether you make money or lose it.

Buy and Sell Trades
If you purchase a stock for $10 and sell it for only $5, you will lose $5 per share. It may feel like that money must go to someone else, but that isn't exactly true. It doesn't go to the person who buys the stock from you.

2.png


For example, let's say you were thinking of buying a stock at $15, and before you decide to buy it, the stock falls to $10 per share. You decide to purchase at $10, but you didn't gain the $5 depreciation in the stock price. Instead, you got the stock at the current market value of $10 per share. In your mind, you saved $5, but you didn't actually earn a $5 profit. However, if the stock rises from $10 back to $15, you have a $5 gain, but it has to move back higher for you to gain the $5 per share.

The same is true if you're holding a stock and the price drops, leading you to sell it for a loss. The person buying it at that lower price–the price you sold it for–doesn't necessarily profit from your loss and must wait for the stock to rise before making a profit.

The company that issued the stock doesn't get the money from your declining stock price either.


There are investors who place trades with a broker to sell a stock at a perceived high price with the expectation that it'll decline. These are called short-selling trades. If the stock price falls, the short seller profits by buying the stock at the lower price–closing out the trade. The net difference between the sale and buy prices is settled with the broker. Although short-sellers are profiting from a declining price, they're not taking your money when you lose on a stock sale. Instead, they're doing independent transactions with the market and have just as much of a chance to lose or be wrong on their trade as investors who own the stock.

In other words, short-sellers profit on price declines, but it's a separate transaction from bullish investors who bought the stock and are losing money because the price is declining.​

open account.png

1:1000 Leverage | Spread from Zero | %40 Deposit Bonus | Negative Balance Protection
 
sp500-5.png


The S&P 500—short for the Standard & Poor's 500 Index—is a market-capitalization-weighted index of 500 leading publicly traded companies in the U.S. While it assumed its present size (and name) in 1957, the S&P actually dates back to the 1920s, becoming a composite index tracking 90 stocks in 1926. The average annualized return since its inception in 1926 through Dec. 31, 2021, is 10.49%. 2 The average annualized return since adopting 500 stocks into the index in 1957 through Dec. 31, 2021, is 10.67%.

sp500-1.png


The average annual return (AAR) is the percentage showing the return of a mutual fund in a given period. In other words, it measures a fund's long-term performance, so it's a key tool for investors considering a mutual fund investment.

> The S&P 500 index acts as a benchmark of the performance of the U.S. stock market overall, dating back to the 1920s (in its current form, to the 1950s).
> The index has returned a historic annualized average return of around 10.5% since its 1957 inception through 2021.
> While that average number may sound attractive, timing is everything: Get in at a high or out at a relative low and you will not enjoy such returns.

sp500-3.png


The History of the S&P 500
> During the first decade after its introduction in 1957, and reflecting the economic expansion in the U.S after World War II, the value of the index rose to slightly over 800.
> From 1969 to 1981, the index gradually declined to fall under 360 as a sign of high inflation.
> During the 2008 financial crisis and the Great Recession, the S&P 500 fell 46.13% from October 2007 to March 2009.
> By March 2013, the S&P bounced back from the crisis and continued on its 10-year bull run from 2009 to 2019 to climb more than 250%.
> The COVID-19 pandemic in 2020 and the subsequent recession caused the S&P 500 to plummet nearly 20%.
> The S&P 500 recovered during the second half of 2020 reaching a number of all-time highs in 2021.


How Inflation Affects S&P 500 Returns
One of the major problems for an investor hoping to regularly recreate that 10.67% average return is inflation. Adjusted for inflation, the historical average annual return is only around 7%. There is an additional problem posed by the question of whether that inflation-adjusted average is accurate, since the adjustment is done using the inflation figures from the Consumer Price Index (CPI), whose numbers some analysts believe vastly understate the true inflation rate.​

open account.png

1:1000 Leverage | Spread from Zero | %40 Deposit Bonus | Negative Balance Protection

broker-1.png


The S&P 500 Index has long been one of the best-known proxies for the U.S. stock market, and several mutual funds and exchange traded funds (ETFs) that passively track the index have become popular investment vehicles. These funds do not seek to outperform the index through active trading, stock picking, or market timing; instead, relying on the inherent diversification of the broad index to generate returns.

Indeed, over long-term horizons, the index typically produces better returns than actively managed portfolios, especially after taking into account taxes and fees. So, what if you had just held the S&P 500, using an index fund or some other means of holding the stocks in it?

> The S&P 500 Index is a broad-based measure of large corporations traded on U.S. stock markets.
> Over long periods of time, passively holding the index often produces better results than actively trading or picking single stocks.
> Over long-term horizons, the index typically produces better returns than actively managed portfolios.

broker-2.png


What If You Had Invested in Just the S&P 500?
People often use the S&P 500 as a yardstick for investing success. Active traders or stock-picking investors are often judged against this benchmark in hindsight to evaluate their savvy.

Let's take a historical example: Soon after Donald Trump entered the race for the Republican nomination for president, the press zeroed in on his net worth. Financial experts have pegged his net worth at $2.5 billion. One of the cornerstones of Trump's campaign was his success as a businessperson and his ability to create such wealth. However, financial experts have pointed out that if Trump had liquidated his real estate holdings—estimated to be worth $500 million—back in 1987, and invested them in the S&P 500 Index, his net worth could be as much as $13 billion.

It is just one more example of how the S&P 500 Index continues to be held up as the standard by which all investment performances are measured. Investment managers are paid a lot of money to generate returns for their portfolios that beat the S&P 500, yet on average, most don't.

This is the reason why an increasing number of investors are turning to index funds and ETFs that simply try to match the performance of this index. If Trump had done so back in 1987, he would have made 26 times his money for an average annualized return of 12.3% by the time he was inaugurated (from 1987 to 2015—the date of calculation for projected net worth). But hindsight is 20/20, and he could not have known that.

open account.png

1:1000 Leverage | Spread from Zero | %40 Deposit Bonus | Negative Balance Protection
 
sp500-2.png


Another major factor in annual returns for an investor in the S&P 500 is when they choose to enter the market. For example, the SPDR S&P 500 ETF Trust (SPY), which basically duplicates the index, performed very well for an investor who bought between 1996 and 2000 but experienced a consistent downward trend from 2000 to 2002.

Investors who buy during market lows and hold their investment, or sell at market highs, will experience larger returns than investors who buy during market highs, particularly if they then sell during dips.

It's clear that the timing of a stock purchase plays a role in its returns. For those who want to avoid the missed opportunity of selling during market lows, but don't want the risk of active trading, dollar-cost averaging is an option.

sp500-1.png


What Is the S&P 500 Index?
The S&P 500 Index is a collection of stocks intended to reflect the overall return characteristics of the stock market as a whole. The stocks that make up the S&P 500 are selected by market capitalization, liquidity, and industry. Companies to be included in the S&P are selected by the S&P 500 Index Committee, which consists of a group of analysts employed by Standard & Poor's.

The index primarily mirrors the overall performance of large-cap stocks. The S&P 500 is considered by analysts to be a leading economic indicator for both the stock market and the U.S. economy. The 30 stocks that make up the Dow Jones Industrial Average were previously considered the primary benchmark indicator for U.S. equities, but the S&P 500, a much larger and more diverse group of stocks, has supplanted it in that role over time.

It's difficult for most individual investors to actually be invested in the S&P 500 themselves since that would involve buying 500 individual stocks. However, investors can easily mirror the index's performance by investing in an S&P 500 Index exchange-traded fund, which duplicates the index's holdings in its portfolio and so corresponds to its return and yield. Since ETFs are frequently recommended for beginning and risk-averse investors, the S&P 500 is a popular choice for many investors trying to capture a diversified selection of the market.

open account.png

1:1000 Leverage | Spread from Zero | %40 Deposit Bonus | Negative Balance Protection
 
Screenshot-2.png


Stock price is an indicator of a company's market value, but the price of a share of stock will also depend on the number of shares outstanding. The reason why certain stocks are priced so high is usually due to the company having never or rarely having completed a stock split.

There are many ways to evaluate a stock in addition to its absolute share price. Here, we take a look at some of the largest companies in the U.S. and abroad.​
  • Companies are typically valued by their total market capitalization on a stock exchange, or number of shares outstanding times the share price.​
  • Still, many investors are interested in the most pricey shares available on an exchange, which can indicate exclusivity.​
  • Companies can also be ranked by revenue and profitability.​

Top Companies by Stock Price
The most expensive publicly traded share of all time is Warren Buffett’s Berkshire Hathaway (BRK.A), which was trading at $458,675 per share, as of January 2022. Berkshire hit an all-time high on Jan. 18, 2022, at $487,255. Thanks to spectacular shareholder gains and the idiosyncrasies of its founder, this share value is unlikely to be matched by anything other than continued gains in Berkshire’s share price.

Screenshot-1.png


Top Companies by Market Cap
By market capitalization, as of January 2022, Apple (AAPL) is the biggest company at $2.652 trillion, followed by Microsoft (MSFT) at $2.222 trillion, Google (GOOGL) at $1.725 trillion, Amazon.com (AMZN) at $1.446 trillion, Tesla (TSLA) at $947.92 billion, and Meta (FB), formerly Facebook, at $843.34 billion.

Screenshot-3.png


Back in 2007, Chinese energy giant PetroChina (PTR) reached an estimated market value of around $1 trillion. However, this valuation didn't stick. As of January 2022, PTR's market capitalization stood at just $146.95 billion.

The Bottom Line
On a pure market value measure, Apple has often been considered the most valuable, publicly traded company of all time. Although Microsoft did briefly hit the $2 trillion market cap mark in June 2021. It is certainly possible another company’s market cap will exceed these measures, and maybe—though less likely—another company will surpass Berkshire Hathaway as the highest priced single stock share.​

open account.png

1:1000 Leverage | Spread from Zero | %40 Deposit Bonus | Negative Balance Protection
 
margin-call.png


A margin call occurs when the value of an investor’s margin account falls below the broker’s required amount. An investor’s margin account contains securities bought with borrowed money (typically a combination of the investor’s own money and money borrowed from the investor’s broker).

A margin call refers specifically to a broker’s demand that an investor deposit additional money or securities into the account so that it is brought up to the minimum value, known as the maintenance margin.

margin-call-1.png


A margin call is usually an indicator that one or more of the securities held in the margin account has decreased in value. When a margin call occurs, the investor must choose to either deposit additional funds or marginable securities in the account or sell some of the assets held in their account.​
  • A margin call occurs when a margin account runs low on funds, usually because of a losing trade.​
  • Margin calls are demands for additional capital or securities to bring a margin account up to the minimum maintenance margin.​
  • Brokers may force traders to sell assets, regardless of the market price, to meet the margin call if the trader doesn’t deposit funds.​
  • Since short sales can only be made in margin accounts, margin calls can also occur when a stock goes up in price and losses start mounting in accounts that have sold the stock short.​

open account.png

1:1000 Leverage | Spread from Zero | %40 Deposit Bonus | Negative Balance Protection
 
whats-is-blockchain.png


A blockchain is a distributed database that is shared among the nodes of a computer network. As a database, a blockchain stores information electronically in digital format. Blockchains are best known for their crucial role in cryptocurrency systems, such as Bitcoin, for maintaining a secure and decentralized record of transactions. The innovation with a blockchain is that it guarantees the fidelity and security of a record of data and generates trust without the need for a trusted third party.

One key difference between a typical database and a blockchain is how the data is structured. A blockchain collects information together in groups, known as blocks, that hold sets of information. Blocks have certain storage capacities and, when filled, are closed and linked to the previously filled block, forming a chain of data known as the blockchain. All new information that follows that freshly added block is compiled into a newly formed block that will then also be added to the chain once filled.

A database usually structures its data into tables, whereas a blockchain, like its name implies, structures its data into chunks (blocks) that are strung together. This data structure inherently makes an irreversible timeline of data when implemented in a decentralized nature. When a block is filled, it is set in stone and becomes a part of this timeline. Each block in the chain is given an exact time stamp when it is added to the chain.​

open account.png

1:1000 Leverage | Spread from Zero | %40 Deposit Bonus | Negative Balance Protection
 
what-does-atr-tell-you.png


Wilder originally developed the ATR for commodities, although the indicator can also be used for stocks and indices. Simply put, a stock experiencing a high level of volatility has a higher ATR, and a low volatility stock has a lower ATR.

The ATR may be used by market technicians to enter and exit trades, and is a useful tool to add to a trading system. It was created to allow traders to more accurately measure the daily volatility of an asset by using simple calculations. The indicator does not indicate the price direction; rather it is used primarily to measure volatility caused by gaps and limit up or down moves. The ATR is fairly simple to calculate and only needs historical price data.

The ATR is commonly used as an exit method that can be applied no matter how the entry decision is made. One popular technique is known as the "chandelier exit" and was developed by Chuck LeBeau. The chandelier exit places a trailing stop under the highest high the stock reached since you entered the trade. The distance between the highest high and the stop level is defined as some multiple times the ATR.

Screenshot-6.png


For example, we can subtract three times the value of the ATR from the highest high since we entered the trade.

The ATR can also give a trader an indication of what size trade to put on in derivatives markets. It is possible to use the ATR approach to position sizing that accounts for an individual trader's own willingness to accept risk as well as the volatility of the underlying market.​


open account.png

1:1000 Leverage | Spread from Zero | %40 Deposit Bonus | Negative Balance Protection
 
Back
Top