Technical Analysis by Admiral Markets

EUR/USD Confluence At Daily L3 Camarilla Pivot

22.05.jpg


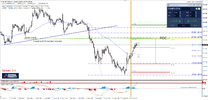
The EUR/USD broke above 1.1200 level on Friday and it is normal that we are seeing the retracement at this point. Remember, always mark yesterday's high & low. Those were the definitive points where buyers or sellers came in the day before. Usually we see a retest of those points. Because the pair is in uptrend it could spike from the bullish POC 1.1155-70 (trend line, ATR pivot, D L3, 38.2) targeting 1.1211 followed by 1.1250-65. The ATR of EUR/USD is not that high, so pay attention to levels and POC zone. Ideally 1.1120 should hold for bullish scenario to be valid.
 
GBP/USD Bearish Divergence Could Bring the Pair Lower

26.05.jpg


The GBP/USD is still in uptrend on 4h but it is showing a bearish divergence that could tank the price lower. 1.2830 is support and if the support breaks, the pair could head towards 1.2785. In case of retracement, we might see 1.2900-1.2915 the POC zone (inner trend line, ATR pivot, W4, EMA89). The POC zone could also reject the price towards 1.2830 and 1.2785. At this point the interim resistance is 23.6 fib - 1.2886 so short term traders could possibly reject the price from that level in the form of short term momentum trades.

Follow@TarantulaFXon twitter for latest market updates

Connect withNenad Kerkez Ton Facebook for latest market updates.

W L3 - Weekly Camarilla Pivot (Weekly Interim Support)

W H3 - Weekly Camarilla Pivot (Weekly Interim Resistance)

W H4 - Weekly Camarilla Pivot (Strong Weekly Resistance)

D H4 - Daily Camarilla Pivot (Very Strong Daily Resistance)

D L3 – Daily Camarilla Pivot (Daily Support)

D L4 – Daily H4 Camarilla (Very Strong Daily Support)

POC - Point Of Confluence (The zone where we expect price to react aka entry zone)
 
USD/JPY Bearish X-Cross Within 111.20 Zone

31.05.jpg


The USD/JPY has been dropping lately, but it has been more of a slow grind than momentum surge. During this slow grind, the price has established a POC zone within 111.15-30 (D H4, 38.2, inner trend line, EMA89, ATR Pivot). X-Cross ™ represents the cross of a trendline with an important pivot point or fib level. In this example we have both fib level and a camarilla pivot, so my assumption is that the X cross is strong. Rejections should aim for 110.65. Break of 110.65 aims for 110.36 and 110.17.
 
USD/CAD Possible Retest of W H4/ D H5 Zone

0506.jpg


As doubts grow of over-supply in the Oil market, its price continues to drift lower, putting pressure on the CAD, I expect this weakness of the CAD to be more prevalent than the USD weakness of recent. At this point we can see a slow bullish grind on intra day time frame towards W H4/D H5 confluence zone 1.3540-50. The POC zone (trend line, 50.0, D L3, Atr pivot, historical buyers) might spike the price up towards 1.3500, 1.3520 and if 1.3520 breaks towards 1.3550. The price is above W L3 and D L3 so the bulls are currently in control. The price should ideally stay above 1.3422 for bullish outcome.
 
EUR/USD Two Breakout Points Outside The Equidistant Channel

upload_2017-8-10_11-12-32.png


The EUR/USD has perfectly rejected from both POCs after the setup and analysis shown on Weekly Recap and at this time it is very clear that the equidistant channel is trapping the price keeping the range bound market still in play. After a fake-out that happened yesterday 1.1720-1.1690 (which was still good to trade as a breakout trade, and what I showed during the Live Trading webinar) we can see two POC zones within the equidistant channel that might push or tank the price. If the price spikes above 1.1778 (EMA89, D H3, channel high) the target is 1.1798 and 1.1825. Above 1.1832 we should see a continuation towards 1.1875 and 1.1910. Below 1.1668 (D L5, ATR projection low, channel low), the price could drop to 1.1584.

Follow @TarantulaFX on twitter for latest market updates

Connect with Nenad Kerkez T on Facebook for latest market updates.

W L3 - Weekly Camarilla Pivot (Weekly Interim Support)

W H3 - Weekly Camarilla Pivot (Weekly Interim Resistance)

W H4 - Weekly Camarilla Pivot (Strong Weekly Resistance)

M H4 - Monthly Camarilla Pivot (Very Strong Monthly Resistance)

M L3 – Monthly Camarilla Pivot (Monthly Support)

M L4 – Monthly H4 Camarilla (Very Strong Monthly Support)

POC - Point Of Confluence (The zone where we expect price to react aka entry zone)

Risk disclosure: Forex and CFD trading carries a high level where losses can exceed your deposits. This material is does not contain, and should not be construed as containing, investment advice or an investment recommendation or, an offer of or solicitation for any transactions in financial instruments. Please note that the trading analyses which refers to past performance, may change over time. No representation is given as to the accuracy or completeness of the information and any person acting upon it does so entirely at their own risk. Before making any investment decisions, you should seek advice from independent financial advisor to ensure you understand the risks involved.
 
GBP/USD Consolidating But Pay Attention To POC Zone

upload_2017-8-11_15-51-51.png


The GBP/USD is consolidating within the rectangle pattern. The consolidation is due to the US CPI data at 12:30 GMT. Traders need to pay attention to 1.2992 the X-cross of a trend line and D H3 camarilla pivot. Move above the trend line could possible spike the GBP/USD to POC zone 1.3040-60 (D H5, Rectangle top, ATR projection high, 50.0 fib, Order block) where we might see fresh sellers. The price should reject towards 1.2992 and 1.2940. Only below 1.2940 we should see the continuation towards D H5/ ATR low 1.2910.

Follow @TarantulaFX on twitter for latest market updates

Connect with Nenad Kerkez T on Facebook for latest market updates.

W L3 - Weekly Camarilla Pivot (Weekly Interim Support)

W H3 - Weekly Camarilla Pivot (Weekly Interim Resistance)

W H4 - Weekly Camarilla Pivot (Strong Weekly Resistance)

M H4 - Monthly Camarilla Pivot (Very Strong Monthly Resistance)

M L3 – Monthly Camarilla Pivot (Monthly Support)

M L4 – Monthly H4 Camarilla (Very Strong Monthly Support)

POC - Point Of Confluence (The zone where we expect price to react aka entry zone)

Risk disclosure: Forex and CFD trading carries a high level where losses can exceed your deposits. This material is does not contain, and should not be construed as containing, investment advice or an investment recommendation or, an offer of or solicitation for any transactions in financial instruments. Please note that the trading analyses which refers to past performance, may change over time. No representation is given as to the accuracy or completeness of the information and any person acting upon it does so entirely at their own risk. Before making any investment decisions, you should seek advice from independent financial advisor to ensure you understand the risks involved.
 
EUR/JPY Close to 78.6 Fib Retracement

upload_2017-8-14_11-49-24.png


The EUR/JPY broke below the leaned head and shoulders pattern and touched the 128.04 before making a correction. At this point the price is close to possibly completing a correction due to a cluster of strong confluence points that make the POC zone. The POC 129.80-113.00 (W H4, D H4, bearish order block, 78.6, ATR high) could reject the price towards D H3 -129.40 but only a H1 momentum candle or H4 candle close below 129.40 could further tank the price towards 129.00 and 128.60.

Follow @TarantulaFX on twitter for latest market updates

Connect with Nenad Kerkez T on Facebook for latest market updates.

W L3 - Weekly Camarilla Pivot (Weekly Interim Support)

W H3 - Weekly Camarilla Pivot (Weekly Interim Resistance)

W H4 - Weekly Camarilla Pivot (Strong Weekly Resistance)

M H4 - Monthly Camarilla Pivot (Very Strong Monthly Resistance)

M L3 – Monthly Camarilla Pivot (Monthly Support)

M L4 – Monthly H4 Camarilla (Very Strong Monthly Support)

POC - Point Of Confluence (The zone where we expect price to react aka entry zone)

Risk disclosure: Forex and CFD trading carries a high level where losses can exceed your deposits. This material is does not contain, and should not be construed as containing, investment advice or an investment recommendation or, an offer of or solicitation for any transactions in financial instruments. Please note that the trading analyses which refers to past performance, may change over time. No representation is given as to the accuracy or completeness of the information and any person acting upon it does so entirely at their own risk. Before making any investment decisions, you should seek advice from independent financial advisor to ensure you understand the risks involved.
 

Attachments

  • 1408.png
    1408.png
    72.7 KB · Views: 1
  • 1408.png
    1408.png
    72.7 KB · Views: 0
  • 1408.png
    1408.png
    72.7 KB · Views: 1
USD/CAD Flat Top Ascending Triangle Uptrend

The USD/CAD has been in a steady uptrend. The price has formed an ascending flat top triangle that suggest an uptrend continuation. But the price has already reached the W H4 camarilla pivot so bulls need to be careful. If the pair breaks 1.2760 then 1.2805 will be possible. If there is no breakout to the upside then a retracement towards the POC 1.2700-15 (50.0, D L3, ascending triangle trend line, EMA89) will be possible. New buyers might appear within the POC zone and spike the price up towards the 1.2760 and above mentioned targets. However, bulls should pay attention to 1.2700 break to the downside. If that happens, the pair might experience a temporary weakness leading to 1.2656-45 zone.

Risk disclosure: Forex and CFD trading carries a high level where losses can exceed your deposits. This material is does not contain, and should not be construed as containing, investment advice or an investment recommendation or, an offer of or solicitation for any transactions in financial instruments. Please note that the trading analyses which refers to past performance, may change over time. No representation is given as to the accuracy or completeness of the information and any person acting upon it does so entirely at their own risk. Before making any investment decisions, you should seek advice from independent financial advisor to ensure you understand the risks involved.

1508.png


GBP/USD Weekly L3 and D H4 Confluence In Downtrend


2408.jpg1554x927 266 KB


The GBP/USD broke below 1.2020, the weekly L3 level, thus turning the support into a resistance. After a short breakout that I showed on live trading webinar yesterday, the pair started to retrace towards the POC zone 1.2830-50 (Order block, ATR high, trend line, D H5, EMA89). The price could reject there towards the 1.2880 and 1.2770. Only a break below 1.2768 could spur additional weakness in the pair towards 1.2740 zone. The market is calm at this point but the increased volatility is expected during the 2017 Economic Symposium, "Fostering a Dynamic Global Economy", which will take place Aug. 24-26, 2017 at Jackson Hole, WY.
Renewed bulls strength in the pair should manifest on a 4h candle close above 1.2855. That could be a sign for a further correction towards 1.2925.

Follow @TarantulaFX on twitter for latest market updates
Connect with Nenad Kerkez T on Facebook for latest market updates.

W L3 - Weekly Camarilla Pivot (Weekly Interim Support)
W H3 - Weekly Camarilla Pivot (Weekly Interim Resistance)
W H4 - Weekly Camarilla Pivot (Strong Weekly Resistance)
D H4 - Daily Camarilla Pivot (Very Strong Daily Resistance)
D L3 – Daily Camarilla Pivot (Daily Support)
D L4 – Daily H4 Camarilla (Very Strong Daily Support)
POC - Point Of Confluence (The zone where we expect price to react aka entry zone)

Risk disclosure - Forex and CFD trading carries a high level where losses can exceed your deposits. This material is does not contain, and should not be construed as containing, investment advice or an investment recommendation or, an offer of or solicitation for any transactions in financial instruments. Please note that the trading analyses which refers to past performance, may change over time. No representation is given as to the accuracy or completeness of the information and any person acting upon it does so entirely at their own risk. Before making any investment decisions, you should seek advice from independent financial advisor to ensure you understand the risks involved.
 
GBP/USD BOE Official Bank Rate Decision Important Levels


1409.jpg1554x751 232 KB


The Bank of England MPC decision is due at 11 PM GMT. Market is expecting that policymakers leave interest rates at 0.25 %. But what traders and investors should be focused at is how many of policymakers will vote for a hike and how many will be against the hike. Technically the GBP/USD is in uptrend but that can easily change after today's data and MPC official bank rate votes. 1.3270-85 is the important zone (W H3, D H4, ATR projection high) and the price could reject from the zone once the zone is hit. If the price proceeds above the zone 1.3330-1.3365 is the next zone (D H5, historical bearish order block, previous high, W H4) and rejections should happen there too. On the contrary, 1.3015-1.3030 POC (W L4, previous double bottom, historical order block bullish) could spike the price upwards. Due to huge expected volatility targets are between these important zones marked as Daily camarilla levels as shown on the chart.

Watch for these zones and potential rejections, and for safer trading, use the volatility protection tool.

W L3 - Weekly Camarilla Pivot (Weekly Interim Support)

W H3 - Weekly Camarilla Pivot (Weekly Interim Resistance)

W H4 - Weekly Camarilla Pivot (Strong Weekly Resistance)

D H4 - Daily Camarilla Pivot (Very Strong Daily Resistance)

D L3 – Daily Camarilla Pivot (Daily Support)

D L4 – Daily H4 Camarilla (Very Strong Daily Support)

POC - Point Of Confluence (The zone where we expect price to react aka entry zone)

Follow @TarantulaFX on twitter for latest market updates

Sign up for Live Trading Webinars with Nenad Kerkez T

Connect with Nenad Kerkez T on Facebook for latest market updates

Risk disclosure - Forex and CFD trading carries a high level where losses can exceed your deposits. This material is does not contain, and should not be construed as containing, investment advice or an investment recommendation or, an offer of or solicitation for any transactions in financial instruments. Please note that the trading analyses which refers to past performance, may change over time. No representation is given as to the accuracy or completeness of the information and any person acting upon it does so entirely at their own risk. Before making any investment decisions, you should seek advice from independent financial advisor to ensure you understand the risks involved.
 
Back
Top