Tifia Forex Broker Daily Market Analytics, Analytics and trading recommendations by Tifia Company

XAU/USD: the price of gold rose against the background of a weakening dollar

21/09/2018

Current dynamics


Prices for gold increased by $ 3 to $ 1277.00 per troy ounce on Thursday. The sale of the dollar and its weakening contributed to higher prices for commodities and precious metals.

On Friday, during the Asian and early European sessions, the dollar's decline continued, however, closer to the beginning of the US trading session, the dollar moved to a positive territory.

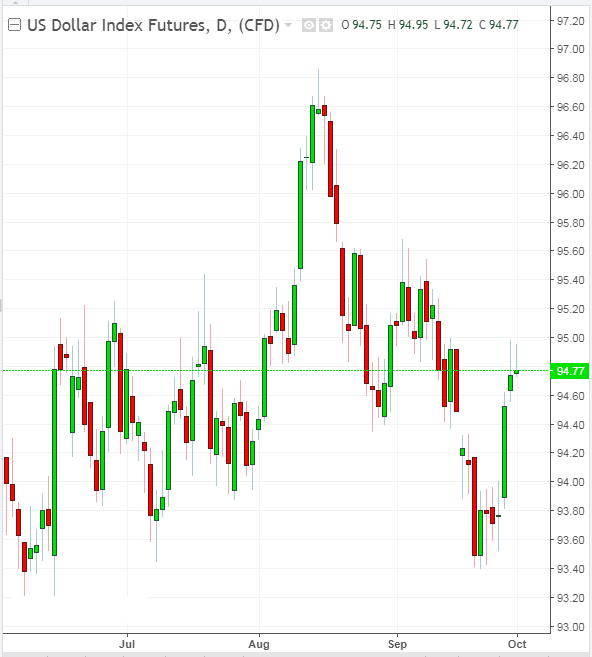
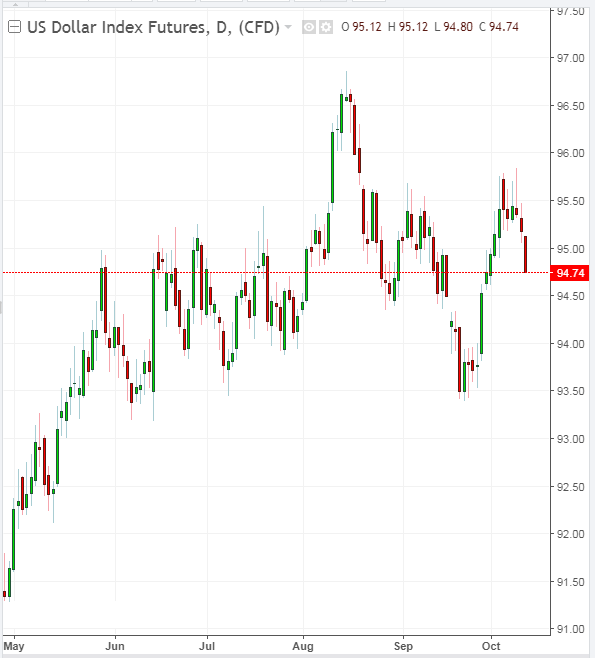
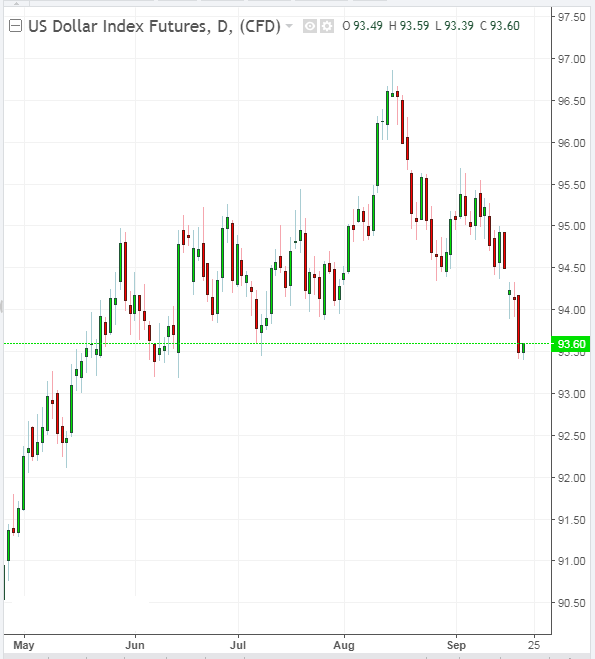
The dollar index DXY, which tracks the rate of the US currency against the basket of 6 other major currencies, after rising sharply on Thursday to the June 2018 mark, is growing on Friday at the beginning of the US trading session near the 93.61 mark.

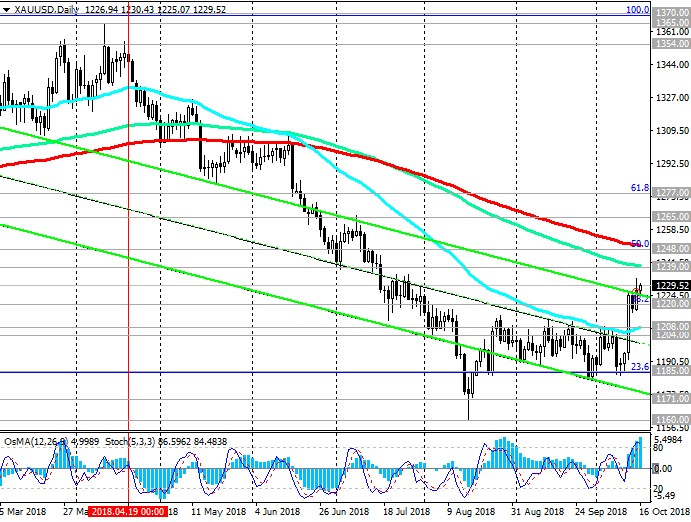
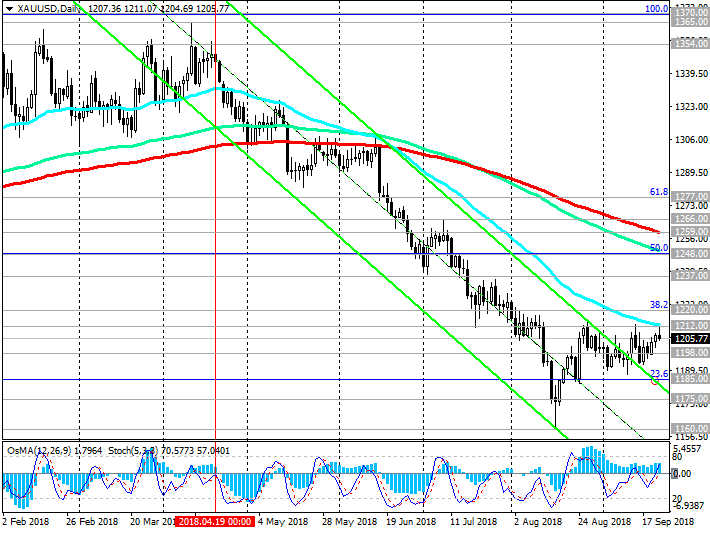
The pair XAU / USD also declines after rising yesterday. At the same time, XAU / USD continues to trade in the range between resistance levels 1212.00 (EMA50 on the daily chart) and 1185.00 (Fibonacci level 23.6% of the correction to the wave of decline since July 2016), pending the meeting of the Federal Reserve System, which will take place at the next week (September 25 - 26) to assess the prospects for the monetary policy of the Fed. With an increase in the Fed's interest rate, the price of gold usually falls.

The overall trend of XAU / USD, still remains bearish. Another test of the resistance level 1212.00 (EMA50 on the daily chart) is possible. However, further growth is unlikely, unless, of course, the dollar will not resume a decline.

Investors take into account the 100% probability of an increase in the Fed's interest rate in September. In conditions of an increase in the interest rate, the investment attractiveness of the dollar is growing, and gold is falling.

*)An advanced fundamental analysis is available on the Tifia Forex Broker website at tifia.com/analytics


Support and resistance levels

Since mid-April, XAU / USD is trading in a downward channel on the daily chart, the lower limit of which is near the support level of 1128.00 (the low of 2016).

Below the key resistance level of 1259.00 (EMA200 on the daily chart), the downside dynamics prevails.

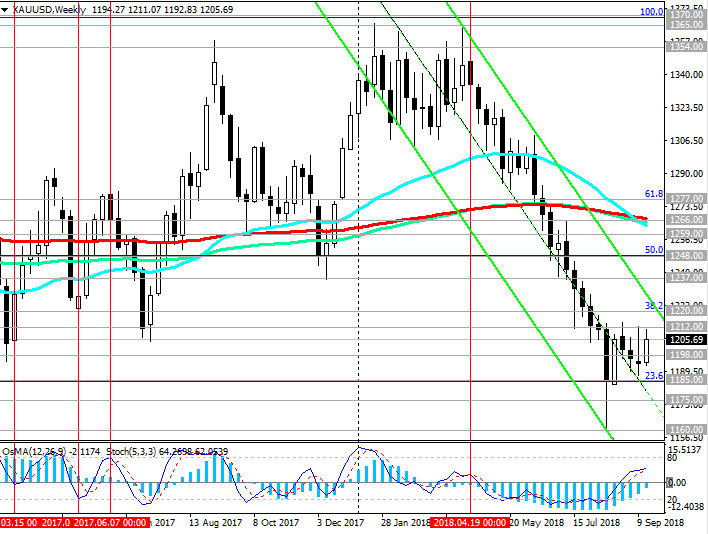
The breakdown of the support level of 1185.00 (the Fibonacci level 23.6% of the correction to the wave of decline since July 2016) will confirm the return of XAU / USD to the global downtrend that began in October 2012.

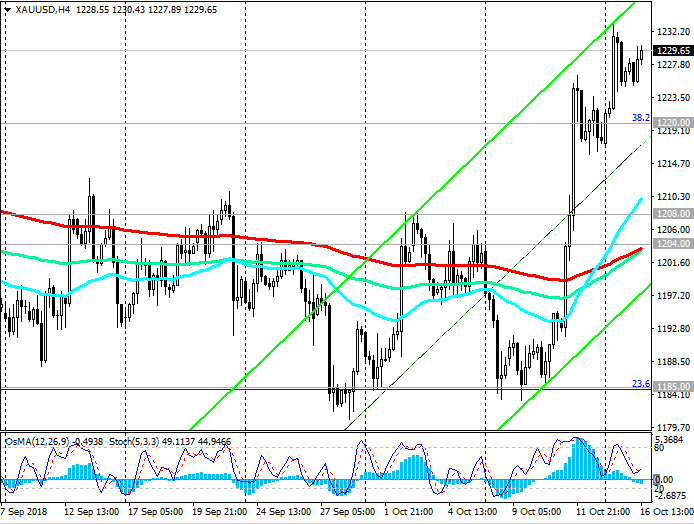
The signal for medium-term purchases and the development of an alternative scenario will be a breakdown of the resistance level at 1212.00. In this case, the corrective growth can last up to resistance level 1220.00 (Fibonacci level 38.2%). Short positions are preferred below this level.

Support levels: 1200.00, 1198.00, 1185.00, 1175.00, 1160.00, 1128.00

Levels of resistance: 1212.00, 1220.00, 1237.00, 1248.00, 1259.00, 1266.00, 1277.00


Trading Scenarios


Sell Stop 1206.00. Stop-Loss 1213.00. Take-Profit 1200.00, 1198.00, 1185.00, 1175.00, 1160.00, 1128.00

Buy Stop 1213.00. Stop-loss 1206.00. Take-Profit 1220.00, 1225.00, 1237.00, 1248.00, 1259.00, 1266.00


210918-_DXY.png


210918-_XU-w.png


210918-_XU-_D.png


*) For up-to-date and detailed analytics and news on the forex market visit Tifia Forex Broker website tifia.com
 
NZD/USD: market expectations in connection with the meetings of the Fed and the RBNZ

25/09/2018

Current dynamics


On Wednesday, the two largest world central banks will hold meetings and decide on the interest rate. The Federal Reserve's decision on the interest rate will be published at 18:00 (GMT). It is widely expected that the rate will be increased by 0.25% to 2.25%, and this increase is already included in the price. Investors are more interested in the press conference and the opinion of Federal Reserve Chairman Powell on the prospects for monetary policy for 2019.

If Powell signals about the possibility of a faster increase in the interest rate, this will cause the dollar to strengthen and the US stock markets fall. Any hint of Powell that the Fed can pause, will bring down the dollar.

On the part of the RB of New Zealand, investors do not expect a change in the current monetary policy, despite strong macro data published last week. As the Bureau of Statistics of New Zealand reported, the country's GDP grew by 1.0% in the second quarter or by 2.8% in annual terms (the forecast was + 0.8% and + 2.5%, respectively). The pace of economic growth exceeded the expectations of the central bank by two times.

Moreover, the comments of the bank may indicate the possibility of lowering interest rates if economic growth does not accelerate. Probably, the head of RBNZ Adrian Orr will once again confirm the bank's desire to pursue a soft monetary policy, which will lead to pressure on the New Zealand currency. In any case, the volatility in the New Zealand dollar trade is expected to grow during the RBNZ press conference, which will begin on Wednesday at 22:00 (GMT).

The different focus of monetary policy in the US and New Zealand will further increase the difference between interest rates in the US and New Zealand. And this is the main fundamental factor for further reduction of NZD / USD. The main global trend of the pair NZD / USD, is still bearish.

*)An advanced fundamental analysis is available on the Tifia Forex Broker website at tifia.com/analytics


Trading scenarios

On Thursday, the NZD / USD attempted a breakdown of a strong resistance level of 0.6668 (EMA50 on the daily chart). Nevertheless, the breakdown of this level turned out to be false, and NZD / USD again declines, heading down the descending channel on the daily chart. Its lower limit passes below the local support level of 0.6505 (the lows of the year and September).

A confirmation of the resumption of the main scenario is the breakdown of the short-term support levels 0.6638 (EMA200 on the 4-hour chart), 0.6627 (EMA200 on the 1-hour chart).

A signal for the development of an upward correction may be a breakdown of the local resistance level of 0.6700. The correction target can be resistance levels of 0.6725, 0.6740. Long-term growth targets are resistance levels of 0.6865 (Fibonacci level 23.6% of the upward correction to the global wave of the pair's decline from the level of 0.8800, which began in July 2014; the minimums of the wave are near 0.6260), 0.6900 (EMA200 on the daily chart).

Nevertheless, short positions are preferable.

Support levels: 0.6638, 0.6627, 0.6600, 0.6585, 0.6505, 0.6410

Resistance levels: 0.6700, 0.6725, 0.6740, 0.6800, 0.6865, 0.6900


Trading Scenarios


Sell Stop 0.6625. Stop-Loss 0.6670. Take-Profit 0.6600, 0.6585, 0.6505, 0.6410

Buy Stop 0.6670. Stop-Loss 0.6625. Take-Profit 0.6700, 0.6725, 0.6740, 0.6800, 0.6865, 0.6900

250918-_NU-_D.png


250918-_NU-_H4.png


*) For up-to-date and detailed analytics and news on the forex market visit Tifia Forex Broker website tifia.com
 
USD/JPY: the divergence of the monetary policy of the Fed and the Bank of Japan will intensify

26/09/2018

Current situation


"We do not plan to curtail mitigation until inflation reaches 2%", Bank of Japan head Haruhiko Kuroda said at a press conference on Tuesday, adding that "the possible side effects of mitigation will not prevent further softening of the policy if necessary".

The yen continues to weaken after Kuroda's speech, and the USD / JPY came close to 113.00 before publication (at 18:00 GMT) of the Fed decision on the rate.

It is expected that the rate will be increased by 0.25% to 2.25%, and this increase is already included in the price. Investors are waiting for a press conference and Powell's speech to understand the prospects for monetary policy for 2019.

Any hints Powell on the possibility of a more rapid increase in the interest rate will cause the strengthening of the dollar. Soft Powell rhetoric will bring down the dollar.

Nevertheless, the difference between the monetary policy of the Bank of Japan and the Fed remains the main fundamental factor for the further growth of the pair USD / JPY. Probably, the USD / JPY will keep positive dynamics and will continue to grow, despite the speech of Powell.

*)An advanced fundamental analysis is available on the Tifia Forex Broker website at tifia.com/analytics


Trading scenarios

Since the end of March, the USD / JPY has been growing, currently trading above the key support levels of 110.15 (Fibonacci level 38.2% of the correction of the pair's growth since August last year and the level of 99.90), 110.50 (EMA200 on the daily chart). Ascending dynamics prevails. Long positions are preferred. The nearest growth targets are 113.10 levels (Fibonacci level 50% and maximums of the year), 113.70 (December highs). Long-term growth targets are the level of resistance 116.00 (Fibonacci level 61.8%), 118.60 (highs in January 2017).

The signal for the decline will be the breakdown of short-term support levels of 112.83 (EMA200 on the 15-minute chart), 112.43 (EMA200 on the 1-hour chart).

The purpose of the downward correction is the support level of 111.68 (EMA200 on the 4-hour chart).

Support levels: 112.83, 112.43, 111.68, 111.00, 110.50, 110.15

Levels of resistance: 113.10, 113.70, 114.00, 114.40, 115.00, 116.00


Trading Scenarios


Buy Stop. Stop Loss 112.70. Take-Profit 113.70, 114.00, 114.40, 115.00, 116.00

Sell Stop 112.70. Stop Loss 113.20. Take-Profit 112.43, 112.00, 111.68, 111.40, 111.00, 110.50, 110.15

260918-_UJ-_D.png


260918-_UJ-_H4.png


260918-_UJ-_H1.png


*) For up-to-date and detailed analytics and news on the forex market visit Tifia Forex Broker website tifia.com
 
USD/CHF: Current dynamics_01/10/2018

Despite the decline against the Canadian dollar, the US dollar maintains a positive momentum in the foreign exchange market.

Futures on the dollar index DXY, which tracks the rate of the US currency against the basket of 6 other major currencies, is trading with a slight increase at the beginning of the European session, near the 94.77 mark.

This week, the attention of traders will be focused on the publication on Friday of data from the American labor market. According to the forecast, strong data is expected.

The average hourly wage of Americans increased by 0.3% in September, the number of new jobs created outside the agricultural sector increased by 188 00 (against +201 000 in August), the unemployment rate in September was 3.8% (against 3.9% in August). Forecasting the market reaction to the publication of indicators is often difficult. In any case, when these indicators are published, a surge in volatility is expected in the trades not only in USD, but throughout the financial market. Probably the most cautious investors will prefer to stay out of the market in this time period.

Nevertheless, if the data coincides with the forecast or will go better, then this will have a positive effect on the USD.

Last Wednesday, the Fed raised its benchmark interest rate by 0.25% to 2.25%, and Federal Reserve Chairman Powell confirmed the Fed's plans for another interest rate hike in 2018 and 3 rate increases in 2019.

The Fed, therefore, remains the world's single largest central bank, which is tightening monetary policy. And this, in the long run, should return to the dollar an upward trend.

At the meeting held in September, the Swiss National Bank kept its negative interest rates unchanged: the deposit rate was at -0.75%, the range for the 3-month LIBOR rate was between -1.25% and -0.25%. "The bank still considers it necessary to have a negative interest rate and is ready to intervene in the foreign exchange market, if the situation requires it",- the NBS said.

Frank still enjoys the status of a refugee currency, especially recently, amid a worsening trade conflict between the US and China.

Nevertheless, the increasing discrepancy in interest rates in the US and Switzerland will increase the investment attractiveness of the dollar against the franc, which will further increase USD / CHF.

*)An advanced fundamental analysis is available on the Tifia Forex Broker website at tifia.com/analytics


Support and resistance levels

The pair USD / CHF broke through last week an important resistance level of 0.9785 (EMA200 on the daily chart) and continues to grow on Monday. The upper limit of the downtrend channel, in which the USD / CHF was declining since the middle of August USD / CHF, is also broken.

Thus, there was a strong signal, indicating a further increase in USD / CHF.

The OsMA and Stochastic indicators on the 4-hour, daily, weekly charts turned to long positions, confirming the rising dynamics of USD / CHF.

Break into the zone above the resistance level 0.9875 (the Fibonacci level of 61.8% of the upward correction to the last global wave of decline since December 2016 and from the level of 1.0300) will create prerequisites for further growth. The targets in this case will be the resistance levels 1.0100, 1.0300.

The signal for sales will be a return to the zone below the support level 0.9770 (EMA50 on the daily chart). The goals of the decline are 0.9575, 0.9520, 0.9445 (the Fibonacci level is 23.6%).

Support levels: 0.9785, 0.9770, 0.9745, 0.9640, 0.9610, 0.9575, 0.9520, 0.9445

Resistance levels: 0.9875, 0.9965, 1.0030, 1.0060


Trading Scenarios


Buy Stop 0.9850. Stop-Loss 0.9790. Take-Profit 0.9875, 0.9965, 1.0030, 1.0060

Sell Stop 0.9790. Stop-Loss 0.9850. Take-Profit 0.9770, 0.9745, 0.9640, 0.9610, 0.9575, 0.9520, 0.9445


011018-_DXY.png


011018-_UCF-_W.png


011018-_UCF--_D.png


*) For up-to-date and detailed analytics and news on the forex market visit Tifia Forex Broker website tifia.com
 
EUR/USD: Euro remains under pressure. Trading recommendations

02/10/2018

Current situation


The euro remains under pressure due to problems in Italy. Last week, the Italian government presented a plan for the state budget, which investors fear may cause disapproval of the EU authorities. This time, the euro is falling after the comments of the head of the budget committee of the lower house of parliament, Claudio Borghi, that Italy “could solve most of the internal (economic) problems” with the help of its national currency.

The yield of government bonds in Italy jumped to the highest level in 4.5 years.

By the beginning of the US trading session, the EUR / USD pair was trading near the 1.1525 mark, which is 55 points lower than the opening price of the trading day.

Meanwhile, the US dollar continues to rise from the opening of today's trading day. The DXY dollar index, which tracks the US currency against a basket of 6 other major currencies, has been rising 4 days in a row after the Fed raised its main interest rate by 0.25% to 2.25% last week, and Fed Chairman Powell confirmed plans for another interest rate increase in 2018 and 3 interest rate increases in 2019. At the beginning of the European trading session, DXY futures traded with an increase of 28 points, near the mark of 95.24.

On Tuesday, investors will pay attention to Powell's speech, which will begin at 16:45 (GMT).

Most likely, the reaction to his speech will be minimal. But, if he makes unexpected statements about the monetary policy of the Fed, then volatility in trading in financial markets may increase. Any hint of Powell's for a cautious approach to raising the interest rate will cause the dollar to fall and the growth of US stock markets.

*)An advanced fundamental analysis is available on the Tifia Forex Broker website at tifia.com/analytics


Trading scenarios

During the 5-day decline, the EUR / USD pair reached a local support level of 1.1510 (May, June lows).

The trend line at the support level of 1.1645 (ЕМА200 on the 4-hour chart, ЕМА50 on the daily chart) is broken.

Indicators OsMA and Stochastic on the 4-hour and daily, weekly charts went to the side of the sellers. Negative dynamics persist. In this situation, short positions are preferred.

The farther target of the decline is at the support level of 1.1100 (lower limit of the downward channel on the weekly chart).

Consideration of long positions is possible only after returning EUR / USD to the zone above the resistance level of 1.1645.

Support Levels: 1.1535, 1.1510, 1.1400, 1.1345, 1.1285, 1.1100

Resistance Levels: 1.1645, 1.1700, 1.1725, 1.1760, 1.1790, 1.1815


Trading recommendations


Sell in the market. Stop Loss 1.1610. Take-Profit 1.1510, 1.1400, 1.1345, 1.1285, 1.1100

Buy Stop 1.1610. Stop-Loss 1.1490. Take-Profit 1.1645, 1.1700, 1.1725, 1.1760, 1.1790, 1.1815

021018-_EU-_W.png


021018-_EU-_D.png


021018-_EU-_H4.png


*) For up-to-date and detailed analytics and news on the forex market visit Tifia Forex Broker website tifia.com
 
GBP/USD: pressure on the pound has resumed

08/10/2018

Current Dynamics


The pound strengthened significantly at the end of last week, and the GBP / USD jumped 170 points in two days to 1.3112.

The growth of the pound contributed mainly by two news regarding Brexit. EU's main Brexit negotiator, Michelle Barnier, said the EU and Britain had reached the final stage of negotiations.

On Friday, Bloomberg reported that the European Union intends to offer the UK a very favorable free trade agreement. Brussels intends to propose an agreement that goes much further than any previous agreements. The EU proposal will provide for 30% -40% of what May requires from a large-scale transaction, which should cover aspects ranging from trade to security, the report says.

The pound was the only currency hardened against the dollar last week.

Other major dollar competitors have fallen against it. The data on the US labor market, received on Friday from the US Department of Commerce, strengthened investors' opinion that the Fed will continue to tighten monetary policy.

In September, unemployment in the United States fell to 3.7%, which increases inflation expectations, especially with regard to wage growth.

At a press conference in September, Fed Chairman Powell confirmed plans for another interest rate increase in 2018 and 3 rate increases in 2019. The Fed is currently the single largest global central bank tightening monetary policy, and this will be the main fundamental driver for the growth of the dollar.

The DXY dollar index, which tracks the US currency against a basket of 6 other major currencies, has been rising since the opening of today's trading day. DXY futures traded at the beginning of the European session near the level of 95.65, 43 points higher than the opening price of the trading day.

However, the Brexit theme remains central to the definition of further pound dynamics. In the case of a hard Brexit, the probability of which is still there, the Bank of England can go on reducing the rate to compensate for the damage. The long-term outlook for the British pound is still uncertain. In the short term, the resumption of the decline in GBP / USD is expected.

*)An advanced fundamental analysis is available on the Tifia Forex Broker website at tifia.com/analytics


Support and Resistance Levels

On Monday, GBP / USD attempts to break through the support level of 1.3038 (ЕМА50 on the daily chart, ЕМА200 on the 4-hour chart). In case of its breakdown, the upward GBP / USD correction will end. In this case, short positions are again preferred. A long-term bearish trend persists, and the GBP / USD pair may decline to August and annual lows near the support level of 1.2670, and the lower border of the downward channel on the weekly chart, which passing through the 1.2000 mark.

The alternative scenario assumes a resumption of the upward correction and growth to resistance levels of 1.3215 (Fibonacci level 23.6% of the correction to the decline of GBP / USD in a wave that began in July 2014 near the level of 1.7200), 1.3270 (ЕМА200 on the daily chart).

The signal for the development of this scenario will be the breakdown of the short-term resistance level of 1.3058 (ЕМА200 on the 15-minute chart).

Farther growth targets are resistance levels of 1.3870 (ЕМА200 on the weekly chart), 1.3980 (Fibonacci level 38.2%).

Support levels: 1.3038, 1.3000, 1.2900, 1.2800, 1.2670, 1.2590, 1.2365, 1.2110, 1.2000

Resistance Levels: 1.3058, 1.3125, 1.3215, 1.3270, 1.3300, 1.3420, 1.3620


Trading Scenarios


Sell Stop 1.2990. Stop Loss 1.3070. Take-Profit 1.2900, 1.2800, 1.2670, 1.2590, 1.2365, 1.2110, 1.2000

Buy Stop 1.3070. Stop Loss 1.2990. Take-Profit 1.3125, 1.3215, 1.3270, 1.3300, 1.3420, 1.3620


081018-_GU-_W.png


081018-_GU-_D.png


081018-_GU-_H4.png


*) For up-to-date and detailed analytics and news on the forex market visit Tifia Forex Broker website tifia.com
 
DJIA: US stock indexes are falling

09/10/2018

Current situation


Leading US indices since last week are under pressure against the backdrop of rising government bond yields to multi-year marks.

On Tuesday, the yield on 10-year US Treasury bonds reached 3.261%, the highest in 7.5 years.

The growth of profitability is worrying investors. Many of them believe that the US stock market still has room for growth due to good economic data and high levels of business and consumer confidence. However, against the background of further increases in interest rates, there will be more and more doubts about the prospects for further growth of the market.

Increasing bond yields reduce the attractiveness of riskier assets, including stocks, and may trigger a slowdown in economic growth.

Investors are also analyzing the development of the trade conflict between the United States and China.

If the White House will levy duties on all of China’s imports to the United States, markets and the economy will take it negatively.

Before the resolution of the trade conflict between these two largest economies in the world is still far away, investors are eager to understand how the customs duties they have introduced will affect the global economy.

European and Asian indices are also declining after the US. European Stoxx Europe 600 fell by 0.4%, the shares of automotive and chemical companies dropped the hardest.

The Japanese Nikkei Stock Average Index declined by 1.3%. Hong Kong's Hang Seng Index decreased 0.1%.

After the Dow Jones Industrial Average rose at the beginning of the month to a new record high of 26953.0, DJIA futures fell from the opening of the trading day on Tuesday, reaching 26390.0 by the beginning of the American session.

*)An advanced fundamental analysis is available on the Tifia Forex Broker website at tifia.com/analytics


Support and Resistance Levels

The DJIA so far maintains a long-term positive trend, trading in the ascending channels on the daily and weekly charts. Only the long positions should be considered above the support level of 26245.0 (ЕМА200 on the 4-hour chart).

Breakdown of this support level may provoke a deeper correctional decrease to key support levels of 25350.0 (ЕМА144 on the daily chart), 25000.0 (ЕМА200 on the daily chart). The bottom line of the ascending channel on the weekly chart also passes near these levels.

In general, positive dynamics remain, and long positions are preferable. Only a breakdown of the support level of 24200.0 (Fibonacci level 23.6% of the correction to growth from 15650.0 in the wave that began in January 2016. The maximum of this wave and the Fibonacci level 0% are close to 26620.0) can again threaten the bull trend.

Support Levels: 26245.0, 26000.0, 25750.0, 25350.0, 25000.0, 24930.0, 24200.0

Resistance Levels: 26560.0, 26840.0, 27000.0, 28000.0, 29000.0


Trading Scenarios


Buy Stop 26580.0. Stop Loss 26200.0. Take-Profit 26840.0, 27000.0, 28000.0, 29000.0

Sell Stop 26200.0. Stop Loss 26580.0. Take-Profit 26000.0, 25750.0, 25350.0, 25000.0

091018-_DJIA-_W.png


091018-_DJIA-_D.png


091018-_DJIA-_H4.png


*) For up-to-date and detailed analytics and news on the forex market visit Tifia Forex Broker website tifia.com
 
AUD/USD: Short positions are relevant.

11/10/2018

Current Dynamics


The US dollar is falling after stock indexes. The DXY dollar index, which tracks the US currency against a basket of 6 other major currencies, has been dropping on Thursday for the third day in a row. DXY futures traded at the beginning of the American session near the 94.74 mark, 40 points lower than the opening price of the trading day.

Nevertheless, the dollar, in general, maintains its position and upward trend against the background of good economic data and high levels of business and consumer confidence. His current decline should be considered so far as corrective.

The dollar also receives support from a $ 1.5 trillion tax cut in December. Investors expect growth this year to be a sustainable fiscal stimulus. Markets expect the Fed to raise interest rates again this year, as well as three times next year. Amid further increases in interest rates, the investment attractiveness of the dollar will grow.

However, on Thursday, the US dollar fell, including against the Australian dollar. "The Fed is making a mistake", Trump told reporters after the worst fall in stock markets in more than seven months. "I think the Fed has lost its head", he added.

Trump made this statement amid falling American stock market. According to Trump, the fall in the stock market is "a correction that we have been waiting for a long time. Nevertheless, I really disagree with the actions of the Fed", he said.

At the same time, the Australian dollar remains under pressure.

According to Lucy Ellis, senior economist at the Reserve Bank of Australia, monetary policy should remain soft to reduce unused production capacity. "Removing reserve capacity may take some time. In this regard, for several years, a stimulating monetary policy may be needed," Ellis added. RBA has kept its key interest rate at a record low of 1.5% for more than two years. Some economists expect the Central Bank to keep rates at such levels until 2020.

Thus, the different orientation of the monetary policies of the Fed and the RBA remains the main fundamental factor in favor of further reducing the pair AUD / USD. In the long run, the pair is likely to decline. The most pessimistic forecasts suggest a fall to the support level of 0.6300 (2009 lows).

*)An advanced fundamental analysis is available on the Tifia Forex Broker website at tifia.com/analytics


[b] Support and Resistance Levels [/b]

Despite the upward correction, negative dynamics persist and prevail.

Breakdown of the local support level of 0.7045 will resume the decline of AUD / USD with targets at the support levels of 0.6910 (lows of September 2015), 0.6830 (2016 lows).

AUD / USD is in a global downtrend that began in August 2011. Short positions are preferred.

Only if AUD / USD returns to the zone above the key resistance level of 0.7450 (ЕМА200 on the daily chart) can we consider long-term long positions with targets at 0.7820 (ЕМА200 on the weekly chart and Fibonacci level 23.6% of the correction to the decline wave of the pair since August 2011 years and the level of 1.1030. The minimum of this wave is near the level of 0.6830).

The signal for the development of this scenario will be the breakdown of the short-term resistance level of 0.7113 (ЕМА200 on the 1-hour chart).

Support Levels: 0.7075, 0.7045, 0.7025, 0.6910, 0.6830

Resistance Levels: 0.7100, 0.7113, 0.7150, 0.7200, 0.7235, 0.7300, 0.7400, 0.7450, 0.7700, 0.7820


Trading Scenarios


Sell in the market. Stop Loss 0.7140. Take-Profit 0.7045, 0.7025, 0.6910, 0.6830

Buy Stop 0.7140. Stop Loss 0.7070. Take-Profit 0.7200, 0.7235, 0.7300, 0.7400, 0.7450

111018-dxy.png


111018-_AU-_D.png


111018-_AU-_H1.png


*) For up-to-date and detailed analytics and news on the forex market visit Tifia Forex Broker website tifia.com
 
WTI: price maintains positive momentum

15/10/2018

Current Dynamics


After US President Donald Trump announced that “severe punitive measures” would be imposed against Riyadh, oil prices rose during the Asian session on Monday. At the heart of the conflict between the United States and Saudi Arabia are the charges of the murder of Saudi journalist and dissident Jamal Hashoggi. On Sunday, Saudi Arabia promised to respond if Washington imposes sanctions. The kingdom also noted that the largest exporter of oil "plays a significant and active role in the global economy". Mutual threats by the United States and Saudi Arabia increase concerns on the oil market, which contributes to the resumption of rising oil prices

At the end of last week, oil prices fell amid a collapse in the stock market, and also as a result of the revision of forecasts by OPEC and the International Energy Agency for Demand this year and next, downward.

At the beginning of the European trading session, WTI crude oil traded near the mark of 71.80 dollars per barrel. Positive dynamics of oil prices persists, despite the decline last week.

*)An advanced fundamental analysis is available on the Tifia Forex Broker website at tifia.com/analytics


Support and Resistance Levels

The price of WTI crude oil is in an uptrend, maintaining a long-term positive trend and trading in the ascending channels on the daily and weekly charts.

On Thursday, the price of oil found support at 70.70 (EMA50 on the daily chart). Having repulsed from this level, the price attempts to grow above the important support level of 71.55 (ЕМА200 on the 4-hour chart). The overall trend is still bullish. Immediate growth targets are located at resistance levels of 72.80 (May highs), 73.85 (July highs), 75.00, 76.80 (annual and multi-year highs).

In the case of the breakdown of the support level of 70.70, the targets will be the support levels of 68.60 (Fibonacci level 23.6% of the correction to the growth wave that started in June 2017 with the support level near the 42.00 mark), 68.10 (ЕМА144 on the daily chart), 66.35 (ЕМА200 on the daily). chart). While the price is above the key support level of 66.35, a long-term upward trend remains.

Support levels: 71.55, 70.70, 68.60, 68.10, 66.35

Resistance levels: 72.80, 73.85, 75.00, 76.80


Trading Scenarios


Sell Stop 70.20. Stop Loss 72.90. Take-Profit 68.60, 68.10, 66.35

Buy Stop 72.90. Stop Loss 70.20. Take-Profit 72.80, 73.85, 75.00, 76.80


151018-WTI-D.png


151018-WTI-H4.png


*) For up-to-date and detailed analytics and news on the forex market visit Tifia Forex Broker website tifia.com
 
XAU/USD: correction after a long period of decline

16/10/2018

Current Dynamics


Against the background of the continuing instability of stock markets, as well as weaker than expected macro data coming from the US, and the weakening dollar, investors are buying gold again. Last Monday, gold prices peaked from the end of July.

Gold futures on COMEX rose on Monday to $ 1233.00 per ounce.

A weaker dollar makes gold more attractive to holders of other currencies.

However, the current growth in gold prices should be considered as a correction after a long period of decline.

American stock indices in general are holding near record levels this year, and a strong dollar and high yield of treasury bonds have a negative impact on gold. After new strong financial reports and economic data, stock indexes and the dollar will start to grow again, and this will limit the potential for gold price growth.

Despite the recent increase in gold quotes, it is necessary to look for an opportunity to enter short positions in the XAU / USD pair.

The general trend of XAU / USD is still bearish. In the face of rising interest rates, the investment attractiveness of the dollar is rising, and of gold - is falling.

*)An advanced fundamental analysis is available on the Tifia Forex Broker website at tifia.com/analytics


Support and Resistance Levels

From mid-April, XAU / USD has been trading in a downward channel on a weekly chart, the lower limit of which is near the support level of 1050.00 (2015 lows).

Below the key resistance level of 1248.00 (EMA200 on the daily chart and the Fibonacci level of 50% of the correction to the wave of decline since July 2016), the downward trend prevails.

The breakdown of the support level of 1220.00 (Fibonacci level 38.2%) confirms the return of XAU / USD to the global downtrend, which began in October 2012, and into the downward channel on the daily chart.

Correctional growth may still continue to resistance levels of 1239.00 (EMA144 on the daily chart), 1248.00.

However, in the long run, short positions are preferred below these levels.

Levels of support: 1220.00, 1208.00, 1204.00, 1185.00, 1171.00, 1160.00, 1128.00, 1085.00, 1050.00

Resistance Levels: 1239.00, 1248.00, 1265.00, 1277.00


Trading Scenarios


Sell Stop 1224.00. Stop Loss 1234.00. Take-Profit 1220.00, 1208.00, 1204.00, 1185.00, 1171.00, 1160.00, 1128.00, 1085.00, 1050.00

Buy Stop 1234.00. Stop Loss 1224.00. Take-Profit 1239.00, 1248.00, 1265.00, 1277.00


161018-XU-D.png


161018-XU-H4.png


*) For up-to-date and detailed analytics and news on the forex market visit Tifia Forex Broker website tifia.com
 
Back
Top