Tifia Forex Broker Daily Market Analytics, Analytics and trading recommendations by Tifia Company

USD: Fed and EU Brexit Summit

10/18/2018

Current Dynamics


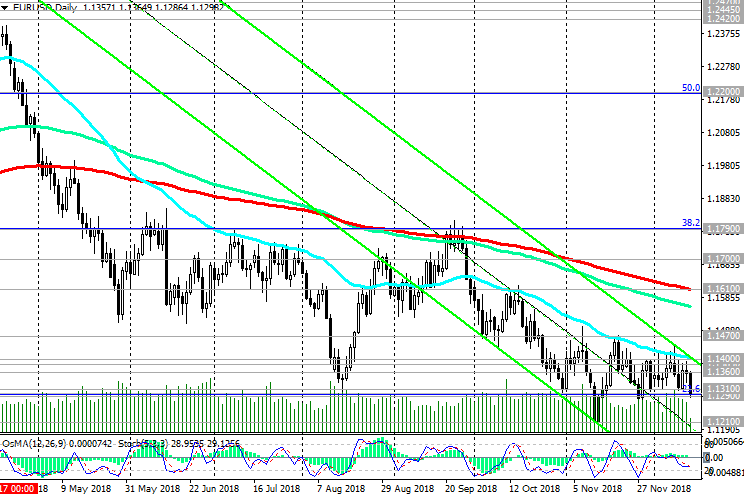
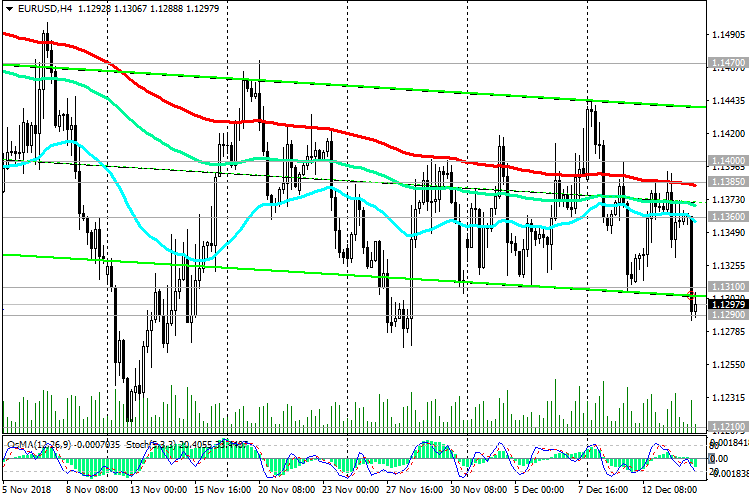
The US dollar strengthened significantly on Wednesday against the background of uncertainties on Brexit, and after the publication of the minutes from the September Fed meeting.

According to protocols published on Wednesday, the US central bank is going to continue to raise interest rates until the economy slows down. Despite the fact that “two participants (FOMC) noted that they will not support the introduction of a restraining policy in the absence of obvious signs of overheating of the economy and inflation”, in general, the Fed leaders are inclined to believe that the rates are low enough to stimulate lending, investment and expenses that support economic growth.

In the minutes of the September meeting, published Wednesday, the Fed signaled the possibility of another rate increase in 2018 and three increases in 2019. According to the leaders of the Fed, raising rates will prevent overheating of the economy and keep inflation at a target level of 2%. Higher interest rates usually increase the demand for national currency.

Investors also prefer the dollar during the period of trade instability, as this currency gets support due to faster economic growth than in other countries. US economic growth is now higher than a couple of years ago.

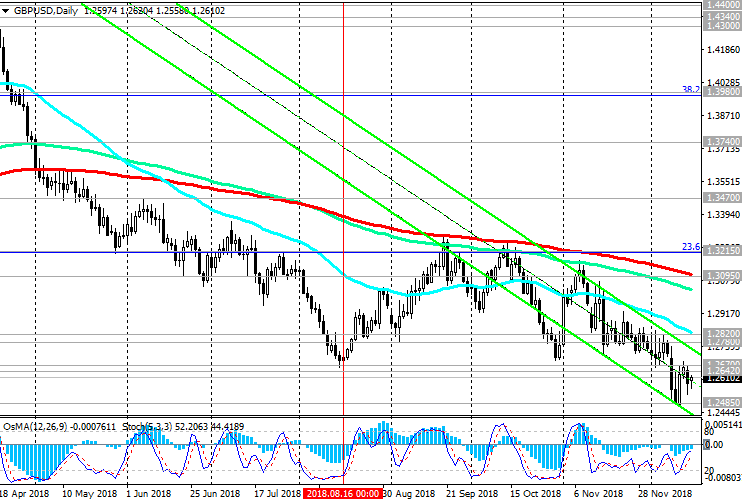
At the same time, representatives of the UK and the EU, according to press reports, find it difficult to come to a consensus to make progress in the Brexit talks, and this raises doubts that the parties will be able to reach an agreement at all. The EU is ready to extend by one year the transition period for the UK to break the deadlock. The achievement of a trade agreement remains questionable, and the parties argue that they are stepping up preparations for the case of a British exit from the EU without an agreement.

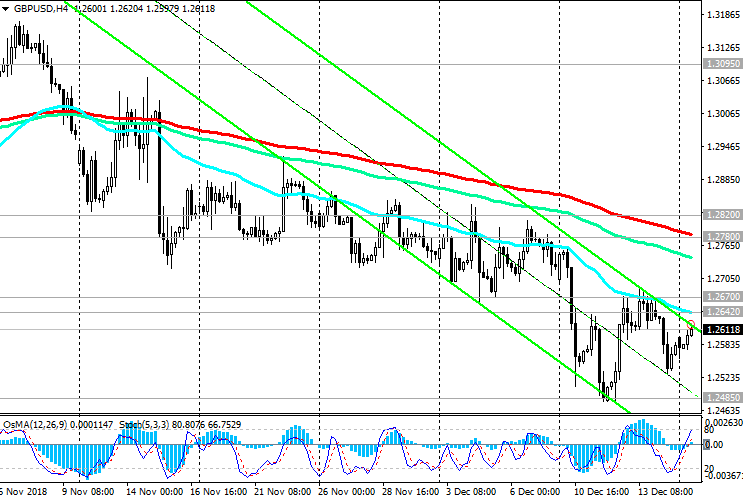
Against this background, the pound remains under pressure. A spokesman for the Bank of England, Canliff, said on Wednesday that “the British pound may experience a "strong fall" in the event of a "bad Brexit".

As a result, the growth of the US dollar on Wednesday was the strongest in the last two weeks.

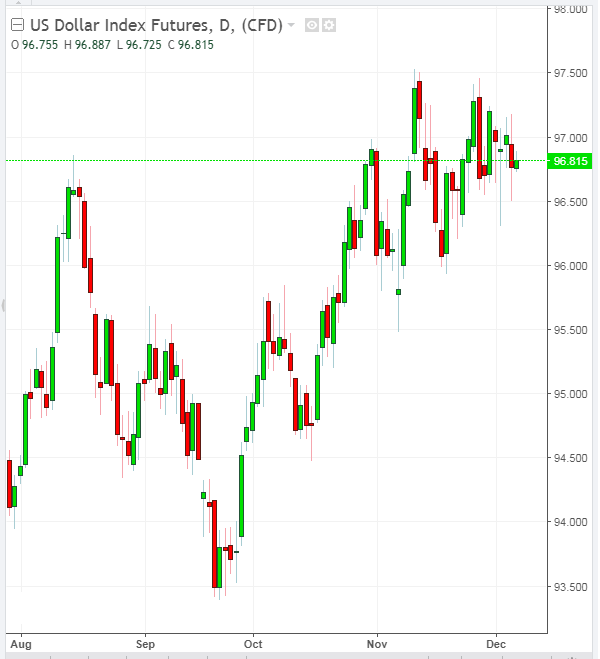
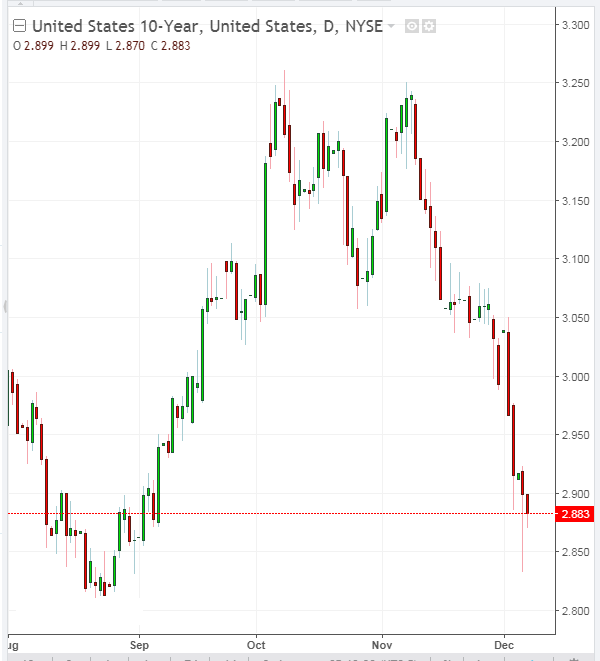
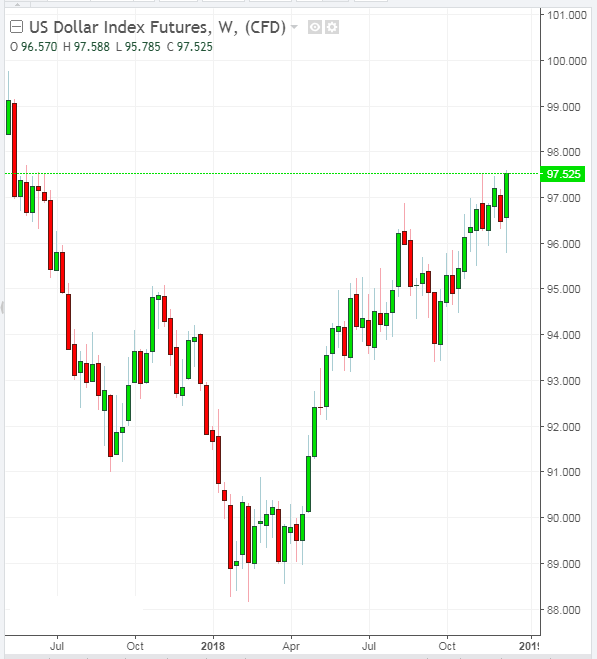
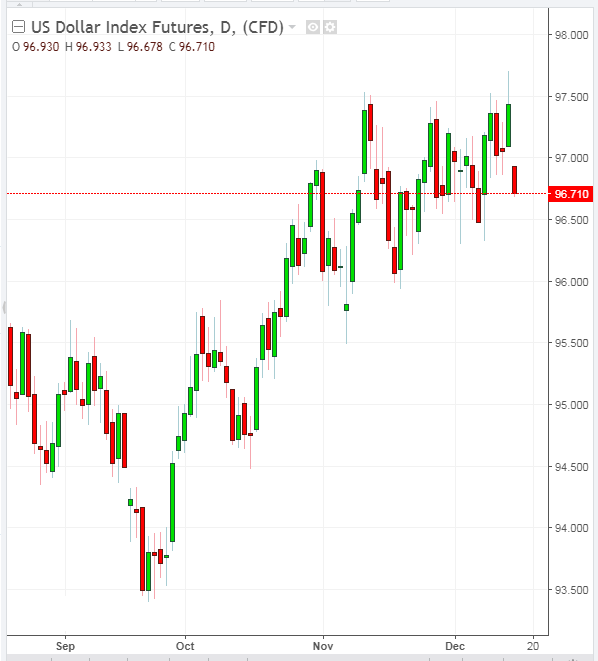
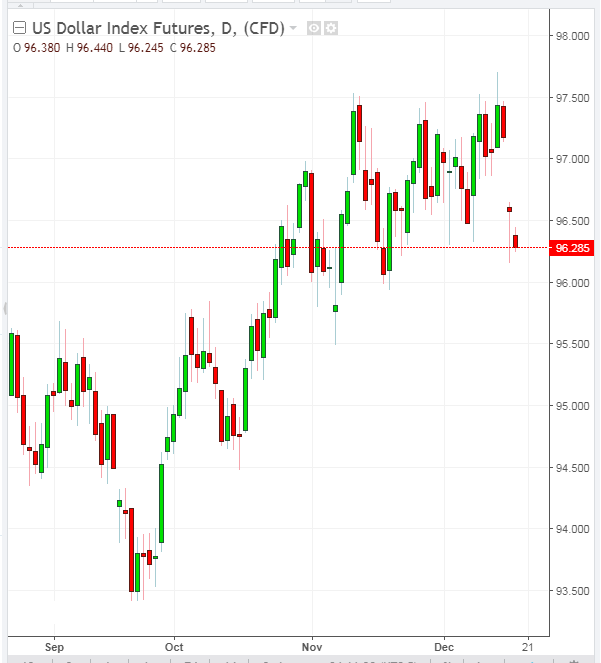
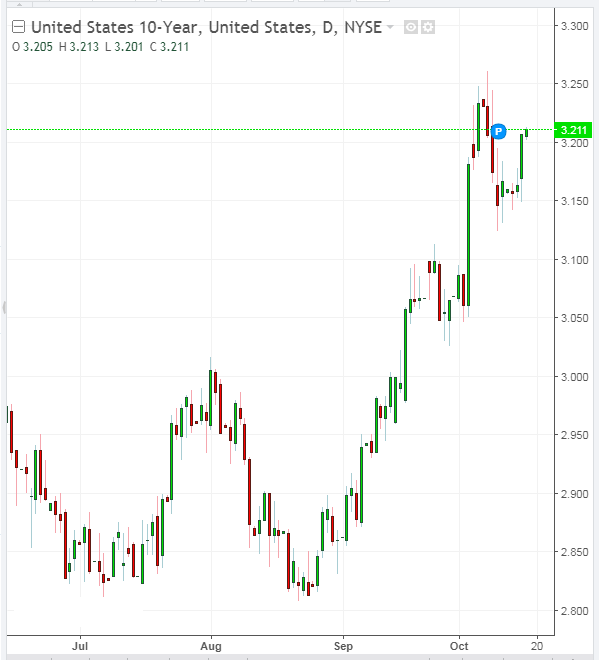
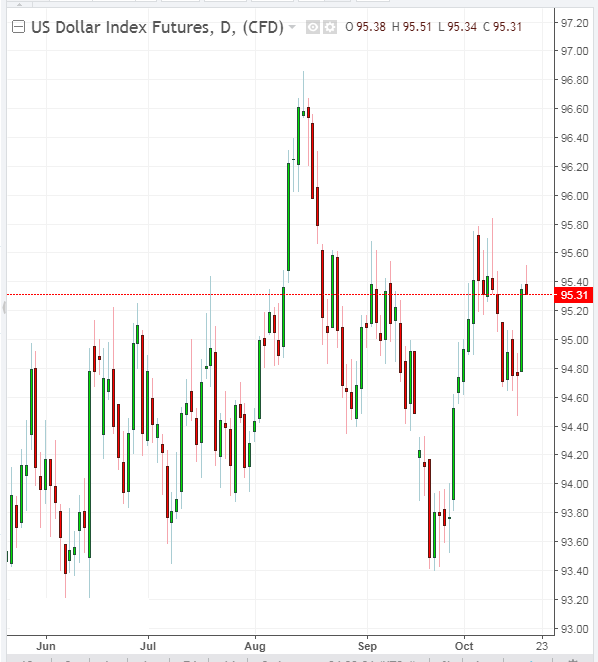
The DXY dollar index, which tracks the US currency against a basket of 6 other major currencies, rose 57 points to 95.35 on Wednesday. The yield on 10-year US Treasury bonds on Thursday is kept in the area of maximum marks (3.203%) after last week it reached 3.261%, the highest mark in 7.5 years. It also helps to strengthen the dollar.


181018-10-Y.png


181018-DXY.png


*) For up-to-date and detailed analytics and news on the forex market visit Tifia Forex Broker website tifia.com
 
WTI: Current dynamics

10/19/2018


On Friday, the price of WTI crude oil reached an important support level of 68.60 (Fibonacci level 23.6% of the correction to the growth wave that started in June 2017 from the level of support near the 42.00 mark), after which an upward correction began. Just below is another strong support level of 68.10 (EMA144 on the daily chart).

As long as the price is above the key support level of 66.40 (ЕМА200 on the daily chart and the bottom line of the ascending channel on the weekly chart), the long-term uptrend remains.

If the price returns to the zone above the resistance level of 70.70, long positions will again become relevant.

The overall trend is still bullish. The growth targets in the event of a resumption of positive dynamics are located at the resistance levels of 73.85 (July highs), 75.00, 76.80 (annual and multi-year highs).

We are awaiting publication (at 17:00 GMT) of the weekly report of the American oilfield service company Baker Hughes on the number of active oil drilling rigs in the USA. If the report indicates a further increase in the number of drilling rigs (at the moment their number is 869 units), this will have an additional negative impact on oil quotations.

Support Levels: 68.60, 68.10, 66.40

Resistance Levels: 70.70, 71.50, 72.00, 72.80, 73.85, 75.00, 76.80


Trading Scenarios


Sell Stop 68.50. Stop Loss 69.80. Take-Profit 68.10, 66.40

Buy Stop 69.80. Stop Loss 68.50. Take-Profit 70.70, 71.50, 72.00, 72.80, 73.85, 75.00, 76.80

191018-wti-w.png


191018-wti-d.png


*) For up-to-date and detailed analytics and news on the forex market visit Tifia Forex Broker website tifia.com
 
XAU/USD: Market expectations

12/07/2018


Against the background of monetary tightening by the Fed since April, gold prices have been in a steady downward trend. In mid-August, the XAU / USD pair reached an annual minimum near the mark of 1160.00, however, then an upward correction began, raising the price of gold to the mark of 1244.00 dollars per troy ounce. Nevertheless, the overall gold trend remains bearish, and the upward correction may end near the reached resistance levels of 1242.00 (ЕМА200 on the daily chart), 1248.00 (Fibonacci level 50% of the correction to the decline wave from July 2016), if the Fed will give clear signals to further tighten its monetary policy.

The breakdown of the support level of 1233.00 (EMA144 on the daily chart) will be the beginning of the return of XAU / USD to the bearish trend.

The soft rhetoric of statements by Fed officials could provoke a breakdown of the achieved resistance levels and a further growth of the XAU / USD towards resistance levels of 1260.00 (ЕМА200 on the weekly chart and the upper limit of the upward channel on the daily chart), 1277.00 (Fibonacci level 61.8%).

We remind you that the publication of key data for the Fed from the US labor market is scheduled for 13:30 (GMT). Predicting the market response to the publication of indicators is often difficult. In any case, when these indicators are published, a surge in volatility is expected in trading not only for USD, but also for the entire financial market. Probably the most cautious investors would prefer to stay out of the market during this time period.

Support Levels: 1233.00, 1220.00, 1212.00, 1204.00, 1198.00, 1185.00, 1160.00

Resistance Levels: 1242.00, 1248.00, 1260.00, 1277.00

*)An advanced fundamental analysis is available on the Tifia Forex Broker website at tifia.com/analytics


Trading scenarios


Sell Stop 1232.00. Stop Loss 1245.00. Take-Profit 1220.00, 1212.00, 1204.00, 1198.00, 1185.00, 1160.00

Buy Stop 1245.00. Stop Loss 1232.00. Take-Profit 1248.00, 1260.00, 1277.00

071218-dxy.png


071218-10-Y.png


071218-XU-W.png


071218-XU-D.png


*) For up-to-date and detailed analytics and news on the forex market visit Tifia Forex Broker website tifia.com
 
USD/CHF: on the eve of the meeting of the National Bank of Switzerland

Current dynamics

12/12/2018


On Thursday, a regular meeting of the Swiss National Bank will be held on monetary policy issues. The decision on rates will be published at 08:30 (GMT).

Earlier in late September, the National Bank of Switzerland kept its negative interest rates unchanged: the deposit rate was at the level of -0.75%, the range for the 3-month LIBOR rate was between -1.25% and -0.25%. “The bank still considers a negative interest rate necessary and is ready to intervene in the foreign exchange market if the situation requires it”, the NBS said. According to the management of the NBS, the cost of the Swiss franc is still high. It is likely that rates will remain unchanged for much of the next year, while weaker economic data has come from Switzerland. Thus, GDP in the 3rd quarter decreased by -0.2% instead of the expected growth of + 0.4% and against growth of + 0.7% in the 2nd quarter. Other macro data also indicate a slowdown in the economy.

At 09:00 (GMT) the press conference of the NBS will start. The harsh rhetoric of the speech by the head of the NBS Thomas Jordan, will help strengthen the franc. The soft tone of the speech and the tendency to continue the extra soft monetary policy of the NBS will negatively affect the franc.

*)An advanced fundamental analysis is available on the Tifia Forex Broker website at tifia.com/analytics


Support and Resistance Levels

The USD / CHF pair is trading at the beginning of the American session on Wednesday, near the strong short-term resistance level of 0.9960 (ЕМА200 on the 4-hour chart). Breakdown of this level will strengthen the upward trend prevailing above key support levels of 0.9875 (Fibonacci level 61.8% of the upward correction to the last global decline wave from December 2016 and from 1.0300), 0.9860 (ЕМА200 on the daily chart).

As long as USD / CHF is above these key support levels, a long-term uptrend persists and long positions are preferred.

An alternative decline scenario may develop after the breakdown of the support level of 0.9860 with the immediate goal at the support level of 0.9745 (ЕМА200 on the weekly chart and the Fibonacci level of 50%).

Support levels: 0.9935, 0.9915, 0.9875, 0.9860, 0.9745

Resistance Levels: 0.9960, 1.0010, 1.0060, 1.0110


Trading Scenarios


Buy Stop 0.9970. Stop Loss 0.9930. Take-Profit 1.0010, 1.0060, 1.0110

Sell Stop 0.9930. Stop Loss 0.9970. Take-Profit 0.9915, 0.9875, 0.9860, 0.9745, 0.9610, 0.9575

121218-CHF-D.png


121218-CHF-H4.png


*) For up-to-date and detailed analytics and news on the forex market visit Tifia Forex Broker website tifia.com
 
EUR/USD: Market Expectations

12/13/2018


On Thursday, the focus of attention of participants in the financial market will be the ECB meeting. The bank is expected to leave rates at current levels at least until the end of the summer of 2019. It is also likely that the ECB will confirm the completion of the asset purchase program at the end of December.

The ECB rate decision will be published at 12:45 (GMT), and the ECB press conference will begin at 13:30. If Mario Draghi makes unexpected announcements, then the volatility in euro trading and the financial market will increase significantly. The harsh rhetoric of Mario Draghi on monetary policy prospects will strengthen the euro. Conversely, the soft tone of the ECB statement and the speech of Mario Draghi will have a downward pressure on the euro.

Meanwhile, the euro will remain under pressure against the dollar, which is supported by demand from investors amid expectations of further tightening of the Fed's monetary policy.

While EUR / USD is trading below the key resistance level of 1.1610 (ЕМА200 on the daily chart), short positions are preferable. The likelihood of further decline in EUR / USD remains. After the breakdown of the support level of 1.1362 (EMA200 on the 1-hour chart) EUR / USD will go to support levels of 1.1310 (December lows), 1.1290 (Fibonacci level of the 23.6% of the correction to the fall from the level of 1.3900, which began in May 2014), 1.1210 (November and year lows).

After EUR / USD rises to the zone above the resistance level of 1.1410 (ЕМА50 on the daily chart), further corrective growth is possible to the resistance level of 1.1610.

*)An advanced fundamental analysis is available on the Tifia Forex Broker website at tifia.com/analytics


Support Levels: 1.1362, 1.1310, 1.1290, 1.1210, 1.1000

Resistance Levels: 1.1385, 1.1410, 1.1470, 1.1610, 1.1700, 1.1790


Trading recommendations


Sell Stop 1.1350. Stop-Loss 1.1420. Take-Profit 1.1310, 1.1290, 1.1210, 1.1000

Buy Stop 1.1420. Stop-Loss 1.1350. Take-Profit 1.1470, 1.1610, 1.1700, 1.1790

131218-EU-W.png


131218-EU-D.png


131218-EU-H4.png


*) For up-to-date and detailed analytics and news on the forex market visit Tifia Forex Broker website tifia.com
 
EUR/USD: Eurodollar remains under pressure

Current dynamics

14/12/2018


The Eurodollar remains under pressure after the ECB meeting on Thursday.

His head, Mario Draghi, pointed to the risks of the Eurozone economy, which are shifting towards the deterioration of the situation. The ECB confirmed that it will complete the QE program in December. Interest rates will remain unchanged until the summer of 2019.

The euro remains under pressure from the worsening domestic political situation in France, the reluctance of the Italian government to more strongly curtail the planned budget deficit, as required by the European Commission, as well as Brexit and uncertainty due to the forthcoming elections to the European Parliament in May.

On Friday, the decline of the EUR / USD pair continued after the publication of disappointing macro data from the Eurozone. The EUR / USD pair fell from the opening of the trading day by 0.6% and at the beginning of the American session is trading near the 1.1286 mark, trying to break through the important support level of 1.1290 (Fibonacci level 23.6% of the correction to the fall from the level of 1.3900, which began in May 2014) .

Below the key resistance level of 1.1610 (ЕМА200 on the daily chart) negative dynamics prevail. Short positions with targets at support levels of 1.1210 (November and year lows), 1.1000 (bottom line of the downward channel on the daily chart) are still preferred.

The signal for the resumption of long positions will be the breakdown of the resistance level of 1.1400 (ЕМА50 and the upper line of the downward channel on the daily chart) with the target at the resistance level of 1.1610.


Support Levels: 1.1290, 1.1210, 1.1000

Resistance Levels: 1.1310, 1.1360, 1.1385, 1.1400, 1.1470, 1.1610, 1.1700, 1.1790


Trading recommendations


Sell in the market. Stop-Loss 1.1410. Take-Profit 1.1210, 1.1000

Buy Stop 1.1410. Stop Loss 1.1280. Take-Profit 1.1470, 1.1610, 1.1700, 1.1790

armDWma.png


bJ581Ty.png


nYTOd1L.png
 
GBP/USD: Support and Resistance Levels

17/12/2018


After another sharp fall in mid-April since early May, GBP / USD continues to trade in a downward channel on a weekly chart, the lower limit of which passes near the support level of 1.1700. In the event of a breakdown of the nearest support level of 1.2600 (lows of June 2017), GBP / USD will head towards the support level of 1.2485 (minimums of the year). The main trend is still bearish. Below the key resistance levels of 1.3215 (Fibonacci level 23.6% of the correction to the decline of the GBP / USD pair in a wave that began in July 2014 near the level of 1.7200), 1.3095 (ЕМА200 on the daily chart) negative dynamics prevail. Short positions are preferred.

The signal for growth will be the breakdown of the short-term resistance level of 1.2642 (ЕМА200 on the 1-hour chart, ЕМА50 on the 4-hour chart). The immediate goal of growth is resistance levels of 1.2780 (ЕМА200 on the 4-hour chart), 1.2820 (ЕМА50 on the daily chart).

With favorable developments, corrective growth of GBP / USD may continue to resistance levels 1.3095 (ЕМА200 on the daily chart), 1.3215.

*)An advanced fundamental analysis is available on the Tifia Forex Broker website at tifia.com/analytics


Support Levels: 1.2600, 1.2500, 1.2485, 1.2365, 1.2110, 1.2000

Resistance Levels: 1.2670, 1.2700, 1.2780, 1.2820, 1.2900, 1.3000, 1.3095, 1.3215


Trading Scenarios


Sell in the market. Stop Loss 1.2650. Take-Profit 1.2500, 1.2485, 1.2365, 1.2110, 1.2000

Buy Stop 1.2680. Stop Loss 1.2580. Take-Profit 1.2700, 1.2780, 1.2820, 1.2900, 1.3000, 1.3095, 1.3215

171218-dxy.png


171218-GU-D.png


171218-GU-H4.png


*) For up-to-date and detailed analytics and news on the forex market visit Tifia Forex Broker website tifia.com
 
XAU/USD: Market expectations

18/12/2018


Against the background of monetary tightening by the Fed since April, gold prices have been in a steady downward trend. In mid-August, the XAU / USD pair reached an annual minimum near the mark of 1160.00, however, then an upward correction began, raising gold prices to the current mark of 1249.00 dollars per troy ounce. Nevertheless, the overall gold trend remains bearish, and the upward correction may end near the reached resistance levels of 1242.00 (ЕМА200 on the daily chart), 1248.00 (Fibonacci level 50% of the correction to the decline wave from July 2016), if the Fed will give clear signals to further tighten its monetary policy in 2019.

About 70% of market participants, according to the CME Group, believe that the rate will be increased in 2019 at least 2 more times. At the same time, the rate increase on December 19, at the last Fed meeting this year, by 0.25% to 2.5% is not in doubt.

The press conference of the Fed will begin on Wednesday 19:30 (GMT). Unambiguous signals from US Federal Reserve Chairman Jerome Powell, indicating a propensity to continue tightening monetary policy, will cause a rise in the dollar and a drop in gold prices. In the face of an increase in interest rates, gold is difficult to compete with other income-generating assets, such as government bonds, for example. At the same time, the cost of acquiring and storing gold is growing.

The breakdown of the support level of 1235.00 (EMA144 on the daily chart) will be the beginning of the return of XAU / USD to the bearish trend.

The soft rhetoric of statements by Fed officials could contribute to weakening the dollar and further rising gold and XAU / USD quotes towards resistance levels of 1260.00 (EMA200 on the weekly chart), 1277.00 (Fibonacci level 61.8%).

*)An advanced fundamental analysis is available on the Tifia Forex Broker website at tifia.com/analytics


Support Levels: 1242.00, 1235.00, 1220.00, 1212.00, 1204.00, 1197.00, 1185.00, 1160.00

Resistance Levels: 1248.00, 1260.00, 1277.00


Trading scenarios


Sell Stop 1234.00. Stop Loss 1250.00. Take-Profit 1220.00, 1212.00, 1204.00, 1197.00, 1185.00, 1160.00

Buy Stop 1250.00. Stop Loss 1234.00. Take-Profit 1260.00, 1277.00

181218-XU-D.png


181218-XU-W.png


*) For up-to-date and detailed analytics and news on the forex market visit Tifia Forex Broker website tifia.com
 
EUR/USD: on the eve of the publication of the Fed rate decision

12/19/2018


It is widely expected that the Fed will raise the key interest rate by 0.25% to 2.5%. The probability of this is 72%, according to the CME FedWatch Tool. The decision of the Fed on the rate will be published at 19:00 (GMT). In November, Fed Chairman Jerome Powell said that the stakes are "slightly below" the neutral level, at which they neither restrain nor accelerate economic growth. It is likely that the accompanying Fed statement will state that in the future rates will increase depending on economic data.

The Fed’s press conference will begin at 19:30 (GMT), and investors will closely monitor Powell’s performance to catch signals from him regarding the Fed’s future plans.

If he talks about the pause in the boost cycle in 2019, the dollar will fall under sales.

US President Donald Trump does not cease to criticize the Fed for its monetary policy.

If Powell confirms the inclination of the Fed to tighten its policy next year, then the dollar will receive a positive impetus for further growth. The discrepancy in the monetary policy of the Federal Reserve System and the European Central Bank in 2019 will increase. Even if EUR / USD rises in the near future against the backdrop of a restrained Fed statement, in the medium term and probably in the long term, the Eurodollar will decline.

*)An advanced fundamental analysis is available on the Tifia Forex Broker website at tifia.com/analytics


Currently, EUR / USD is trading near a strong resistance level of 1.1400 (EMA50 on the daily chart). Below the key resistance level of 1.1595 (ЕМА200 on the daily chart), negative dynamics prevail. The signal for the resumption of the decline will be the breakdown of the short-term support level of 1.1355 (ЕМА200 on the 1-hour chart), and the targets for the decline will be the support levels of 1.1290 (Fibonacci level 23.6% of the correction to the fall from the level of 1.3900, which began in May 2014), 1.1270 (minimums December), 1.1210 (November and year lows), 1.1000 (bottom line of the downward channel on the daily chart).

In the alternative scenario and in case of breakdown of the local resistance level of 1.1470, corrective growth will be possible to the resistance level of 1.1595.

Support Levels: 1.1376, 1.1355, 1.1310, 1.1290, 1.1210, 1.1000

Resistance Levels: 1.1400, 1.1470, 1.1595, 1.1700, 1.1790


Trading scenarios


Sell Stop 1.1370. Stop-Loss 1.1420. Take-Profit 1.1355, 1.1310, 1.1290, 1.1210, 1.1000

Buy Stop 1.1420. Stop-Loss 1.1370. Take-Profit 1.1470, 1.1600, 1.1700, 1.1790

191218-dxy.png


191218-EU-D.png


191218-EU-H4.png


*) For up-to-date and detailed analytics and news on the forex market visit Tifia Forex Broker website tifia.com
 
EUR/USD: has the Eurodollar growth stopped?

12/21/2018

Current situation


Stocks and the dollar continued to fall on Thursday after the Fed raised interest rates on Wednesday. The Fed leaders unanimously decided to raise the key rate to a range of 2.25% -2.5%. However, the central bank announced a possible slowdown in monetary tightening next year.

At a press conference, Fed Chairman Jerome Powell said that, according to central bank executives, next year the economy will be strong enough that rates could be raised twice. Earlier, the Fed planned 3 rate increases in 2019 and 2 more increases in 2020.

The US dollar declined significantly this week. On Thursday, the DXY dollar index, which tracks the US currency against a basket of 6 other major currencies, fell to an 8-week low, dropping to 95.73. At the beginning of the European session on Friday, futures for the DXY index traded higher (near the mark of 96.06), however, the pressure on the dollar persists.

US Treasury Secretary Stephen Mnuchin tried to reassure investors, saying that the reaction of markets to the results of the last Fed meeting was excessive. "I think we are clearly in a situation in which the market over-responded to the statements of the Fed", said Mnuchin. According to him, the central bank may not have to raise rates at all next year if inflation remains low.

However, investors' pessimism persists. The Fed continues to reduce its balance sheet and raise interest rates, but tensions remain in US political and trade relations with China.

Sales in stock markets led to a sharp strengthening of the yen and the euro, which are the funding currencies.

The Eurodollar strengthened since the beginning of the week, reaching a local maximum of 1.1485 on Thursday. However, on Friday the EUR / USD pair is falling. Investors take profits at the end of the week and close their positions ahead of the long weekend due to the celebration of Catholic Christmas early next week.

From the news today, attention should be paid to the publication (at 13:30 GMT) of a whole block of important macro data from the United States, including GDP data (final release), which are one of the key (along with labor market and inflation data) for the Fed in terms of its monetary policy. The forecast for the 3rd quarter of this year is +3.5% GDP growth. Despite the relative decline (in the previous quarter, GDP growth was + 4.2%), this is a strong indicator. If the data turns out to be worse than the forecast, the dollar and stock indices will react with a decrease.

It was the last full trading week this year. On Monday, markets in many countries will be closed. In full, trading will be restored only on Wednesday, and next Monday the world will celebrate the New Year.

*)An advanced fundamental analysis is available on the Tifia Forex Broker website at tifia.com/analytics


Support and Resistance Levels

EUR / USD rose sharply this week, despite the Fed raising interest rates. Sales in stock markets led to an increase in demand for the yen and the euro, as for funding currencies. On Thursday, the EUR / USD pair reached a 5-week high near the 1.1485 mark. However, growth expected by many investors to the first strong resistance level of 1.1545 (ЕМА144 on the daily chart) did not take place, and on Friday EUR / USD is falling. A decline below the support level of 1.1400 (EMA50 on the daily chart) and inside the downward channel on the daily chart will indicate return of EUR / USD to the global bearish trend, and a breakdown of the short-term support level of 1.1384 (EMA200 on the 1-hour and 4-hour charts) will be a signal for opening short positions. The targets for further decline are support levels of 1.1290 (Fibonacci 23.6% correction to a fall from 1.3900, which began in May 2014), 1.1270 (December lows), 1.1210 (November and year lows), 1.1000 (bottom line of the downward channel on the day chart).

In the case of the resumption of growth and breakdown of the local resistance level of 1.1485, corrective growth will be possible to the resistance level of 1.1595 (ЕМА200 on the daily chart). Below this key resistance level of 1.1595 negative dynamics prevails.

Support Levels: 1.1400, 1.1384, 1.1310, 1.1290, 1.1270, 1.1210, 1.1000

Resistance Levels: 1.1470, 1.1485, 1.1545, 1.1595, 1.1700, 1.1790


Trading Scenarios


Sell in the market. Stop-Loss 1.1490. Take-Profit 1. 1.1400, 1.1384, 1.1310, 1.1290, 1.1270, 1.1210, 1.1000

Buy Stop 1.1490. Stop-Loss 1.1390. Take-Profit 1.1545, 1.1600, 1.1700, 1.1790

211218-EU-D.png


211218-EU-H1.png


*) For up-to-date and detailed analytics and news on the forex market visit Tifia Forex Broker website tifia.com
 
Back
Top