Tifia FX
TifiaFx Representative
- Messages
- 30
GBP/USD: Dollar lacks positive momentum
05/02/2019
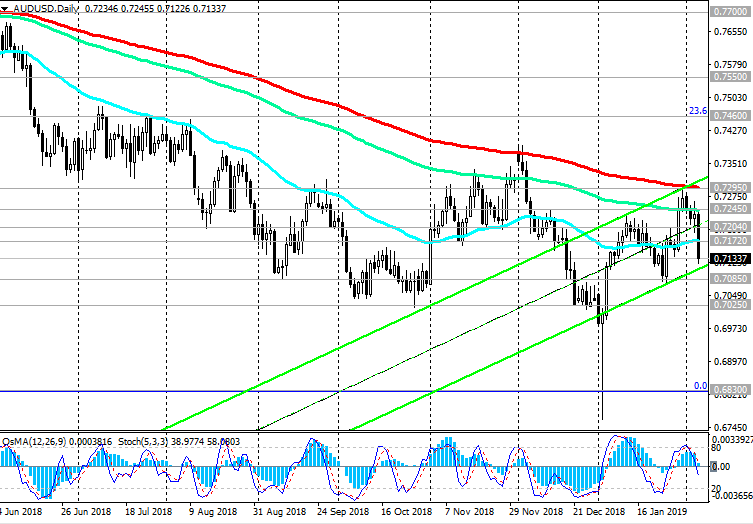
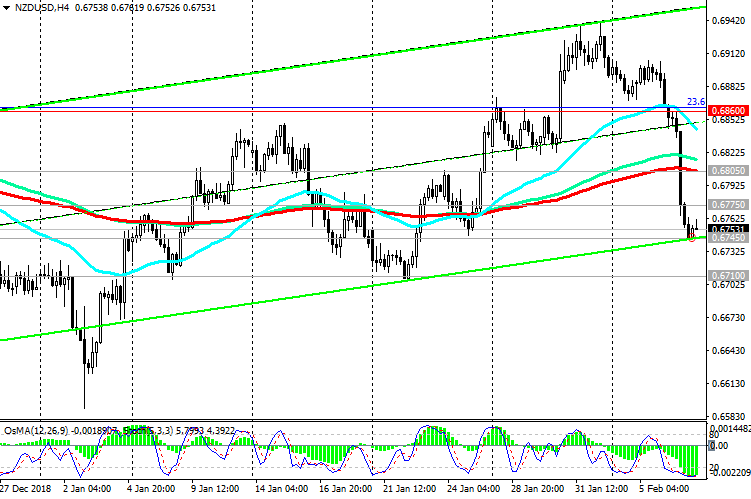
After, on Tuesday morning, the RB of Australia expectedly kept the interest rate unchanged, the volatility of trading on the foreign exchange market at the beginning of the European session decreased significantly. Major dollar currency pairs, with the exception of AUD / USD, are traded on Tuesday in a narrow range. The US dollar and the market as a whole do not have enough drivers for further movement.
Probably, such a driver will be the publication in the first half of the US trading session (15:00 GMT) of the report of the Institute for Supply Management (ISM) on activity in the non-manufacturing sector of the United States. Economists expect the non-production composite index from the Institute for Supply Management (ISM) in January to fall to 57.1 from 58.0 in December. Although an index value above 50 indicates an increase in activity, a relative decline in the indicator may have a short-term negative impact on the dollar.
Market participants will also closely monitor the performance of the US President Donald Trump in Congress later on Tuesday with an annual message on the state of the country. Any signals from Trump about a positive change in the sides' positions in the negotiations between the US and China will support the dollar, which needs a strong positive impetus for further growth after the Fed meeting last week. As you know, on Wednesday the Fed kept its current monetary policy unchanged and signaled its intentions to be more restrained in regard to further rate increases. Fed Chairman Jerome Powell said at a press conference that "there was a little less reason to raise rates".
According to the central bank executives, the current level of inflationary pressure does not force the Fed to take any action.
Many investors do not expect further increases in the Federal Reserve rates this year. Moreover, futures on the Fed rates on Monday indicated an 11% chance of lowering the Fed rates by the end of the year. Last week, this probability was 21%, according to the CME Group.
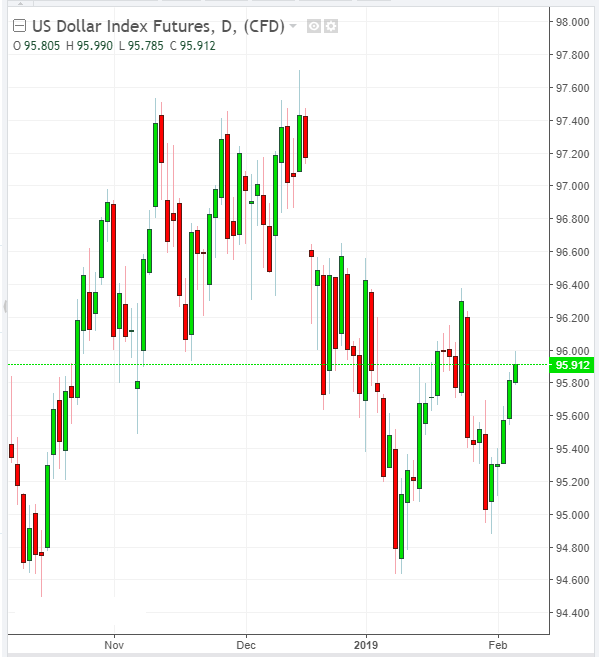
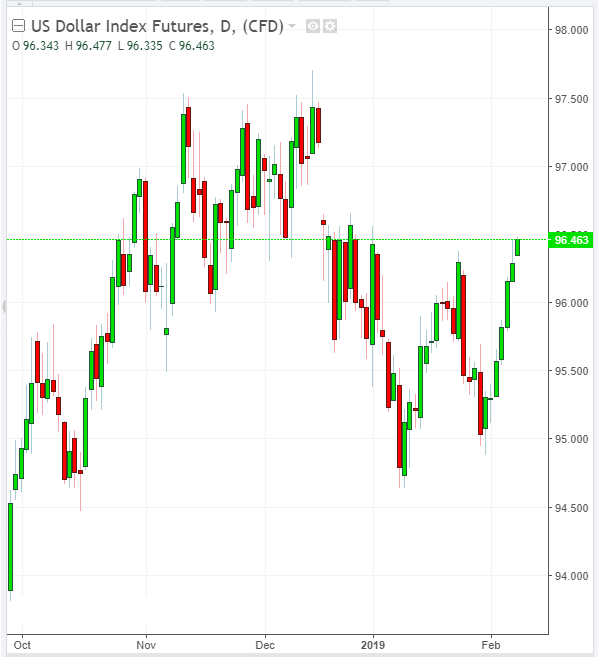
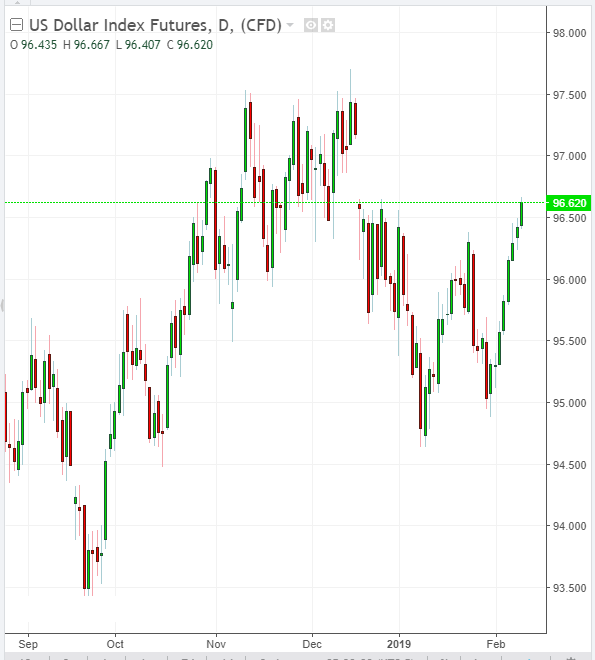
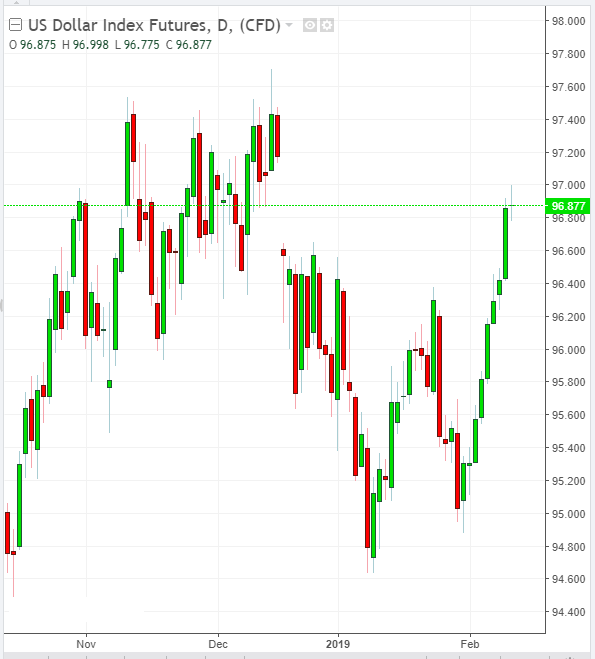
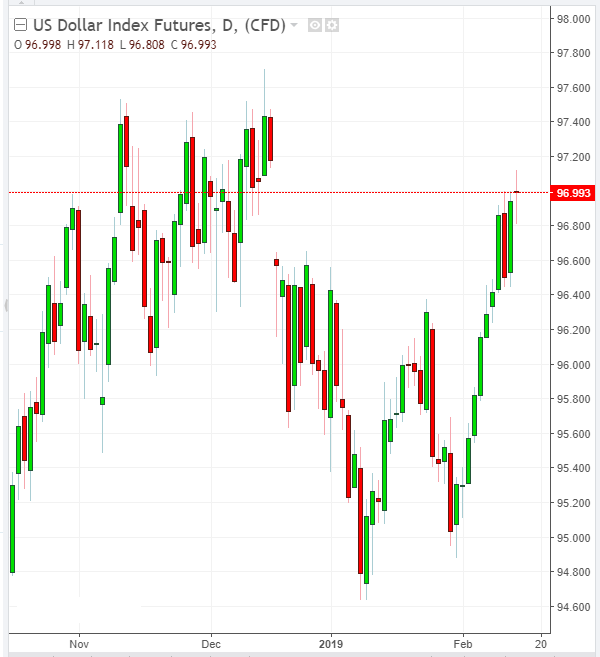
The dollar index DXY, reflecting its value against a basket of 6 currencies, is moderately rising from the opening of the trading day on Tuesday. At the beginning of the European session, futures for the DXY dollar index traded near the 95.68 mark, 10 points higher than the opening price of the trading day.
*)An advanced fundamental analysis is available on the Tifia Forex Broker website at tifia.com/analytics
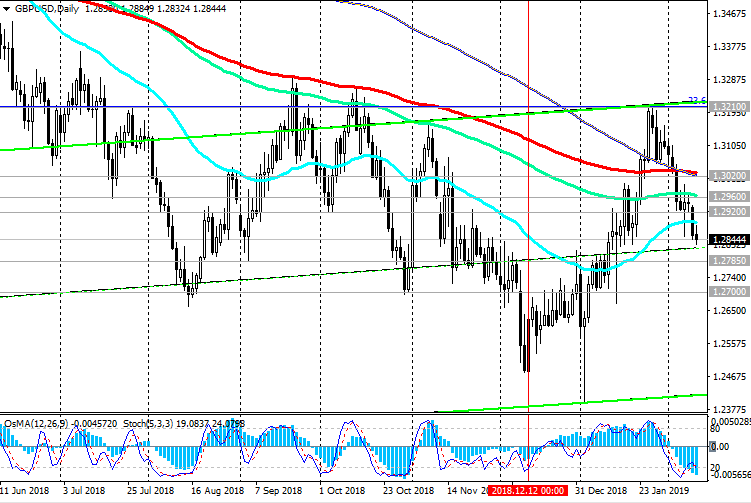
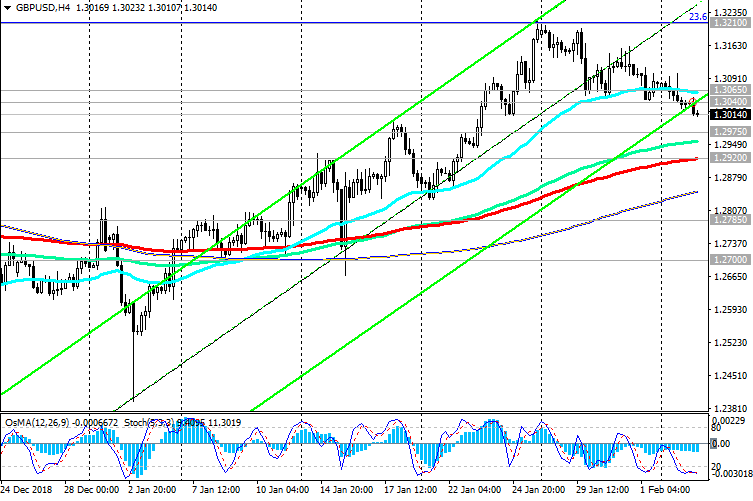
GBP / USD has fallen on Tuesday for 4 days in a row. Weak macro data, unresolved situation with the UK exit from the EU, as well as worsening situation in the world, volatility in financial markets and restraint of the Federal Reserve System can force the Bank of England to take a softer stance with regard to its monetary policy. Any hints of the bank towards a softer policy will cause a sharp decline in the pound.
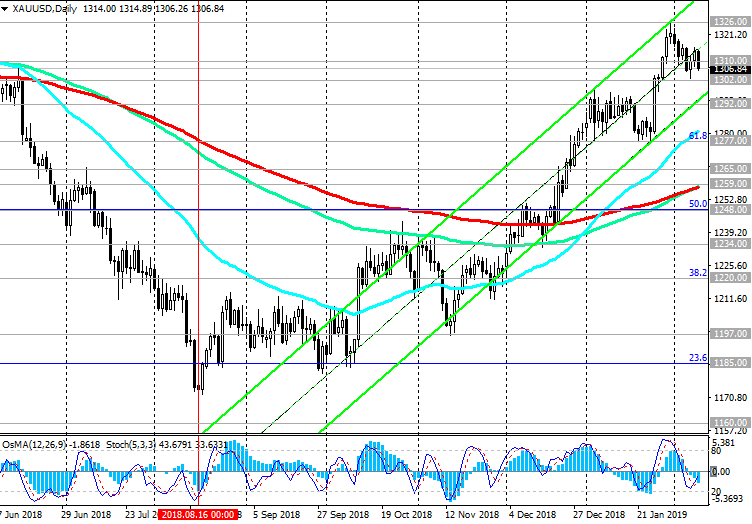
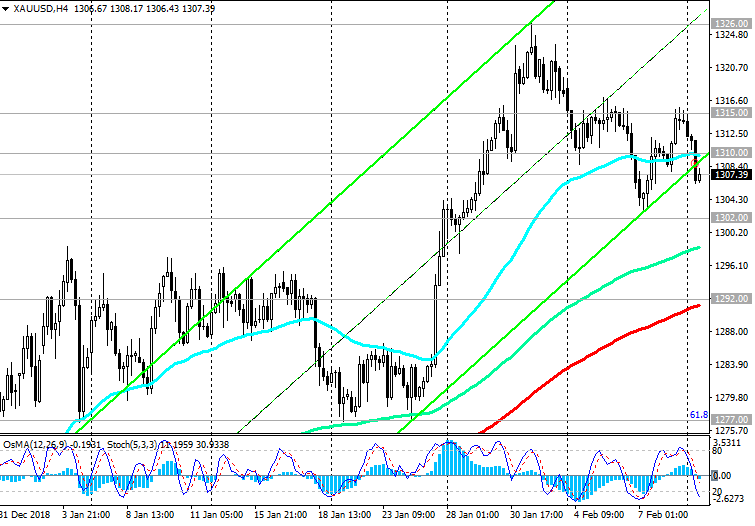
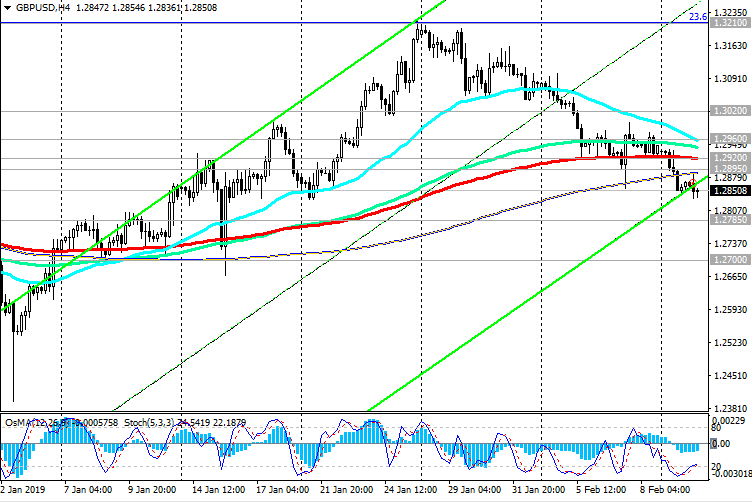
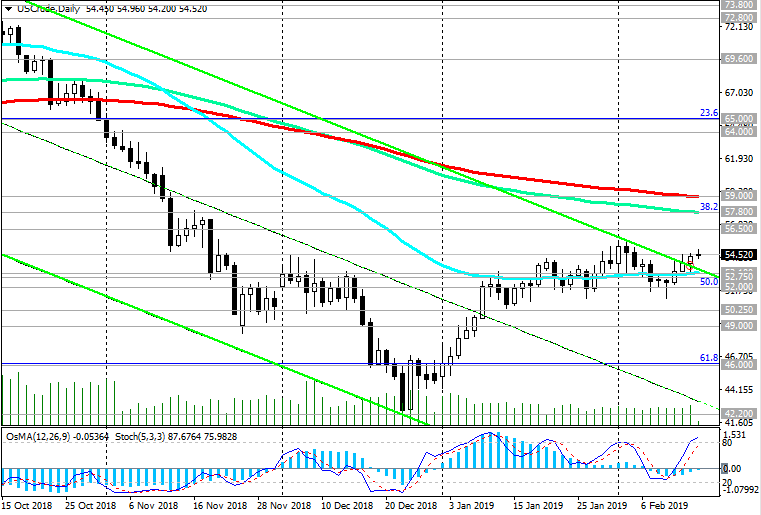
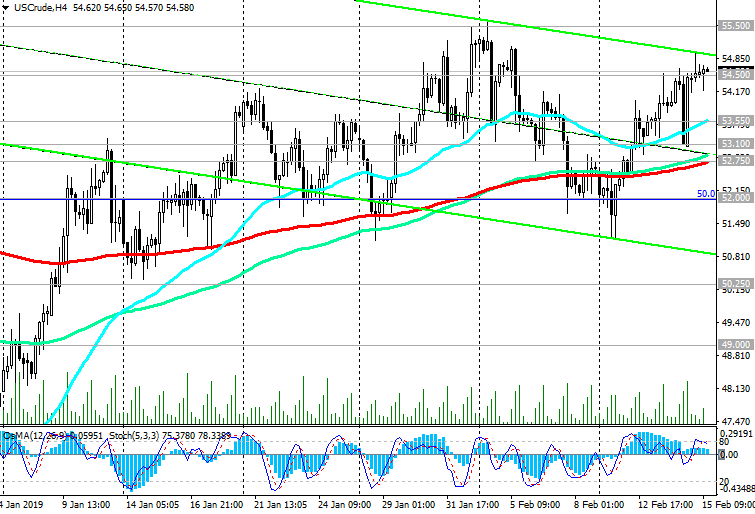
Indicators OsMA and Stochastic on the 1-hour, 4-hour, daily charts switched to the short positions.
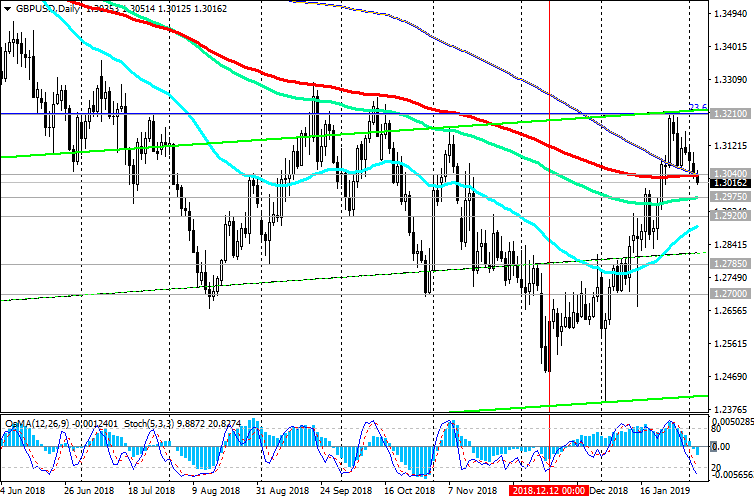
After GBP / USD is fixed in the zone below the support level of 1.2920 (ЕМА50 on the daily chart, ЕМА200 on the 4-hour chart) short positions will again become relevant.
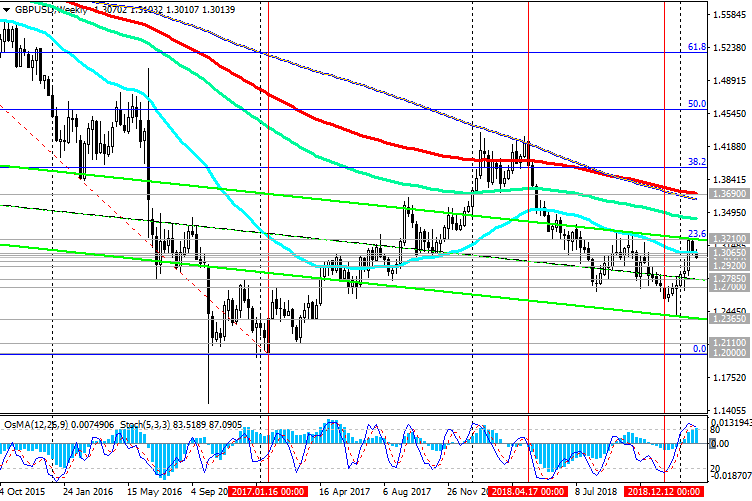
The main trend is still bearish. The objectives of the decline are support levels of 1.2600 (lows of June 2017), 1.2485, 1.2365.
Support Levels: 1.2975, 1.2920, 1.2860, 1.2785, 1.2700, 1.2670, 1.2600, 1.2485, 1.2365, 1.2110, 1.2000
Resistance Levels: 1.3040, 1.3065, 1.3125, 1.3210, 1.3300, 1.3470, 1.3690
Trading scenarios
Sell in the market. Stop Loss 1.3070. Take-Profit 1.2975, 1.2920, 1.2860, 1.2785, 1.2700, 1.2670, 1.2600, 1.2485, 1.2365
Buy Stop 1.3070. Stop Loss 1.2990. Take-Profit 1.3125, 1.3210, 1.3300, 1.3470, 1.3690
*) For up-to-date and detailed analytics and news on the forex market visit Tifia Forex Broker website tifia.com
05/02/2019
After, on Tuesday morning, the RB of Australia expectedly kept the interest rate unchanged, the volatility of trading on the foreign exchange market at the beginning of the European session decreased significantly. Major dollar currency pairs, with the exception of AUD / USD, are traded on Tuesday in a narrow range. The US dollar and the market as a whole do not have enough drivers for further movement.
Probably, such a driver will be the publication in the first half of the US trading session (15:00 GMT) of the report of the Institute for Supply Management (ISM) on activity in the non-manufacturing sector of the United States. Economists expect the non-production composite index from the Institute for Supply Management (ISM) in January to fall to 57.1 from 58.0 in December. Although an index value above 50 indicates an increase in activity, a relative decline in the indicator may have a short-term negative impact on the dollar.
Market participants will also closely monitor the performance of the US President Donald Trump in Congress later on Tuesday with an annual message on the state of the country. Any signals from Trump about a positive change in the sides' positions in the negotiations between the US and China will support the dollar, which needs a strong positive impetus for further growth after the Fed meeting last week. As you know, on Wednesday the Fed kept its current monetary policy unchanged and signaled its intentions to be more restrained in regard to further rate increases. Fed Chairman Jerome Powell said at a press conference that "there was a little less reason to raise rates".
According to the central bank executives, the current level of inflationary pressure does not force the Fed to take any action.
Many investors do not expect further increases in the Federal Reserve rates this year. Moreover, futures on the Fed rates on Monday indicated an 11% chance of lowering the Fed rates by the end of the year. Last week, this probability was 21%, according to the CME Group.
The dollar index DXY, reflecting its value against a basket of 6 currencies, is moderately rising from the opening of the trading day on Tuesday. At the beginning of the European session, futures for the DXY dollar index traded near the 95.68 mark, 10 points higher than the opening price of the trading day.
*)An advanced fundamental analysis is available on the Tifia Forex Broker website at tifia.com/analytics
GBP / USD has fallen on Tuesday for 4 days in a row. Weak macro data, unresolved situation with the UK exit from the EU, as well as worsening situation in the world, volatility in financial markets and restraint of the Federal Reserve System can force the Bank of England to take a softer stance with regard to its monetary policy. Any hints of the bank towards a softer policy will cause a sharp decline in the pound.
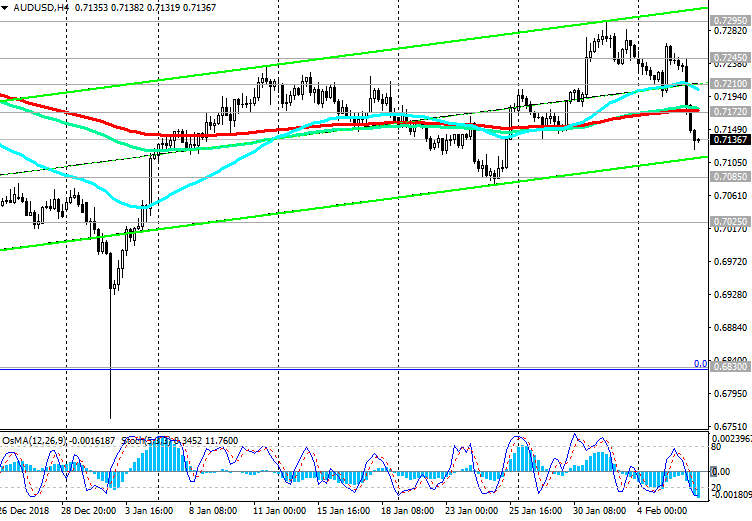
Indicators OsMA and Stochastic on the 1-hour, 4-hour, daily charts switched to the short positions.
After GBP / USD is fixed in the zone below the support level of 1.2920 (ЕМА50 on the daily chart, ЕМА200 on the 4-hour chart) short positions will again become relevant.
The main trend is still bearish. The objectives of the decline are support levels of 1.2600 (lows of June 2017), 1.2485, 1.2365.
Support Levels: 1.2975, 1.2920, 1.2860, 1.2785, 1.2700, 1.2670, 1.2600, 1.2485, 1.2365, 1.2110, 1.2000
Resistance Levels: 1.3040, 1.3065, 1.3125, 1.3210, 1.3300, 1.3470, 1.3690
Trading scenarios
Sell in the market. Stop Loss 1.3070. Take-Profit 1.2975, 1.2920, 1.2860, 1.2785, 1.2700, 1.2670, 1.2600, 1.2485, 1.2365
Buy Stop 1.3070. Stop Loss 1.2990. Take-Profit 1.3125, 1.3210, 1.3300, 1.3470, 1.3690
*) For up-to-date and detailed analytics and news on the forex market visit Tifia Forex Broker website tifia.com