Tifia Forex Broker Daily Market Analytics, Analytics and trading recommendations by Tifia Company

EUR/USD: Eurodollar remains under pressure

06/03/2019


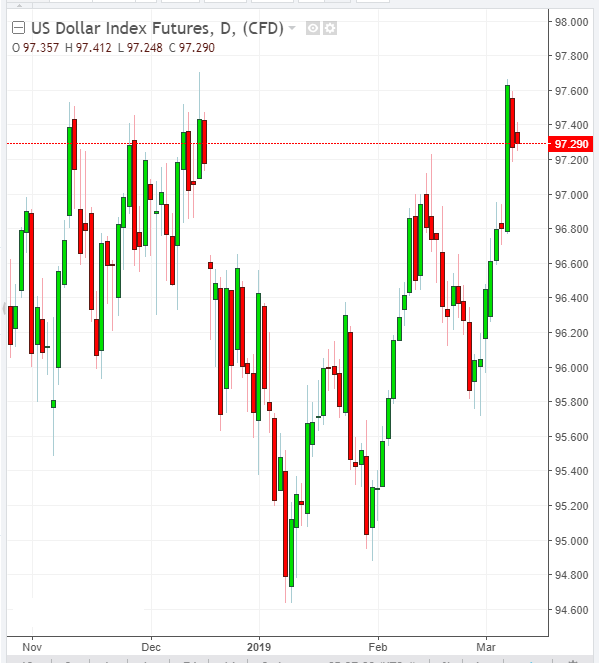
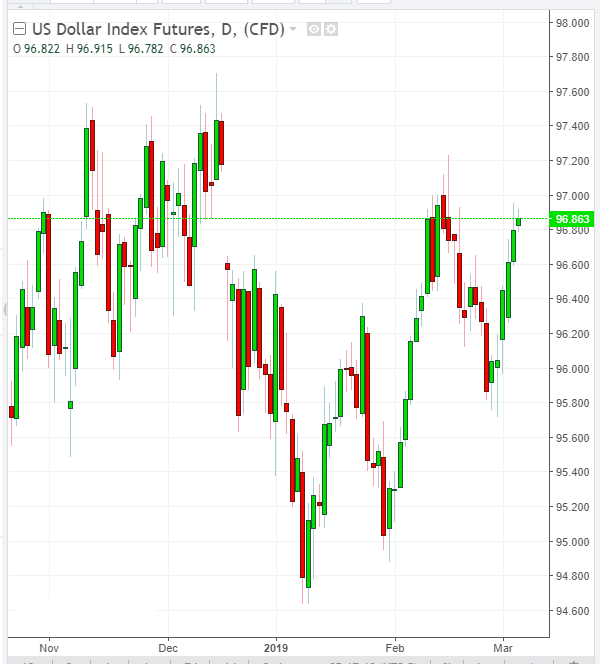
Despite the positive macro statistics received on Tuesday from Europe, the Eurodollar could not strengthen. Moreover, on Tuesday, the EUR / USD pair fell, losing about 30 points, to the level of 1.1308. Reducing the pair is contributed by the general strengthening of the dollar, and expectations of restrained statements at tomorrow's meeting of the ECB regarding the prospects for monetary policy. As expected, the ECB will maintain its current monetary policy and reduce expectations for growth of the European economy and inflation in the Eurozone. Many market participants expect the rate to be raised by the ECB not earlier than mid-2020.

*)An advanced fundamental analysis is available on the Tifia Forex Broker website at tifia.com/analytics


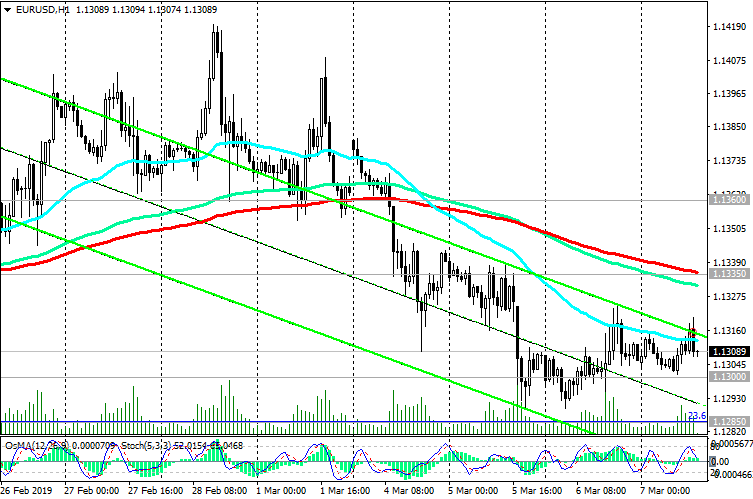
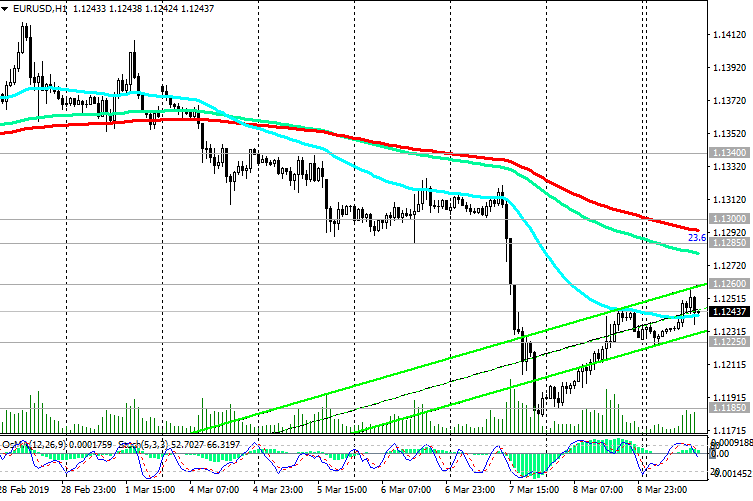
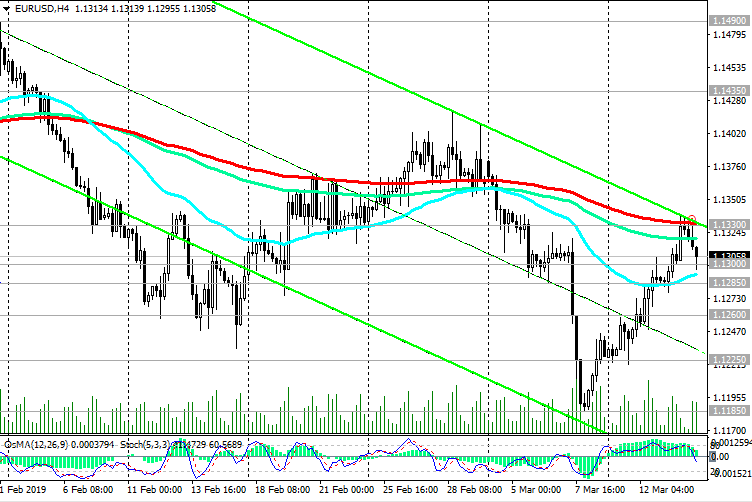
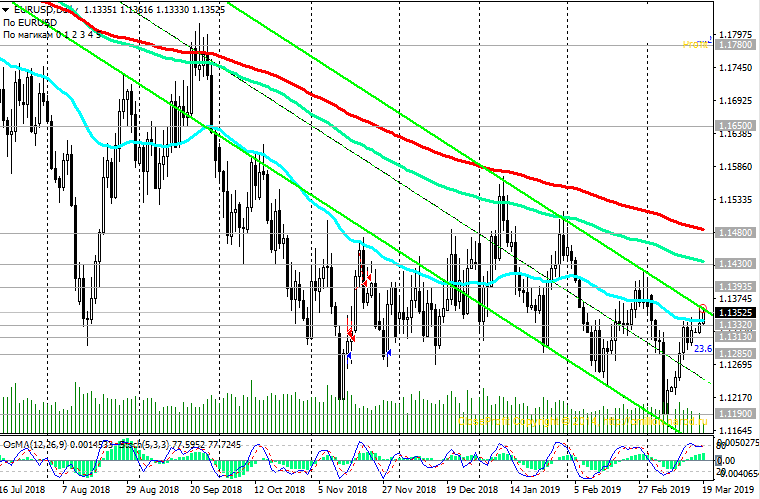
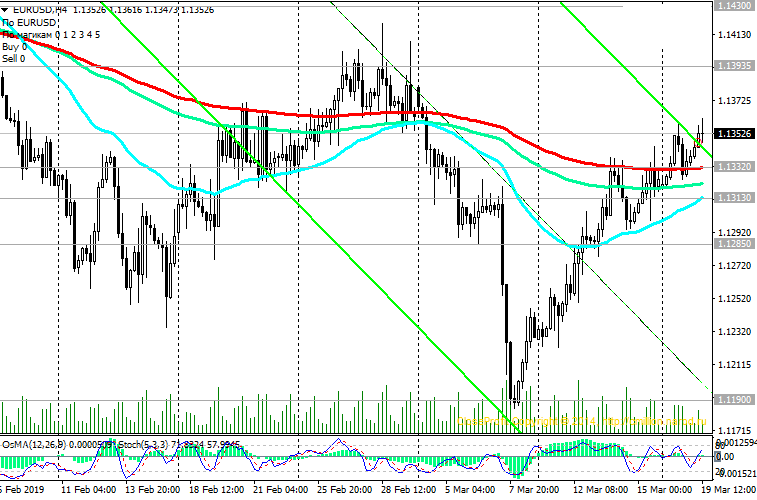
On Wednesday, the EUR / USD remains under pressure, bargaining near the local support level of 1.1300.

In the event of a breakdown of this support level, EUR / USD will move to targets at support levels of 1.1270 (December lows), 1.1215 (November and year lows), 1.1200, 1.1120, 1.1000.

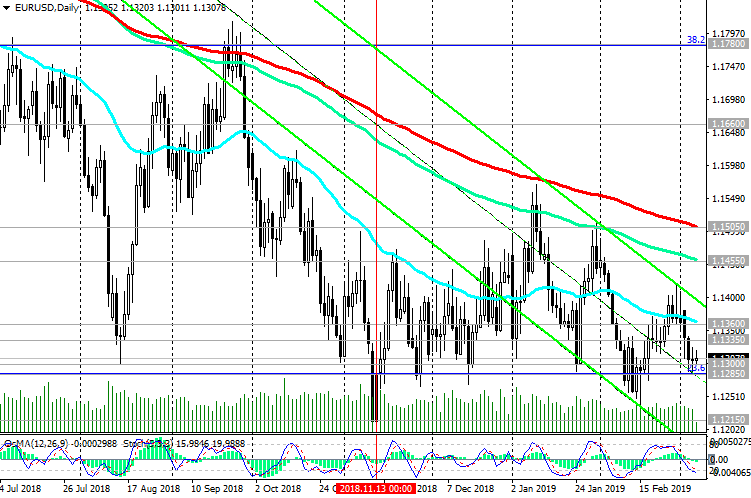
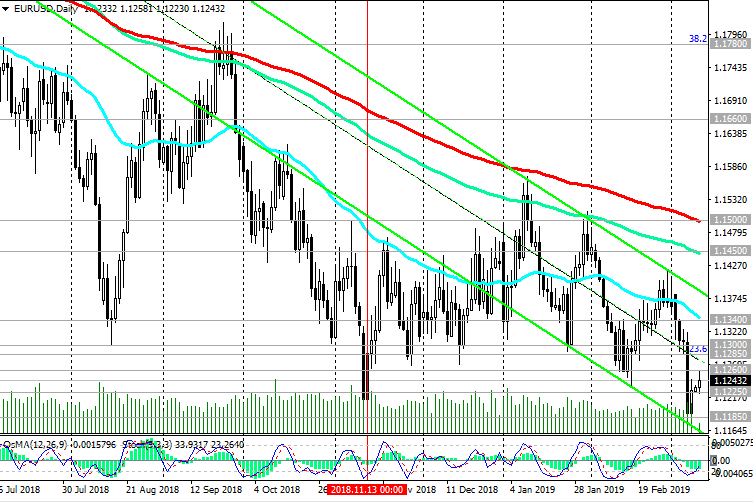
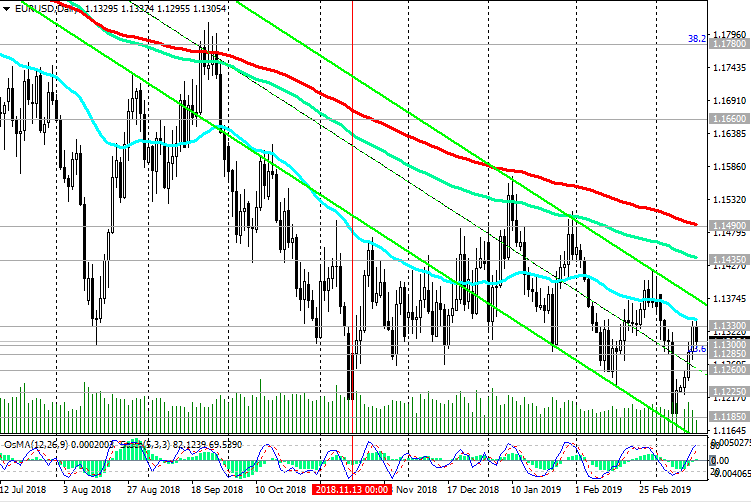
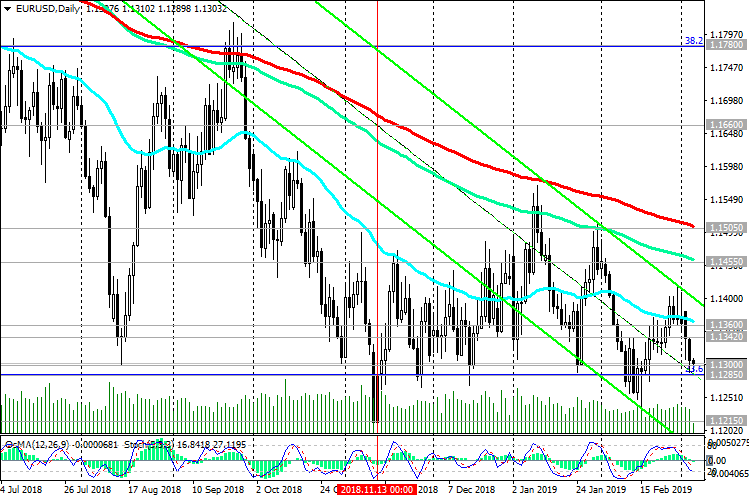
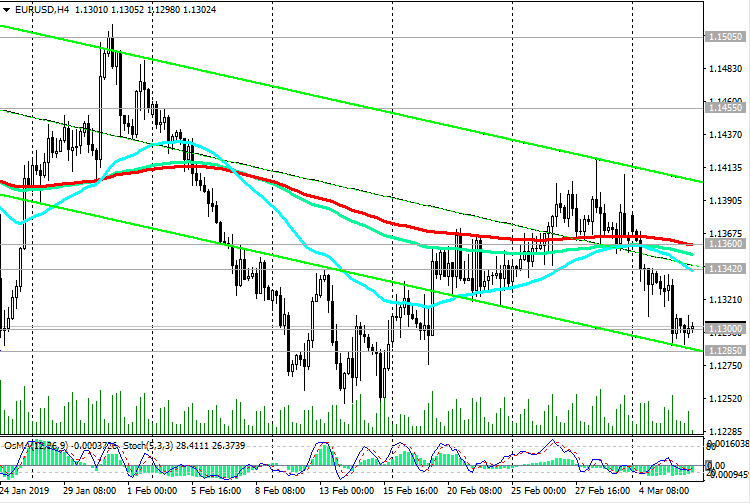
Purchases with targets at resistance levels 1.1455 (ЕМА144 on the daily chart), 1.1505 (ЕМА200 on the daily chart) are possible only after the breakdown of the resistance level 1.1360 (ЕМА200 on the 4-hour chart, ЕМА50 on the daily chart). The long-term bearish trend, which began in May 2014 near the 1.3870 mark, remains.

Short positions are preferred.

Support Levels: 1.1300, 1.1285, 1.1215, 1.1120, 1.1000

Resistance Levels: 1.1342, 1.1360, 1.1455, 1.1505


Trading recommendations


Sell in the market. Stop-Loss 1.1345. Take-Profit 1.1285, 1.1215, 1.1120, 1.1000

Buy Stop 1.1350. Stop Loss 1.1280. Take-Profit 1.1400, 1.1455, 1.1500

060319-DXY.png


060319-EU-D.png


060319-EU-H4.png


*) For up-to-date and detailed analytics and news on the forex market visit Tifia Forex Broker website tifia.com
 
EUR/USD: ECB meeting and press conference may “drop” the euro

03/07/2019

Current Dynamics


As the EU Statistical Agency reported on Thursday, Eurozone GDP in the 4th quarter of 2018 grew by 0.9% (year on year) after increasing by 0.6% in the 3rd quarter. Eurozone GDP in the 4th quarter of 2018 grew by only 1.1% compared with the same period of the previous year, which was the lowest annual growth rate since 2013. At the same time, the US economy in the 4th quarter of 2018 increased by 3.1%.

On Thursday, the attention of market participants will be focused on the meeting and press conference of the ECB, which will begin at 13:30 (GMT). As expected, the monetary policy of the bank will remain unchanged. Investors are interested in signals about the possible actions of the ECB in the event of a steady slowdown in the growth of the Eurozone economy. On Wednesday, the Organization for Economic Cooperation and Development lowered its forecast for economic growth in the Eurozone for 2019 to 1%, while it had previously expected a growth of 1.8%.

If the ECB signals a new round of targeted long-term refinancing operations (TLTRO) or a management propensity to ease monetary policy, the euro could decline significantly.

*)An advanced fundamental analysis is available on the Tifia Forex Broker website at tifia.com/analytics

On Thursday, the EUR / USD pair remains under pressure, bargaining near the local support level of 1.1300. In the event of a breakdown of this level, EUR / USD will move to targets at support levels of 1.1270 (December lows), 1.1215 (November and year lows), 1.1200, 1.1120, 1.1000.

Long positions can be returned only if EUR / USD is fixed above the resistance level of 1.1360 (ЕМА200 on the 4-hour chart, ЕМА50 on the daily chart). The targets are at resistance levels of 1.1455 (EMA144 on the daily chart), 1.1505 (EMA200 on the daily chart).

The long-term bearish trend, which began in May 2014 near the 1.3870 mark, remains.

Short positions are preferred.

Support Levels: 1.1300, 1.1285, 1.1215, 1.1120, 1.1000

Resistance Levels: 1.1342, 1.1360, 1.1455, 1.1505


Trading recommendations


Sell in the market. Stop-Loss 1.1340. Take-Profit 1.1285, 1.1215, 1.1120, 1.1000

Buy Stop 1.1340. Stop Loss 1.1280. Take-Profit 1.1400, 1.1455, 1.1500


070319-EU-D.png


070319-EU-H1.png


*) For up-to-date and detailed analytics and news on the forex market visit Tifia Forex Broker website tifia.com
 
EUR/USD: the dollar is likely to continue to strengthen

03/11/2019


After the published report on the labor market, investors' concerns that the global economic slowdown could have spread to the United States increased, and the likelihood of easing of the Fed’s monetary policy also increased.

As the US Department of Labor reported last Friday, unemployment in the country fell to 3.8% in February against 4.0% in January, the average hourly earnings in the private sector increased by 11 cents and amounted to $ 27.66. However, the number of jobs outside of US agriculture in February increased by 20,000. Economists had expected that the number of jobs in February would grow by 180,000, and unemployment would be 3.9%.

And yet, according to economists, the attractiveness of the dollar to investors will grow over the next few months. Despite the downturn in the global economy, the US economy looks more resilient compared to other major economies in the world. The dollar will continue to strengthen in the foreign exchange market.

At the same time, the euro remains under pressure after the ECB meeting last week. The outlook for the European economy has worsened, according to the ECB management. The head of the ECB, Mario Draghi, said that the GDP growth in the Eurozone in 2019 will be 1.1%, not 1.7%, in 2020, 1.6%, and not 1.7% as previously planned.

The ECB announced a new program of target long-term refinancing, which was a surprise to investors.

*)An advanced fundamental analysis is available on the Tifia Forex Broker website at tifia.com/analytics


The euro fell sharply last week, and the EUR / USD pair fell 1% (or 114 points) to 1.1191. On Thursday, the multi-month low was recorded at 1.1177.

The ECB will have to forget about the early start of the interest rate increase cycle. A further weakening of the euro and a decline in the EUR / USD pair are likely.

After the breakdown of the local support level of 1.1225, EUR / USD will move to the targets at the support levels of 1.1185, 1.1120, 1.1000.

The long-term bearish trend, which began in May 2014 near the 1.3870 mark, remains.

Short positions are preferred.

Support Levels: 1.1225, 1.1185, 1.1120, 1.1000

Resistance Levels: 1.1260, 1.1285, 1.1300, 1.1340, 1.1450, 1.1500


Trading recommendations


Sell Stop 1.1215. Stop Loss 1.1275. Take-Profit 1.1185, 1.1120, 1.1000

Buy Stop 1.1275. Stop Loss 1.1215. Take-Profit 1.1285, 1.1300, 1.1340, 1.1450, 1.1500

110319-DXY.png


110319-EU-D.png


110319-EU-H1.png


*) For up-to-date and detailed analytics and news on the forex market visit Tifia Forex Broker website tifia.com
 
GBP/USD: Trading Scenarios

03/12/2019


The British pound fell after the publication of data on the trade deficit, which exceeded market expectations. The trade deficit in January rose to 13.1 billion pounds from the December figure of 12.7 billion pounds.

Other data pointed to a recovery in the growth of the British economy in January after a weak December. GDP growth in November-January on an annualized basis amounted to 1.1% versus 0.9% in the previous three months.

Meanwhile, the greatest impact on the pound have expectations regarding the upcoming parliamentary vote on Brexit.

The pair GBP / USD declined in the first half of the European session and at the time of writing this article was trading down 140 points to the opening price of the trading day near 1.3040.

Through this mark passes a strong level of support in the form of a 200-period moving average on the daily chart.

*)An advanced fundamental analysis is available on the Tifia Forex Broker website at tifia.com/analytics


In the event of a breakdown of a lower support level of 1.3000 (EMA144 on the daily chart), GBP / USD will go to support levels of 1.2785 (February lows), 1.2700. A more distant target for the decline is the support level of 1.2400 (lows of 2018, 2019).

In the case of GBP / USD growth and its return to the zone above the short-term resistance level of 1.3130 (ЕМА200 on the 1-hour chart), further strengthening and growth to the resistance level of 1.3400 (the upper limit of the ascending channel on the daily chart) is likely.

The distant target is at the resistance level of 1.3670 (ЕМА200 on the weekly chart) and higher.

Support Levels: 1.3040, 1.3000, 1.2800, 1.2785, 1.2700, 1.2670, 1.2600, 1.2485, 1.2400

Resistance Levels: 1.3100, 1.3130, 1.3210, 1.3300, 1.3400, 1.3670


Trading scenarios


Sell Stop 1.2990. Stop Loss 1.3140. Take-Profit 1.2800, 1.2785, 1.2700, 1.2670, 1.2600, 1.2485, 1.2400

Buy Stop 1.3140. Stop Loss 1.2990. Take-Profit 1.3210, 1.3300, 1.3400, 1.3670

110319-DXY.png


110319-EU-D.png


110319-EU-H1.png


*) For up-to-date and detailed analytics and news on the forex market visit Tifia Forex Broker website tifia.com
 
I like the analysis on pound and will go with the trend with sell stop. But I am staying away from EURUSD at the moment.
 
GBP/USD: Current Dynamics

13/03/2019


The pound is regaining its position after a sharp fall on Tuesday, when the British parliament again voted against the version of the Brexit agreement proposed by Prime Minister Theresa May.

Now lawmakers on Wednesday will vote on the issue of leaving the EU on March 29 without a deal. If they vote against, then on Thursday there will be a vote on the question of postponing the exit date from March 29 to a later date.

The GBP / USD maintains a positive trend, trading above key support levels of 1.3050 (ЕМА200 on the daily and 4-hour charts), 1.3000 (ЕМА144 on the daily chart).

In case of continued growth and after the breakdown of the resistance level of 1.3210 (Fibonacci level 23.6% of the correction to the decline of GBP / USD in the wave that started in July 2014 near 1.7200) GBP / USD will aim to the resistance levels 1.3300, 1.3400 (upper limit of the ascending channel on the daily chart), 1.3670 (ЕМА200 on the weekly chart).

Short positions will become relevant after the GBP / USD decline to a zone below the support level of 1.3000.

The signal for the resumption of sales of GBP / USD will be the breakdown of the short-term support level of 1.3123 (ЕМА200 on the 1-hour chart).

Support Levels: 1.3123, 1.3050, 1.3000, 1.2800, 1.2785, 1.2700, 1.2670, 1.2600, 1.2485, 1.2400

Resistance Levels: 1.3210, 1.3300, 1.3400, 1.3670


Trading Recommendations


Sell Stop 1.3090. Stop Loss 1.3170. Take-Profit 1.3050, 1.3000, 1.2800, 1.2785, 1.2700, 1.2670, 1.2600, 1.2485, 1.2400

Buy Stop 1.3170. Stop Loss 1.3090. Take-Profit 1.3210, 1.3300, 1.3400, 1.3670

130319-GU-D.png


130319-GU-H4.png


*) For up-to-date and detailed analytics and news on the forex market visit Tifia Forex Broker website tifia.com
 
EUR/USD: dollar strengthened

14/03/2019


The dollar index DXY, reflecting the value of the dollar against a basket of 6 currencies, is growing on Thursday.

In the middle of the European session, futures for the DXY dollar index traded near the 96.75 mark, 25 points higher than the opening price of today.

As the National Bureau of Statistics of China reported on Thursday, industrial production in the country in January-February increased by 5.3% compared with the same period last year, after an annual growth of 5.7% in December. At the beginning of 2019, the growth of the Chinese economy slowed down. Industrial production growth was weak, despite some recovery in investment.

In a situation of international trade wars, the US economy looks more stable compared to other major world economies.

This increases the investment attractiveness of the dollar and US assets.

Dollar growth also resumed after US President Donald Trump warned Beijing on Wednesday that he would not sign a trade agreement that would not take into account Washington’s demands.

On Thursday, the focus of traders' attention is the vote in the British Parliament on the postponement of the country's withdrawal from the EU from March 29 to a later date.

However, further developments are still very uncertain, which creates prerequisites for maintaining the situation of increased volatility in the financial market.

The situation around Brexit is reflected both in quotes of the pound and in quotations of the euro.

*)An advanced fundamental analysis is available on the Tifia Forex Broker website at tifia.com/analytics


On Thursday, the EUR / USD is falling amid a stronger dollar. Probably further fall of the Eurodollar.

The outlook for the European economy has worsened, according to the ECB management. The head of the ECB, Mario Draghi, after the last meeting of the ECB, said that the GDP growth in the Eurozone in 2019 will be 1.1%, not 1.7%, in 2020 1.6%, and not 1.7%, as planned earlier.

The ECB announced a new program of target long-term refinancing, which was a surprise to investors.

The euro fell sharply last week, and the EUR / USD pair fell 1% (or 114 points) to 1.1191. Last Thursday the multi-month minimum was fixed at 1.1177.

In the event of a breakdown of support levels of 1.1300, 1.1285 (Fibonacci level 23.6% of the correction to the fall from the level of 1.3900, which began in May 2014), EUR / USD will head towards targets at support levels of 1.1185, 1.1120, 1.1000.

The long-term bearish trend, which began in May 2014 near the 1.3870 mark, remains.

Short positions are preferred.

Long positions will become relevant after EUR / USD is fixed in the zone above the resistance level of 1.1330 (ЕМА200 on the 4-hour chart, ЕМА50 on the daily chart).

Support Levels: 1.1300, 1.1285, 1.1260, 1.1225, 1.1185, 1.1120, 1.1000

Resistance Levels: 1.1330, 1.1435, 1.1490


Trading recommendations


Sell Stop 1.1280. Stop-Loss 1.1340. Take-Profit 1.1260, 1.1225, 1.1185, 1.1120, 1.1000

Buy Stop 1.1340. Stop Loss 1.1280. Take-Profit 1.1435, 1.1500

140319-EU-D.png


140319-EU-H4.png


*) For up-to-date and detailed analytics and news on the forex market visit Tifia Forex Broker website tifia.com
 
WTI: oil prices likely to rise further

03/15/2019

Current dynamics


Oil prices are rising again on Friday, receiving support from data on US oil reserves, published on Wednesday. As the Energy Information Administration (EIA) of the US Department of Energy reported, oil reserves in the US last week unexpectedly fell by 3.9 million barrels to 449.1 million barrels (the forecast was +1.9 million barrels). The US restrictions on oil exports from Iran and Venezuela also contribute to a more significant reduction in world supply and higher oil prices. The United States intends to reduce the supply of oil from Iran by about 20%.

On Friday at 17:00 (GMT), the American oilfield service company Baker Hughes will publish a weekly report on the number of oil drilling rigs in the United States. To date, the number of active rigs in the United States is 834 active rigs, which is much lower than the maximum of 887 units, achieved at the end of 2018. The increase in the number of active drilling rigs will support oil prices.

*)An advanced fundamental analysis is available on the Tifia Forex Broker website at tifia.com/analytics


On Thursday, WTI crude prices hit a high in 2019 near $58.67 a barrel, and oil prices continue to rise on the first half of the trading day on Friday.

In case of consolidation above the key support level of 58.60 (ЕМА200 on the daily chart), further price growth is likely.

So far, WTI oil is trading above important support levels of 55.50 (ЕМА200 on 4-hour chart), 56.35 (ЕМА200 on weekly chart), 57.80 (Fibonacci 38.2% of the correction to the growth wave that started in February 2016 from near the mark of 27.30), positive dynamics is maintained. Long positions are preferred.

In the case of a breakdown of the short-term support level of 57.10 (ЕМА200 on the 1-hour chart), the decline will resume with targets at the support levels of 56.35, 55.50, 53.80, 52.00, 50.25, 49.00, 46.00, 42.20.

Support Levels: 58.60, 57.80, 57.10, 56.35, 55.50, 53.80, 52.00

Resistance Levels: 59.00, 60.00, 62.00, 64.00, 65.00


Trading scenarios


Sell Stop 56.90. Stop Loss 59.10. Take-Profit 56.35, 55.50, 53.80, 52.00, 50.25, 49.00, 46.00, 42.20

Buy Stop 59.10. Stop Loss 56.90. Take-Profit 60.00, 62.00, 64.00, 65.00

150319-WTI-D.png


150319-WTI-H1.png


*) For up-to-date and detailed analytics and news on the forex market visit Tifia Forex Broker website tifia.com
 
S&P500: Current Situation

18/03/2019


Last week, the DJIA grew by 1.6%, the Nasdaq - by 3.8%, and the S&P 500 - by 2.9%, closing at the maximum levels of 2019. The growth leader in the S&P 500 for the current year remains the technology sector.

On Monday, the positive dynamics of US stock indices persisted, although their growth stopped. At the beginning of the European session, futures for the S&P500 index are traded near the mark of 2824.0. Today, the publication of important macro data is not expected, and, probably, US stock indexes will remain traded near the current levels. But on Wednesday you should be careful when trading stock indices and the dollar. Recall that at 18:00 (GMT) the Fed’s decision on the interest rate will be published, and at 18:30 (GMT) the Fed’s press conference will begin. During this period, a sharp increase in volatility in financial markets is likely. The soft rhetoric of Jerome Powell’s speech will further boost US stock indices.

*)An advanced fundamental analysis is available on the Tifia Forex Broker website at tifia.com/analytics


At the end of January, the S&P500 index broke through key resistance levels of 2676.0 (Fibonacci level 23.6% of the correction to the growth since February 2016), 2720.0 (ЕМА200 on the daily chart), significantly recovered after falling in the 4th quarter of last year.

At the moment, the growth of US stock indexes and the S&P500 index continues. Investors are betting on further growth of indices against the background of a more stable position of the American economy in comparison with other major economies of the world.

at the beginning of the American session, the S&P500 is trading near the 2828.0 mark. The S&P500 maintains a positive trend, trading in the upward channel on the daily chart, above the key support level of 2720.0.

Long positions are preferred. The signal for the resumption of sales will be the breakdown of the short-term support level of 2796.0 (ЕМА200 on the 1-hour chart).

Support Levels: 2817.0, 2796.0, 2755.0, 2720.0, 2676.0, 2550.0, 2507.0, 2450.0, 2386.0, 2335.0

Resistance Levels: 2836.0, 2873.0, 2936.0


Trading recommendations


Sell Stop 2794.0. Stop Loss 2838.0. Objectives 2755.0, 2720.0, 2676.0

Buy Stop 2838.0. Stop Loss 2794.0. Objectives 2873.0, 2936.0

180319-DXY.png


180319-s500-D.png


180319-s500-H1.png


*) For up-to-date and detailed analytics and news on the forex market visit Tifia Forex Broker website tifia.com
 
EUR/USD: Current dynamics

03/19/2019


The US dollar continues to decline on Tuesday. Investors expect that at a meeting on Wednesday, the Fed will demonstrate a propensity for a soft monetary policy. The decision on the Fed's interest rate will be published on Wednesday at 18:00 (GMT), and a press conference will begin at 18:30, at which Fed Chairman Jerome Powell can clarify what the central bank is thinking about the economy and the prospects for monetary policy.

In recent weeks, Fed officials have made it clear that they are not in a hurry to change rates until the situation with the US economy is clear.

On Tuesday, futures for the DXY dollar index, which measures the value of the dollar against a basket of 6 major world currencies, is trading near 95.83, down 76 points from the closing price last Friday.

Some market participants are betting that the Fed will not raise the rate until the end of the year and may even lower it if the situation in the economy and the US labor market deteriorates. This is a negative factor for the dollar. Expectations that rates do not rise usually put pressure on the dollar, making it less attractive to investors.

*)An advanced fundamental analysis is available on the Tifia Forex Broker website at tifia.com/analytics


On Tuesday, the EUR / USD is trying to develop an upward trend above the resistance level of 1.1332 (ЕМА200 on the 4-hour chart).

The top line of the descending channel on the daily chart also passes through the mark 1.1332, from which the release and return inside this channel is likely.

Downward dynamics prevail. The breakdown of the support level of 1.1313 (EMA200 on the 1-hour chart) will be a signal for the resumption of Eurodollar sales.

In the event of a breakdown of support levels of 1.1300, 1.1285 (Fibonacci level 23.6% of the correction to the fall from the level of 1.3900, which began in May 2014), EUR / USD will head towards targets at support levels of 1.1185, 1.1120, 1.1000.

The long-term bearish trend, which began in May 2014 near the 1.3870 mark, remains.

Short positions are preferred.

Long positions will become relevant after EUR / USD is fixed in the zone above the local resistance level of 1.1350.

Support Levels: 1.1332, 1.1313, 1.1300, 1.1285, 1.1260, 1.1225, 1.1185, 1.1120, 1.1000

Resistance Levels: 1.1350, 1.1400, 1.1430, 1.1480


Trading recommendations


Sell Stop 1.1330. Stop-Loss 1.1365. Take-Profit 1.1313, 1.1300, 1.1285, 1.1260, 1.1225, 1.1185, 1.1120

Buy Stop 1.1365. Stop-Loss 1.1330. Take-Profit 1.1400, 1.1430, 1.1480

190319-DXY.png


190319-EU-D.png


190319-EU-H4.png


*) For up-to-date and detailed analytics and news on the forex market visit Tifia Forex Broker website tifia.com
 
Back
Top