Tifia Forex Broker Daily Market Analytics, Analytics and trading recommendations by Tifia Company

XAU/USD: Current Dynamics

05/04/2019


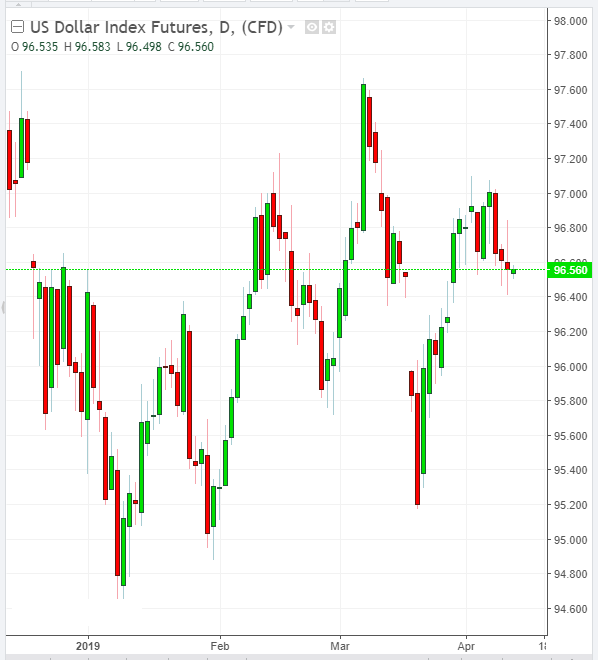
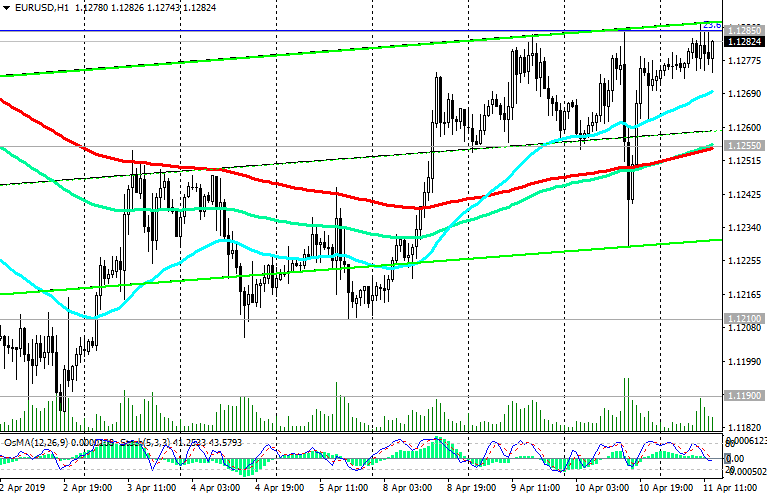
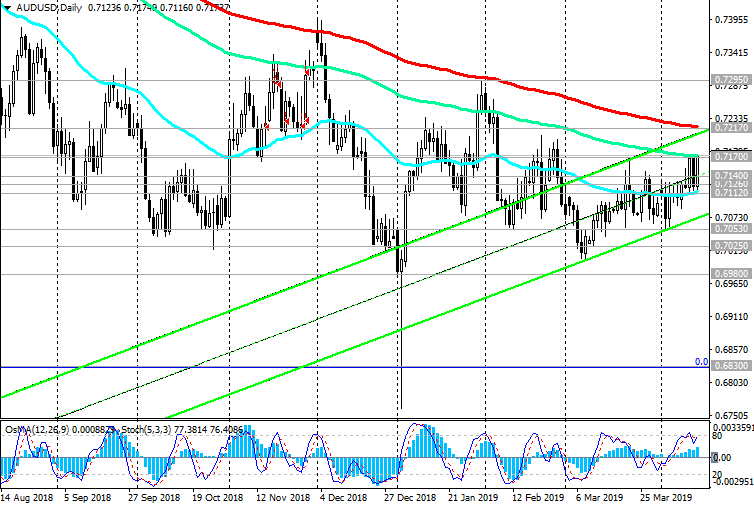
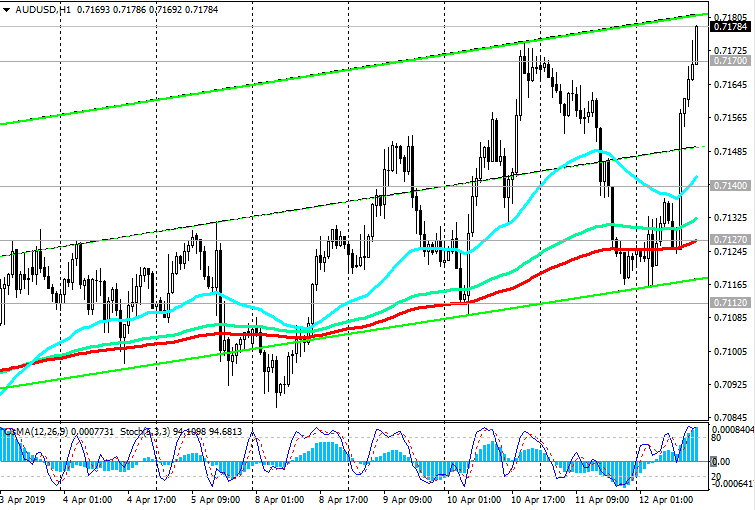
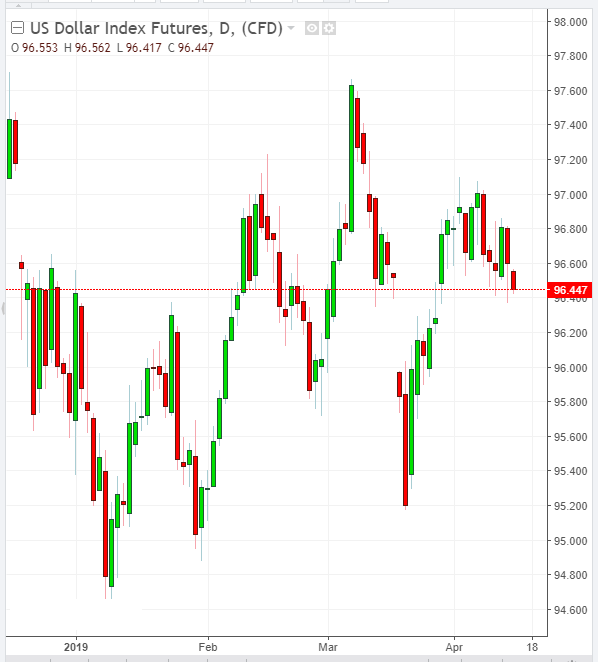
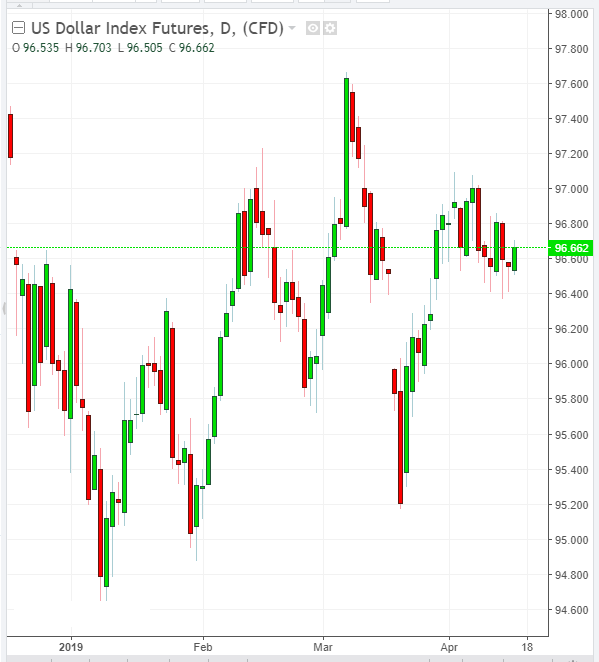
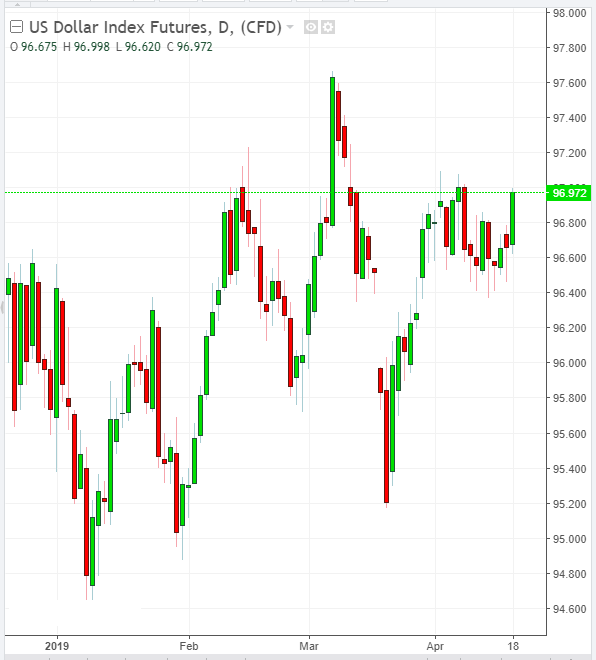
Futures on the dollar index DXY, reflecting its value against a basket of 6 major currencies, is traded on Friday in a narrow range, near the mark of 96.92. Investors are waiting for publication at 12:30 (GMT) of data from the US labor market.

It is expected that the number of new jobs outside the agricultural sector of the US economy in March was 180,000 (against +20,000 in February), while unemployment remained at the same level of 3.8%. These are strong indicators that can support the dollar.

If the growth of NFP is below 100,000, this may cause concern for investors and economists, indicating that the growth of the American economy is slowing.

*)An advanced fundamental analysis is available on the Tifia Forex Broker website at tifia.com/analytics


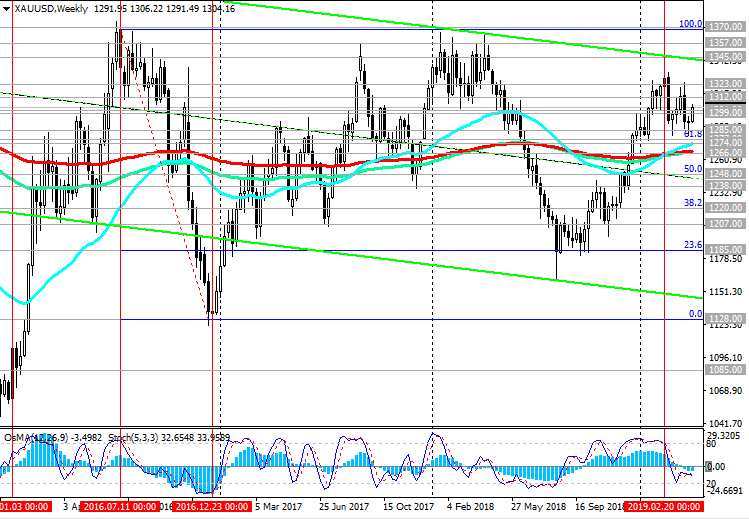
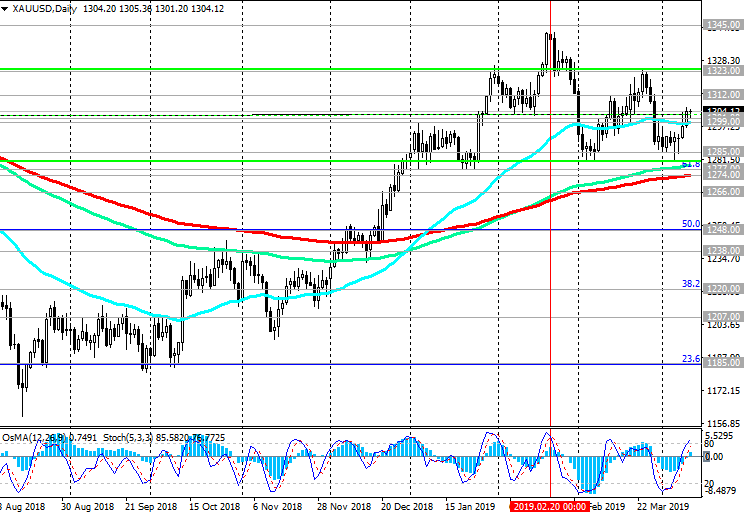
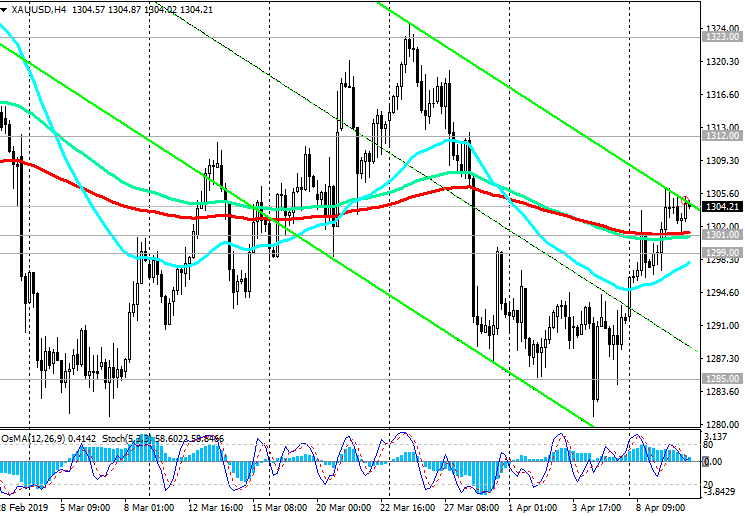
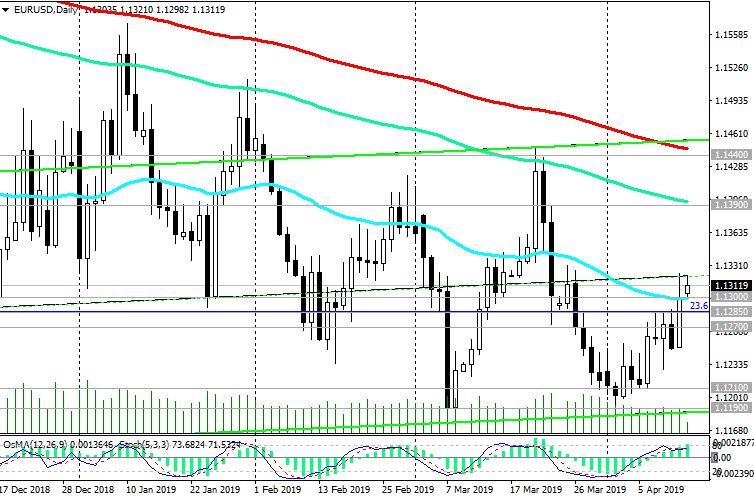
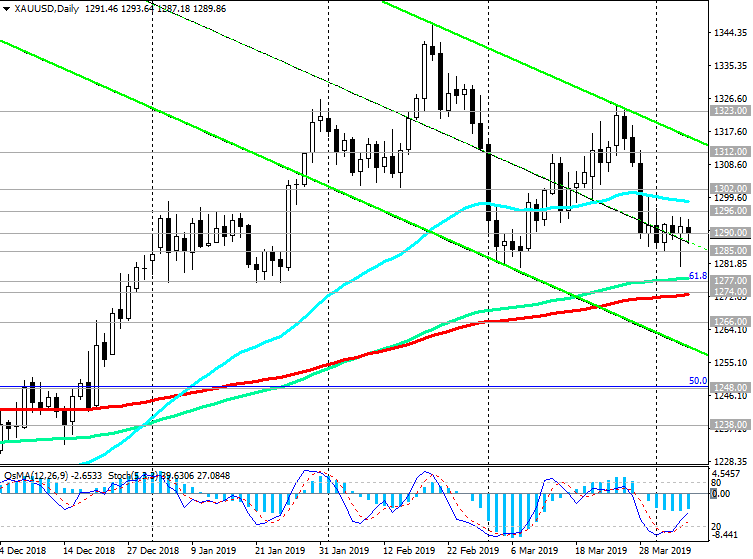
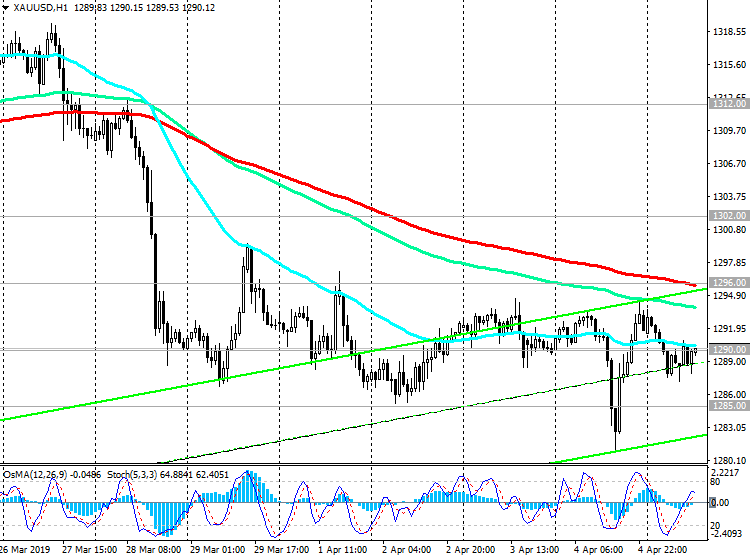
Meanwhile, the last 6 days, the XAU / USD pair is in a narrow range near the current levels due to the lack of strong drivers for further movement either down or up. Probably, today will provide investors with such guidelines. A strong report from the US labor market will strengthen the dollar and send a pair of XAU / USD to strong support levels of 1277.00 (EMA144 on the daily chart and Fibonacci 61.8% level of the correction to the decline wave since July 2016), 1274.00 (EMA200 on the daily chart).

Breakdown of the support level of 1266.00 (ЕМА200 on the weekly chart) will return XAU / USD to the global bearish trend that began in 2012 near the mark of 1795.00 and direct it to the support levels of 1197.00 (November lows), 1185.00 (Fibonacci 23.6%), 1160.00 (minimums of 2018).

The weak data on the labor market, on the contrary, will increase the attractiveness of gold. The immediate targets for the growth of XAU / USD will be resistance levels of 1323.00, 1345.00 (highs of February and 2019).

Support Levels: 1285.00, 1277.00, 1274.00, 1266.00, 1248.00

Resistance Levels: 1296.00, 1302.00, 1312.00, 1323.00, 1345.00, 1357.00, 1365.00, 1370.00


Trading recommendations


Sell Stop 1284.00. Stop-Loss 1297.00. Take-Profit 1277.00, 1274.00, 1266.00, 1248.00, 1234.00, 1220.00, 1197.00, 1185.00, 1160.00

Buy Stop 1297.00. Stop-Loss 1284.00. Take-Profit 1302.00, 1312.00, 1323.00, 1345.00, 1357.00, 1365.00, 1370.00


050419-XU-D.png


050419-XU-H1.png


*) For up-to-date and detailed analytics and news on the forex market visit Tifia Forex Broker website tifia.com
 
WTI: long positions are preferred

08/04/2019

Current dynamics


Against the background of increased geopolitical risks with oil supplies from a number of oil-producing countries, oil quotes rose sharply last week.

Even the US Department of Energy reports about a significant increase in oil reserves in the country last week, as well as a report by the American oilfield services company Baker Hughes, indicating an increase in active oil platforms in the United States to 831 units, could not stop the rise of the oil prices. Risks of oil supplies from Libya, where civil war rages, were added to the risks of restricting the supply of oil from Iran and Venezuela.

Investor expectations of a positive outcome of trade negotiations between the United States and China also contributed to the rise in oil prices. Last Friday, US President Donald Trump said that a compromise is possible with China to get out of the trade conflict.

Thus, last week, oil prices reached their next annual highs.

*)An advanced fundamental analysis is available on the Tifia Forex Broker website at tifia.com/analytics


On Friday, the price of Brent crude oil rose 1.7% to $ 70.90 a barrel, while WTI oil rose on Friday to $ 63.15 a barrel.

Despite the fact that on Monday the growth of prices stopped, a further increase in oil prices is likely.

The breakdown of the local resistance level of 63.50 (Fibonacci level of 61.8%) will create the prerequisites for further growth in the price of WTI crude oil.

Above key support levels of 59.00 (ЕМА200 on the daily chart), 59.50 (Fibonacci 50% of the upward correction to a fall from the highs of the past few years near 76.80 to the support level near 42.14) the long-term bullish trend remains.

Only a breakdown of support levels of 56.50 (ЕМА200 on the weekly chart), 55.40 (Fibonacci 38.2%) will revive the bearish trend.

While positive dynamics prevail, long positions are preferable.

Support Levels: 61.40, 59.50, 59.00, 56.50, 55.40

Resistance Levels: 63.50, 65.00, 66.00, 68.00


Trading scenarios


Sell Stop 61.30. Stop Loss 63.60. Take-Profit 61.00, 59.50, 59.00, 56.50, 55.40

Buy Stop 63.60. Stop Loss 61.30. Take-Profit 64.00, 65.00, 66.00, 68.00, 73.00

080419-WTI-D.png


080419-WTI-H1.png


*) For up-to-date and detailed analytics and news on the forex market visit Tifia Forex Broker website tifia.com
 
EUR/USD: on the eve of the ECB meeting

Current dynamics

09/04/2019


The Eurodollar is trading higher on Tuesday. On Wednesday, the next meeting of the ECB. According to many economists, it is not worth waiting for any decisive action by the leadership of the ECB. The ECB has already taken into account in its current policy downward risks for the growth of the European economy and inflation.

In March, the ECB has already taken some steps towards easing its monetary policy. Probably on Wednesday, ECB leaders can again discuss the details of the TLTRO.

However, an element of unexpected statements is still present in the market, which holds back the growth of the Eurodollar. ECB Head Mark Carney is able to turn back markets. Some of his previous statements moved the euro by 3-5% for the short time.

The Eurodollar is also weakly responding to the threat of the introduction of US import duties on European cars imported into the United States. On Tuesday, the White House administration proposed imposing duties on imports of goods from the EU in the amount of $ 11 billion in response to EU subsidies for Airbus. However, if the United States does impose import duties on cars imported from Europe, then the Eurozone economy can be dealt a significant blow, since the automotive industry is one of the key sectors of the European economy.

The ECB's decision on rates will be published on Wednesday (11:45 GMT), and at 12:30 the press conference of the ECB will begin. Any signals from the leadership of the ECB in favor of easing monetary policy will cause a sharp decline in the euro.

*)An advanced fundamental analysis is available on the Tifia Forex Broker website at tifia.com/analytics


On Tuesday, EUR / USD develops an upward trend, adjusting after a significant decline. Nevertheless, Eurodollar growth is constrained by strong levels of resistance

(Fibonacci level 23.6% of the correction to the fall from the level of 1.3900, which began in May 2014), 1.1290 (ЕМА200 on the 4-hour chart), 1.1300 (ЕМА50 on the daily chart).

Below these levels, short positions with targets located at support levels of 1.1210 (November lows), 1.1190 (March and year lows), 1.1120, 1.1000 are preferred.

If the ECB management on Wednesday make unexpected statements regarding monetary policy in the direction of its tightening, after the breakdown of the resistance level of 1.1300 EUR / USD will move to resistance levels of 1.1400 (ЕМА144), 1.1450 (ЕМА200 on the daily chart).

Support Levels: 1.1210, 1.1190, 1.1120, 1.1000

Resistance Levels: 1.1285, 1.1290, 1.1300, 1.1400, 1.1450


Trading recommendations


Sell in the market. Stop-Loss 1.1310. Take-Profit 1.1210, 1.1190, 1.1120

Buy Stop 1.1310. Stop Loss 1.1270. Take-Profit 1.1370, 1.1400, 1.1450

090419-EUD.png


090419-EUH4.png


*) For up-to-date and detailed analytics and news on the forex market visit Tifia Forex Broker website tifia.com
 
XAU/USD: the demand for gold is growing again

10/04/2019

Current Dynamics


In less than an hour, the ECB’s rate decision will be published. It is widely expected that the main interest rates of the ECB will remain at the same level of 0% and -0.4%, and the management of the ECB will again speak out in favor of maintaining a soft monetary policy.

At 16:00 (GMT) the EU summit dedicated to Brexit will begin. EU leaders during the summit will discuss the possibility of extending the UK exit from the block. The EU leaders are likely to give Britain more time.

At 18:00 (GMT), the minutes from the March meeting of the Federal Open Market Committee of the Fed will be published (“FOMC Minutes”).

Many economists expect US interest rates to remain unchanged in 2019 and to be reduced in 2020. This is a negative factor for the dollar and a positive one for gold quotes. The harsh rhetoric of Fed officials about the prospects for monetary policy will push the dollar to further growth, and gold prices may weaken. However, a significant drop in gold prices in the current environment (slowing global economy and rising political and trade tensions in the world) is also not expected.

*)An advanced fundamental analysis is available on the Tifia Forex Broker website at tifia.com/analytics


XAU / USD trades in a narrow range on the eve of important events, near the mark of 1306.00 dollars per ounce, above the short-term support levels of 1299.00 (EMA50 on the daily chart), 1301.00 (EMA200 on the 4-hour chart) and above the key support levels of 1277.00 (Fibonacci level 61, 8% of the correction to the wave of decline since July 2016), 1274.00 (EMA200 on the daily chart). Long term uptrend persists.

In the case of a breakdown of support levels of 1301.00, 1299.00, XAU / USD will decline in the direction of key support levels of 1277.00, 1274.00.

The XAU / USD growth targets are resistance levels of 1312.00, 1323.00, 1345.00 (highs of February and 2019).

Support Levels: 1301.00, 1299.00, 1285.00, 1277.00, 1274.00, 1266.00, 1248.00

Resistance Levels: 1312.00, 1323.00, 1345.00, 1357.00, 1365.00, 1370.00


Trading recommendations


Sell Stop 1298.00. Stop Loss 1308.00. Take-Profit 1285.00, 1277.00, 1274.00, 1266.00, 1248.00, 1234.00, 1220.00, 1197.00, 1185.00, 1160.00

Buy Stop 1308.00. Stop Loss 1298.00. Take-Profit 1312.00, 1323.00, 1345.00, 1357.00, 1365.00, 1370.00

100419-XU-W.png


100419-XU-D.png


100419-XU-H4.png


*) For up-to-date and detailed analytics and news on the forex market visit Tifia Forex Broker website tifia.com
 
EUR/USD: Trading Scenarios

11/04/2019


The soft rhetoric of the ECB leaders and their signals about the likelihood of easing of monetary policy, sounded on Wednesday, could not stop the growth of the Eurodollar. The EUR / USD pair has grown, mainly due to the weakening dollar. Fed leaders, according to the minutes of the March meeting of the American central bank, published on Wednesday, concerned about the slowdown in the global economy, which threatens to worsen the situation in the US economy. It follows from the protocols that the leaders of the central bank do not see the conditions for a further increase in interest rates.

*)An advanced fundamental analysis is available on the Tifia Forex Broker website at tifia.com/analytics


Having reached the level of 1.1190 at the beginning of the month (lows of March and 2019), EUR / USD turned "north" and continued to grow, up to the current European session.

Nevertheless, EUR / USD again failed to overcome the important resistance level of 1.1285 (Fibonacci level 23.6% of the correction to the fall from the level of 1.3900, which began in May 2014) and resumed its decline by the beginning of the American session.

A break of the short-term support level of 1.1255 (ЕМА200 on the 1-hour chart) will be a signal for the resumption of EUR / USD sales.

The growth scenario will be associated with fixing in the zone above the resistance level of 1.1300, which will create prerequisites for a stronger upward correction to resistance levels of 1.1395 (ЕМА144), 1.1450 (ЕМА200 on the daily chart).

Below resistance level 1.1285 short positions are preferable.

Support Levels: 1.1255, 1.1210, 1.1190, 1.1120, 1.1000

Resistance Levels: 1.1285, 1.1300, 1.1395, 1.1450


Trading recommendations


Sell in the market. Stop-Loss 1.1310. Take-Profit 1.1210, 1.1190, 1.1120

Buy Stop 1.1310. Stop Loss 1.1270. Take-Profit 1.1370, 1.1395, 1.1450

110419-DXY.png


110419-EU-D.png


110419-EU-H1.png


*) For up-to-date and detailed analytics and news on the forex market visit Tifia Forex Broker website tifia.com
 
AUD / USD: Current Dynamics

12/04/2019


Positive macro statistics from China contributes to the growth of commodity currencies and stock indices on Friday. AUD / USD traded at the beginning of the US trading session near the strong resistance level of 0.7170 (EMA144 on the daily chart) on a positive impulse received from the publication of strongly Chinese macro statistics.

In the event of a breakdown of this level, the next upside target for AUD / USD will be the key resistance level of 0.7217 (ЕМА200 on the daily chart), a rise above which is unlikely.

In the case of a rebound from the resistance level of 0.7170 and a return below the support level of 0.7127 (ЕМА200 on the 1-hour chart), short positions will again become relevant.

In this case, AUD / USD will go towards the support levels of 0.7025, 0.6980, 0.6910 (lows of September 2015), 0.6830 (lows of 2016).

Below resistance levels 0.7170, 0.7217 short positions are preferable. Long-term bearish trend persists.

Support Levels: 0.7140, 0.7127, 0.7112.0.7100, 0.7025, 0.6980

Resistance Levels: 0.7170, 0.7200, 0.7217, 0.7295


Trading recommendations


Sell in the market. Stop Loss 0.7220. Take-Profit 0.7140, 0.7127, 0.7112,0.7100, 0.7025, 0.6980

Buy Stop 0.7220. Stop Loss 0.7160. Take-Profit 0.7295

120419-AU-D.png


120419-AU-H1.png


*) For up-to-date and detailed analytics and news on the forex market visit Tifia Forex Broker website tifia.com
 
EUR/USD: Current dynamics

15/04/2019


The dollar fell by the end of last week. On Friday, the DXY dollar index closed with a 0.2% fall, at 96.97. According to the minutes of the March meeting of the American central bank, the Fed leaders are concerned about the slowdown in global economic growth, which threatens to worsen the situation in the US economy. It follows from the protocols that the leaders of the central bank do not see the conditions for a further increase in interest rates.

At the same time, US President Donald Trump reiterated his criticism of the Federal Reserve System, stating that "quantitative tightening was a murderer, the opposite should have been done". On Sunday, Trump tweeted that the economy and the stock market could have grown faster, "if the Fed had done its job properly".

On Monday, the dollar continues to decline, while DXY dollar index futures traded at the beginning of the European session near the 96.45 mark, 10 points lower than the opening price of the trading day.

On Monday, the publication of important macro data is not planned. Probably, trading in financial markets will be more relaxed than at the end of last week, which was full of important political and economic events.

Investors will also be less active on the eve of the Catholic Easter celebration this Sunday.

Meanwhile, the euro also remains under pressure after the ECB meeting last week. The ECB reported that the rate hikes before next year should not be expected, and the head of the European Central Bank, Mario Draghi, warned that the rate of economic growth in Europe this year will continue to decline. Mario Draghi last Wednesday signaled the possibility of implementing new measures to support the European economy in the event of a deterioration in its prospects.

*)An advanced fundamental analysis is available on the Tifia Forex Broker website at tifia.com/analytics


Trading scenarios

Against the background of the weakening dollar, the EUR / USD pair rose sharply last Friday, updating the 3-week high near the 1.1323 mark.

On Monday, the Eurodollar attempted to develop an upward movement, trading in the first half of the trading day above the support level of 1.1300 (EMA50 on the daily chart). Nevertheless, the Eurodollar failed to update the local and Friday maximum.

The OsMA and Stochastic indicators turned to short positions on the 4-hour and 1-hour charts.

Return under support level 1.1300 will be a signal for the resumption of short positions.

The breakdown of support levels of 1.1285 (Fibonacci level 23.6% of the correction to the fall from the level of 1.3900, which began in May 2014), 1.1270 (ЕМА200 per 1-hour chart) will confirm the scenario for the resumption of the EUR / USD decline.

The targets for reducing EUR / USD are at the support levels of 1.1210 (November lows), 1.1190 (March and year lows), 1.1120, 1.1000.

The growth scenario will be associated with the updating of the local maximum of 1.1323, which will create prerequisites for a stronger upward correction to the resistance levels of 1.1390 (EMA144), 1.1440 (EMA200 on the daily chart).

Support Levels: 1.1300, 1.1285, 1.1270, 1.1255, 1.1210, 1.1190, 1.1120, 1.1000

Resistance Levels: 1.1323, 1.1390, 1.1440


Trading recommendations


Sell in the market. Stop-Loss 1.1330. Take-Profit 1.1285, 1.1270, 1.1255, 1.1210, 1.1190, 1.1120, 1.1000

Buy Stop 1.1330. Stop Loss 1.1270. Take-Profit 1.1370, 1.1390, 1.1440

150419-DXY.png


150419-EU-D.png


150419-EU-H4.png


*) For up-to-date and detailed analytics and news on the forex market visit Tifia Forex Broker website tifia.com
 
AUD/USD: Support and Resistance Levels

16/04/2019


"The leadership of the central bank does not see any weighty arguments for adjusting monetary policy in the short term", says the RBA minutes, published Tuesday during the Asian session. After the publication of the minutes from the April meeting of the RBA, the Australian dollar weakened and the AUD / USD dropped by 30 points, to the level of 0.7142, through which the strong short-term support level passes (ЕМА200 on the 1-hour chart).

The indicators OsMA and Stochastic on the 1-hour, 4-hour charts turned to short positions. In the event of a breakdown of the support level of 0.7142, AUD / USD will move to the support level of 0.7120 (ЕМА200 on the 4-hour chart, ЕМА50 on the daily chart).

Break of this level will increase the risk of a return to the global bearish trend. In this case, AUD / USD will go towards the support levels of 0.7025, 0.6980, 0.6910 (lows of September 2015), 0.6830 (lows of 2016).

Below resistance levels 0.7170 (ЕМА144), 0.7217 (ЕМА200 on the daily chart) short positions are preferable.

*)An advanced fundamental analysis is available on the Tifia Forex Broker website at tifia.com/analytics


Support Levels: 0.7142, 0.7120, 0.7100, 0.7053, 0.7025, 0.6980

Resistance Levels: 0.7170, 0.7200, 0.7217, 0.7295


Trading Scenarios


Sell in the market. Stop Loss 0.7160. Take-Profit 0.7120, 0.7100, 0.7053, 0.7025, 0.6980

Buy Stop 0.7160. Stop Loss 0.7135. Take-Profit 0.7170, 0.7200, 0.7217

160419-DXY.png


160419-AU-D.png


160419-AU-H1.png


*) For up-to-date and detailed analytics and news on the forex market visit Tifia Forex Broker website tifia.com
 
USD/CAD: Market Expectations

17/04/2019


On Wednesday, commodity currencies strengthened against the US dollar against the backdrop of favorable statistics from China.

At 12:30 GMT Statistics Canada and the Bank of Canada will present data on foreign trade in Canada and data on inflation. Consumer prices in February rose by 1.5% (+ 1.4% in January) in annual terms and the base consumer price index rose by + 1.5%. If the data for March are worse than the previous values, then this will negatively affect the CAD. Data better than the forecast and above the previous values will strengthen the Canadian dollar.


Despite the current decline, USD / CAD maintains a long-term positive trend, trading above key support levels of 1.3260 (EMA144), 1.3210 (EMA200 on the daily chart).

USD / CAD declined during the Asian session, breaking short-term strong support levels of 1.3350 (ЕМА200 on the 1-hour chart), 1.3340 (ЕМА200 on the 4-hour chart).

The breakdown of the local support level of 1.3300 may increase the risks of further USD / CAD decline with targets at the support levels of 1.3260, 1.3210.

The signal for the resumption of purchases will be the return of USD / CAD to the zone above the levels of 1.3340, 1.3350 with growth targets at resistance levels of 1.3450 (Fibonacci 23.6% of the downward correction to the pair's growth in the global uptrend since September 2012 and 0.9700), 1.3660 ( the highs of 2018), 1.3790 (the highs of 2017).

Support Levels: 1.3320, 1.3340, 1.3300, 1.3260, 1.3210, 1.3155, 1.3090, 1.3045

Resistance Levels: 1.3340, 1.3350, 1.3370, 1.3400, 1.3450, 1.3600, 1.3660, 1.3790


Trading scenarios


Sell Stop 1.3290. Stop Loss 1.3340. Take-Profit 1.3245, 1.3200, 1.3155, 1.3090, 1.3045

Buy Stop 1.3340. Stop Loss 1.3290. Take-Profit 1.3370, 1.3450, 1.3600, 1.3660, 1.3790

170419-UCD-D.png


170419-UCD-H4.png


170419-UCD-H1.png


*) For up-to-date and detailed analytics and news on the forex market visit Tifia Forex Broker website tifia.com
 
EUR/USD: Current Dynamics

04/18/2019


Weak macro data from Europe and published at the beginning of the European session on Thursday caused a weakening of the Euro and a drop in the EUR / USD pair.

The preliminary PMI indexes for April were lower than expected. Eurozone production PMI was 47.8, which is below the forecast of 47.9. The compound PMI of the Eurozone was 51.3 against the forecast of 51.8.

The data presented increase the likelihood of further easing of the ECB’s monetary policy.


Having broken through a strong support level of 1.1285 (ЕМА200 on the 1-hour chart, as well as a Fibonacci level of 23.6% of the correction to the fall from the level of 1.3900, which began in May 2014), EUR / USD reached a week low near the 1.1243 mark. Breakdown of this local support level will cause further weakening of EUR / USD with targets located at support levels of 1.1210 (November lows), 1.1190 (March and year lows), 1.1120, 1.1000.

An alternative scenario will be associated with a return to the zone above the resistance level of 1.1300, which will create prerequisites for a stronger upward correction to the resistance levels of 1.1390 (EMA144), 1.1440 (EMA200 on the daily chart).

Short positions are preferred.

In the period from 12:30 to 14:00 GMT, important macro data from the US will be published, which will cause an increase in market volatility. Among the published data that should be noted are the preliminary PMI business indices in the USA for April, as well as data on retail sales. Data worse than the forecast will negatively affect the dollar, which will cause its sales and fixation of long positions on it before the long weekend, associated with the meeting of the Catholic Easter.


Support Levels: 1.1250, 1.1240, 1.1210, 1.1190, 1.1120, 1.1000

Resistance Levels: 1.1285, 1.1300, 1.1390, 1.1440


Trading recommendations


Sell Stop 1.1240. Stop Loss 1.1290. Take-Profit 1.1210, 1.1190, 1.1120, 1.1000

Buy Stop 1.1290. Stop Loss 1.1240. Take-Profit 1.1320, 1.1390, 1.1440

180419-DXY.png


180419-EU-D.png


180419-EU-H1.png


*) For up-to-date and detailed analytics and news on the forex market visit Tifia Forex Broker website tifia.com
 
Back
Top