Tifia Forex Broker Daily Market Analytics, Analytics and trading recommendations by Tifia Company

NZD/USD: dynamics and recommendations

08/15/2019


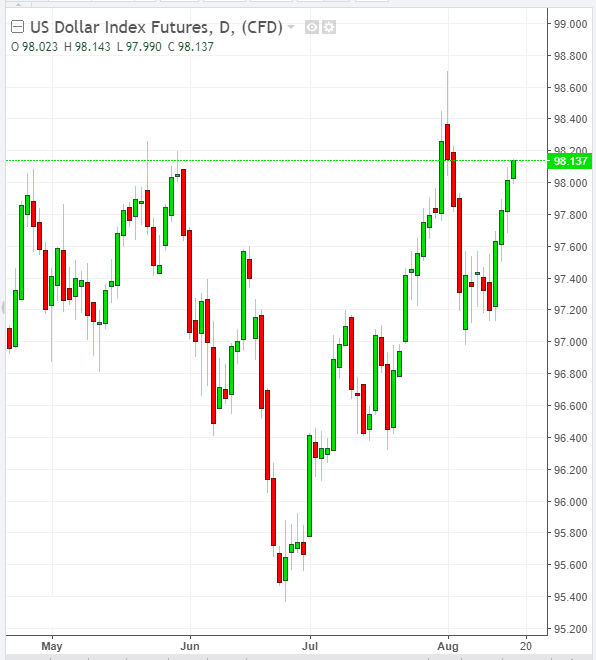
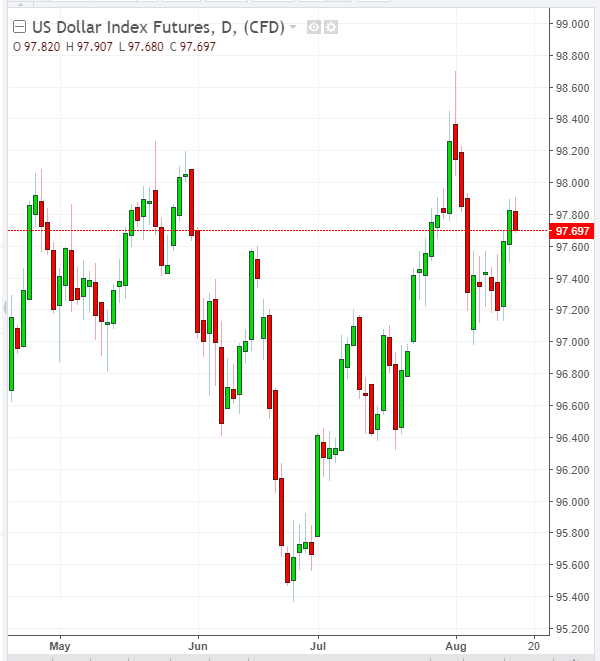
Since the opening of today's trading day, the American dollar has been declining. At the beginning of today's European session, DXY dollar index futures are trading near 97.70, 12 pips below the opening price of today's trading day. Meanwhile, commodity currencies, including the New Zealand dollar, also remain under pressure amid a worsening trade war between the US and China.

New Zealand's export-oriented economy is extremely vulnerable amid escalating trade war between the US and China.

Last week, the RBNZ cut the rate by 50 bp to 1.00%, explaining this decision by the worsening trade war between the US and China and the loss of momentum in the New Zealand economy.

RBNZ leaders believe that wage growth remains weak. At the same time, inflationary expectations are falling, and low levels of business confidence indicate a slowdown in hiring and wage growth.

There is growing concern among participants in international financial markets that the slowdown in economic growth and the threat of recession will spread to the whole world, including China, the United States, and their trade and economic partners. It can be assumed that the global cycle of rate cuts will gain momentum in the next few months.

In the current situation, further easing of the monetary policy of the RB of New Zealand should be expected, which is a strong negative factor for NZD.

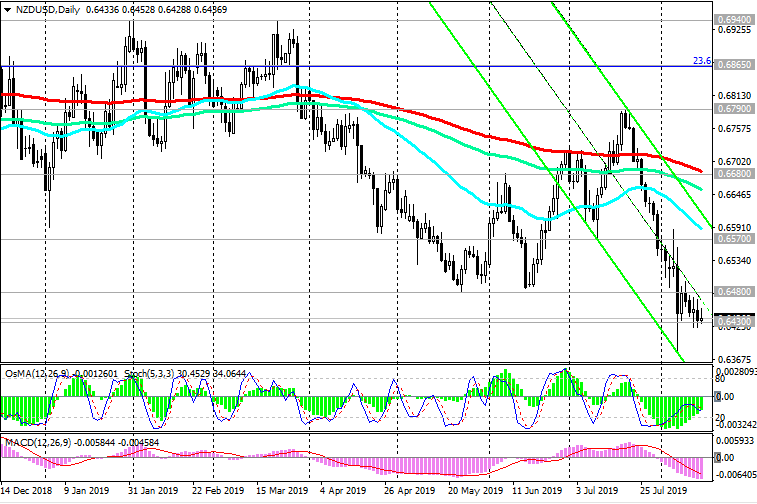
Currently, NZD / USD is trading near the level and the local support level of 0.6430 (October 2018 lows).

A breakdown of this level will provoke a further decrease in NZD / USD with targets at support levels of 0.6400, 0.6300, 0.6260 (Fibonacci level of 0% and minimums of the global wave of pair decline from the level of 0.8820).

Short positions are preferable, unless, of course, the Fed also begins to aggressively lower the interest rate amid ongoing events in the financial markets.

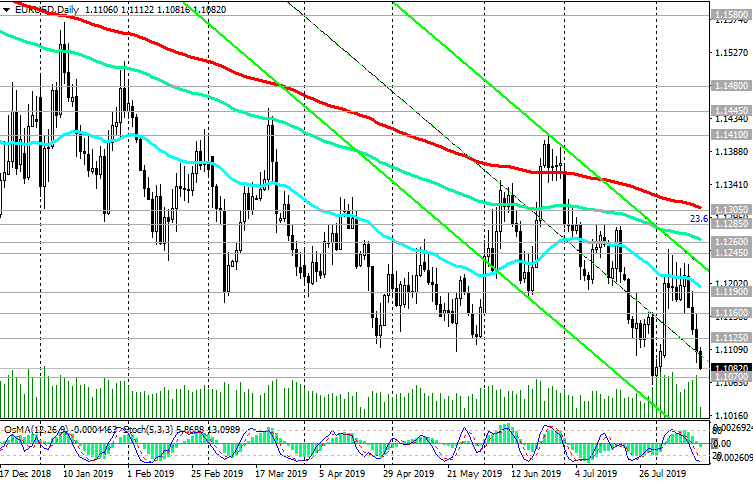
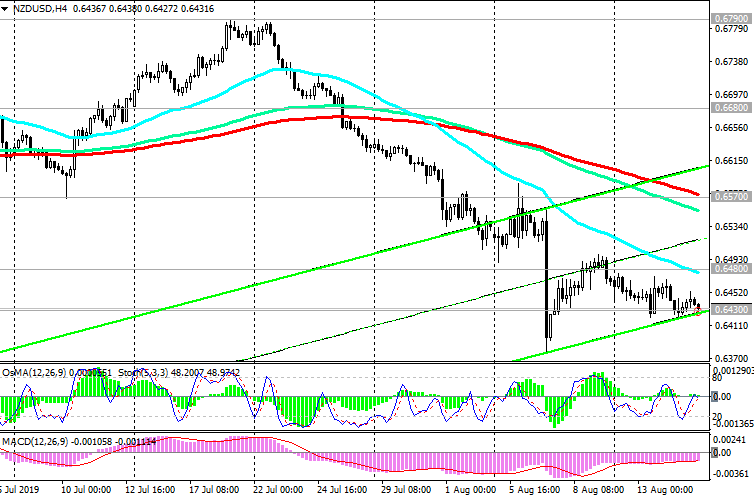
Below the resistance level of 0.6680 (ЕМА200 on the daily chart), the bearish trend NZD / USD prevails.

Support Levels: 0.6430, 0.6400, 0.6300, 0.6260

Resistance Levels: 0.6480, 0.6570, 0.6635, 0.6680, 0.6700, 0.6790


Trading Scenarios


Sell by market. Stop-Loss 0.6490. Take-Profit 0.6400, 0.6300, 0.6260

Buy Stop 0.6510. Stop-Loss 0.6460. Take-Profit 0.6570, 0.6600, 0.6680

150819-DXY.png


150819-NU-D.png


150819-NU-H4.png


*) For up-to-date and detailed analytics and news on the forex market visit Tifia Forex Broker website tifia.com
 
EUR/USD: Current dynamics and recommendations

08/16/2019


With the opening of today's trading day, Eurodollar is again declining. Market participants are preparing for the next ECB meeting in September and new stimulus measures by the European Central Bank.

According to Olli Rehn, member of the ECB Governing Council, the European Central Bank at its meeting in September will announce a substantial stimulus package that will exceed investor expectations.

The ECB is likely to announce a 0.1% reduction in the key interest rate, which is now -0.4%, as well as an allocation of about 50 billion euros per month for additional bond purchases under the quantitative easing program.

Published disappointing economic data from China and Germany this week, as well as positive macro data from the United States, made market participants even more doubt the prospects for global economic growth, and also again updated the attractiveness of American assets and a more stable state of the US economy.

According to official data released on Thursday, US retail sales in July rose 0.7% (forecast was + 0.3%).

Retail sales data are encouraging regarding the US economy, that remains demand for US assets and the dollar.

Today (at 14:00 GMT) the University of Michigan consumer confidence index (preliminary release for August) will be published, which reflects the confidence of American consumers in the country's economic development. It is expected that this indicator will come out in August with a value of 97.7 (against 98.4 in July), which could negatively affect the dollar (in the short term) due to a relative decrease in the indicator. Data better than expected will certainly support the dollar, and will put additional pressure on EUR / USD.

Below the resistance levels of 1.1305 (ЕМА200 on the daily chart), 1.1285 (Fibonacci level 23.6% of the correction to the fall from the level of 1.3900, which began in May 2014), long-term negative dynamics persist. In the current situation, short positions look relevant and safer, and the reduction targets are located at support levels 1.1000, 1.0000.

You can return to purchases as part of the corrective growth of EUR / USD only after fixing the price in the zone above the short-term resistance level of 1.1160 (ЕМА200 on the 1-hour chart).

Support Levels: 1.1070, 1.1000, 1.0000

Resistance Levels: 1.1125, 1.1160, 1.1190, 1.1245, 1.1260, 1.1285, 1.1305


Trading Recommendations


Sell by market. Stop-Loss 1.1130. Take-Profit 1.1070, 1.1000, 1.0000

Buy Stop 1.1130. Stop-Loss 1.1060. Take-Profit 1.1160, 1.1190, 1.1245, 1.1260, 1.1285

160819-DXY.png


160819-EU-D.png


160819-EU-H1.png


*) For up-to-date and detailed analytics and news on the forex market visit Tifia Forex Broker website tifia.com
 
S&P500: Current Dynamics and Recommendations

Expectations of a softening of the monetary policy of the Fed and positive macro statistics coming from the United States, contributed to the growth of major US stock indexes last month to new heights.

The S&P500 index updated a record high near 3028.0, however, subsequently collapsed amid Trump's threats to introduce new duties on Chinese goods from September 1.

S&P500 last week again tested the key support level of 2848.0 (EMA200 on the daily chart), dropping to around 2815.0.

Nevertheless, investors are gradually becoming more active after recent events related to the aggravation of the trade conflict between the USA and China.

At the beginning of the new week, gold quotes and yield on US government bonds are declining.

Investors are encouraged by the prospect of new incentive measures by the Central Banks in several countries with the largest economies.

Last week, the White House administration decided to postpone plans to introduce a new 10% duty on some Chinese goods worth $ 156 billion, which was due to take effect on September 1. In addition, the White House said that they are preparing the next round of negotiations.

Since the opening of today's trading day, the S&P500 has been growing, and for the third day in a row.

Above the support levels of 2848.0 (ЕМА200 on the daily chart), 2865.0 (Fibonacci level 23.6% of the correction to the growth since December 2018 and the level of 2335.0), the S&P500 long-term bullish trend remains.

After the breakdown of the resistance level of 2927.0 (EMA50 on the daily chart and EMA200 on the 4-hour chart), the S&P500 will continue to move towards recent highs near 3028.0.

Support Levels: 2900.0, 2892.0, 2865.0, 2848.0, 2765.0, 2730. 2680.0

Resistance Levels: 2927.0, 2965.0, 3000.0, 3028.0


Trading Recommendations


Sell Stop 2888.0. Stop-Loss 2929.0. Goals 2865.0, 2848.0

Buy Stop 2929.0. Stop-Loss 2888.0. Goals 2965.0, 3000.0, 3028.0, 3100.0, 3200.0

190819-s500-D.png


190819-s500-H4.png


190819-s500-H1.png


*) For up-to-date and detailed analytics and news on the forex market visit Tifia Forex Broker website tifia.com
 
GBP/USD: downward trend prevails

08/20/2019


Amid the risks to the British economy, the GBP / USD resumed falling due to the increased likelihood of a “hard” Brexit. Economists and government officials warn that a tough Brexit will negatively impact the economy.

Boris Johnson, who succeeded Theresa May as a prime minister, said he was ready for a "hard" Brexit. On October 31, Great Britain must finally withdraw from the EU, even if no agreement is reached between the parties. In his view, "the exit agreement is dead and should be canceled, but there is the possibility of a new deal".

Boris Johnson is scheduled to meet with EU leaders this week. Probably, following the results of these meetings, new negative news for the pound will appear. The UK government reiterates its intention to withdraw the country from the bloc by October 31, and the EU does not intend to revise the earlier exit agreement.

Labor leader Jeremy Corbin has called on various parties to vote no confidence in Prime Minister Boris Johnson in order to remove him from his post and make Brexit possible to a later date.

Nevertheless, the efforts of Jeremy Corbin to prevent a hard Brexit so far have little effect on the dynamics of the pound. Investors are preparing for the worst scenario.

Long-term negative dynamics prevail. The immediate goal of the decline is the support level of 1.2000 (2017 lows and the Fibonacci level 0% of a correction to the GBP / USD decline in a wave that began in July 2014 near the level of 1.7200).

We can return to the consideration of long positions only after the pair will grow into the zone above the resistance level of 1.2280 (ЕМА200 on the 4-hour chart and the upper line of the downward channel on the daily chart).

However, growth above the local resistance levels of 1.2480, 1.2530 is unlikely. In the current situation, so far only short positions on the GBP / USD should be considered.

Support Levels: 1.2000

Resistance Levels: 1.2120, 1.2210, 1.2280, 1.2480, 1.2530, 1.2740


Trading Scenarios


Sell by market. Stop-Loss 1.2180. Take-Profit 1.2000, 1.1900

Buy Stop 1.2180. Stop-Loss 1.2080. Take-Profit 1.2210, 1.2280, 1.2480, 1.2530

200819-GU-D.png


200819-GU-H4.png


200819-GU-H1.png


*) For up-to-date and detailed analytics and news on the forex market visit Tifia Forex Broker website tifia.com
 
USD/CAD: positive dynamics continues

08/21/2019

Current Dynamics


On Wednesday (at 18:00 GMT) the minutes of the July meeting of the Fed will be published, which may indicate a further path for the development of monetary policy in the United States. Investors expect from the Fed additional signals regarding the prospects of monetary policy. Many economists and market participants expect that Fed rates by the end of the year will be below the current level of 2.25%. Today it is the highest rate among the 8 largest world central banks.

Second on this list is the Bank of Canada. In July, the Bank of Canada left the target value of the one-day interest rate unchanged at 1.75%.

The next meeting of the Bank of Canada on monetary policy is scheduled for September 4. Market participants will pay attention to the publication, on Wednesday at 12:30 (GMT), of the inflationary consumer price indices in Canada, which reflect the dynamics of retail prices in the corresponding basket of goods and services. The target inflation rate for the Bank of Canada is in the range of 1% -3%. The increase in CPI is a harbinger of a rate increase and a positive factor for CAD. If the data for July is worse than the previous values, then this will negatively affect CAD. Data is better than expected and above the previous values will strengthen the Canadian dollar. In this case, USD / CAD will decline.


At the beginning of the European session on Wednesday, the USD / CAD pair is trading at 1.3300,

near the short-term support level of 1.3284 (ЕМА200 on the 1-hour chart).

A breakdown of this level will provoke a further decrease in the framework of the downward correction with targets at support levels 1.3245, 1.3230 (ЕМА200 on the 4-hour chart).

The breakdown of these levels will trigger a further decline in the medium-term bearish trend with targets at support levels 1.3020, 1.2880 (ЕМА200 on the weekly chart).

Above the key support level of 1.3245 (ЕМА200 on the daily chart), the long-term positive dynamics of USD / CAD prevails. Long positions with targets at resistance levels 1.3435, 1.3452 (Fibonacci level 23.6% of the downward correction to the pair's growth in the global uptrend since September 2012 and the level of 0.9700), 1.3465, 1.3520, 1.3560 (maximums of the year) are preferable.

Support Levels: 1.3284, 1.3245, 1.3230, 1.3185, 1.3020, 1.2975, 1.2880

Resistance Levels: 1.3345, 1.3435, 1.3452, 1.3465, 1.3520, 1.3560, 1.3600, 1.3660


Trading Scenarios


Sell Stop 1.3275. Stop-Loss 1.3350. Take-Profit 1.3245, 1.3230

Buy Stop 1.3350. Stop-Loss 1.3275. Take-Profit 1.3400, 1.3435, 1.3452, 1.3465, 1.3520, 1.3560, 1.3600, 1.3660

210819-UC-D.png


210819-UC-H1.png


*) For up-to-date and detailed analytics and news on the forex market visit Tifia Forex Broker website tifia.com
 
EUR/USD: negative dynamics prevail

08/22/2019


Expectations of further easing of the monetary policy of the ECB put pressure on the euro and the pair EUR / USD. Eurodollar strengthened at the beginning of today's European session after the publication of positive macro statistics from the Eurozone.

The preliminary German manufacturing purchasing managers' index (PMI) in August was 43.6 (against the forecast of 43.0 and 43.2 in July). A similar index in France was also better than forecast (51.0 against the forecast of 49.5 and 49.7 in July).

The pair EUR / USD reached an intraday maximum near 1.1113, but then fell again, moving to negative territory.

Despite the fact that the data were better than predicted, the German economy in August continues to slow down. "Despite some improvement, production data did not grow enough to avert the threat of another small drop in GDP in the 3rd quarter, especially given the deterioration of leading indicators", IHS Markit said.

In the current situation, short positions are preferred, and the reduction targets are located at support levels of 1.1000, 1.0000.

Below the resistance levels of 1.1300 (EMA200 on the daily chart), 1.1285 (Fibonacci level 23.6% of the correction to the fall from the level of 1.3900, which began in May 2014), long-term negative dynamics persist.

Support Levels: 1.1070, 1.1000, 1.0000

Resistance Levels: 1.1117, 1.1165, 1.1185, 1.1245, 1.1285, 1.1300


Trading Recommendations


Sell by market. Stop-Loss 1.1125. Take-Profit 1.1070, 1.1000, 1.0000

Buy Stop 1.1125. Stop-Loss 1.1060. Take-Profit 1.1165, 1.1185

220819-EU-D.png


220819-EU-H4.png


220819-EU-H1.png


*) For up-to-date and detailed analytics and news on the forex market visit Tifia Forex Broker website tifia.com
 
GBP/USD: short positions are still preferred

08/23/2019


Statements by Fed Chancellor Angela Merkel that the EU and the UK could come to an agreement on Brexit by October 31 have caused the pound to strengthen and the GBP / USD pair to rise to 1.2273, which corresponds to a 3-week high.

However, on Friday, the decline in the pound and GBP / USD pair resumed. Investors are still betting on the further weakening of the pound, since the risks of the “hard” Brexit remain.

“We are ready” for the hard Brexit scenario, French President Macron reiterated, while Boris Johnson said that Britain is also intensely preparing to leave the EU without any agreement.

Meanwhile, investors expect the beginning (at 14:00 GMT) of the speech of the head of the Fed Jerome Powell at the symposium in Jackson Hole. Market participants want to understand the Fed's future plans for monetary policy.

Several Fed leaders, as follows from the minutes of the July 30-31 meeting, believe that rates should be left unchanged because "the real economy remains in good shape".

Despite conflicting signals from the Fed management, many market participants still expect one or two more Fed rate cuts this year, and the first reduction is already at the Fed meeting on September 17-18.

The long-term negative dynamics of GBP / USD prevails. In case of breakdown of the short-term support level 1.2150 (ЕМА200 on the 1-hour chart) GBP / USD will go towards the support level 1.2000 (2017 lows and the Fibonacci level 0% of the correction to the GBP / USD pair decline in a wave that began in July 2014 near the level 1.7200).

Short positions are preferred.

Support Levels: 1.2175, 1.2150, 1.2100, 1.2000

Resistance Levels: 1.2265, 1.2340, 1.2480, 1.2530, 1.2730


Trading Scenarios


Sell by market. Stop-Loss 1.2280. Take-Profit 1.2175, 1.2150, 1.2100, 1.2000

Buy Stop 1.2280. Stop-Loss 1.2190. Take-Profit 1.2340, 1.2480, 1.2530, 1.2730

230819-GU-D.png


230819-GU-H1.png


*) For up-to-date and detailed analytics and news on the forex market visit Tifia Forex Broker website tifia.com
 
DJIA: a new strong drop in indices

08/26/2019


Last month, the DJIA updated its absolute and annual maximum near the 27400.0 mark on expectations of a softer Fed monetary policy. Earlier, Trump has repeatedly criticized the Fed and called for lowering the interest rate by 1% at once, saying that this will accelerate growth in the stock market and support American producers.

The Fed lowered the rate by 0.25% at the end of July, however, stock markets reacted with restraint to this news, as many investors expected a rate cut by 0.50%.

However, stock indices, including DJIA, plummeted after Trump tweeted about the introduction of new 10% duties on Chinese goods from September 1.

August turned out to be extremely volatile. Fears of a slowdown in the global economy and further escalation of international trade conflicts do not leave investors.

Last Friday, global stock indices collapsed after China announced the introduction of duties on US goods worth $ 75 billion, and Donald Trump announced a response to this step of China.

On Monday, markets recovered some of the losses previously sustained after China Vice Premier Liu He said he wanted to resolve trade issues with the United States.

Market participants continue to follow any comments by the US and Chinese authorities regarding trade negotiations.

The deterioration of prospects in this direction may again bring down stock indices. Conversely, a warming or easing in trade disputes between the US and China will support stock indices.

The return of the DJIA to the zone above the resistance level of 26330.0 (EMA200 on the 4-hour chart, EMA50 on the daily chart and local maximums) will indicate a recovery in the bull trend and the resumption of purchases.

Nevertheless, the OsMA and Stochastic indicators on the 4-hour, daily, weekly charts are still on the side of the sellers. Shopping is still premature.

Support Levels: 25270.0, 24600.0

Resistance Levels: 26030.0, 26100.0, 26330.0, 26700.0, 27000.0, 27400.0


Trading Scenarios


Buy Stop 26500.0. Stop-Loss 25800.0. Take-Profit 27000.0, 27400.0, 27500.0

Sell Stop 25600.0. Stop-Loss 26100.0. Take-Profit 25300.0, 24600.0

260819-DJIA-D.png


260819-DJIA-H4.png


260819-DJIA-H1.png


*) For up-to-date and detailed analytics and news on the forex market visit Tifia Forex Broker website tifia.com
 
GBP/USD: Current Dynamics

08/27/2019


Last Thursday, the pound strengthened sharply, while the GBP / USD pair reached an intraday and 3-week high near 1.2273. The pound was strengthened by statements by Fed Chancellor Angela Merkel that the EU and Britain could come to an agreement on Brexit by October 31. Earlier media reported that Merkel invited Britain to find a solution to the Irish problem within 30 days.

Optimism regarding the prospect of an agreement on Brexit after negotiations between British Prime Minister Boris Johnson and the heads of Germany and France caused the pound to rise late last week.

However, economists have warned that the growth of the pound "has no fundamental justification".

At the Jackson Hole summit, Bank of England head Mark Carney said the UK’s prospects "depend on the timing and nature of Brexit".

The risks of the “hard” Brexit are high. On October 31, Great Britain will withdraw from the EU with or without an agreement.

This creates the prerequisites for the resumption of the weakening of the pound and the fall of the pair GBP / USD.

There are no important macro data today. The focus of the traders will be the speeches of two representatives of central banks. From the vice president of the European Central Bank, Luis de Gindos, investors are waiting for signals to approve stimulus measures at the September meeting. Earlier in August, ECB board member Olli Rehn said markets could count on a “very serious set of measures”.

The second speaker (at 12:00 GMT), Bank of England representative Sylvanas Tenreiro, can talk about how interest rate policy will depend on the course of negotiations on Brexit.

At the beginning of the European session on Tuesday, the GBP / USD pair is trading at an important resistance level of 1.2265 (EMA200 on the 4-hour chart).

A breakdown of the local resistance level of 1.2292 may trigger further growth of GBP / USD with the target at the resistance level of 1.2340 (ЕМА50 on the daily chart).

In any case, an increase above the resistance levels of 1.2480, 1.2530 is unlikely.

A signal for the resumption of sales may be a breakdown of the short-term support level of 1.2185 (ЕМА200 on the 1-hour chart).

The immediate goal of the decline is the support level of 1.2000 (2017 lows and the Fibonacci level 0% of a correction to the GBP / USD pair decline in a wave that began in July 2014 near the level of 1.7200).

Long-term negative dynamics prevail. Short positions are preferred.

Support Levels: 1.2210, 1.2185, 1.2150, 1.2100, 1.2000

Resistance Levels: 1.2265, 1.2292, 1.2340, 1.2480, 1.2530, 1.2730


Trading Scenarios


Sell by market. Stop-Loss 1.2310. Take-Profit 1.2175, 1.2150, 1.2100, 1.2000

Buy Stop 1.2310. Stop-Loss 1.2190. Take-Profit 1.2340, 1.2480, 1.2530

270819-GU-D.png


270819-GU-H4.png


270819-GU-H1.png


*) For up-to-date and detailed analytics and news on the forex market visit Tifia Forex Broker website tifia.com
 
XAU/USD: demand for precious metals remains

08/28/2019


Precious metals continue to grow in price. Gold futures closed on Tuesday at their highest level since 2013, and silver futures reached a maximum of closure in more than 3 years. Rising prices for these precious metals is promoted by both a weakening dollar due to expectations of further easing of the Fed's monetary policy and a decrease in the US stock market due to continuing concerns about a slowdown in the global economy and the negative effects of the trade conflict between the US and China.

Back on Friday, when China announced the introduction of import duties on goods from the United States in the amount of 5% or 10% worth about 75 billion dollars, US President Donald Trump announced his intention to increase all existing and planned duties by 5%. This means that Chinese goods worth $ 250 billion will now be taxed at 30%, and new duties on goods worth $ 130 billion will be 15%, not 10%.

On Monday, Trump spoke about the prospects for US-Chinese trade relations in a conciliatory tone, and Chinese Deputy Prime Minister Liu He expressed a desire to resolve trade disputes with the United States.

Nevertheless, the conclusion of a trade agreement between the two countries is very far away. It is possible that Beijing will take a "wait and see" attitude before the election of the new US president in 2020.

December gold futures rose Tuesday at COMEX by $ 14.60, or 1%, to $ 1551.80 an ounce. This is the highest closing level for the most actively trading futures since April 2013.

On Wednesday, gold is trading in a range near recent highs. At the beginning of the European trading session on Wednesday, a troy ounce of gold costs $1542.50.

In the current situation, the demand for protective assets, including gold, will continue. With any correctional decline of the XAU / USD pair, should enter long positions. The most suitable places for this are the support levels of 1495.00 (the bottom line of the ascending channel on the daily chart and local lows), 1485.00 (Fibonacci level 50% of the correction to the wave of decline since September 2011 and the level of 1920.00), 1474.00 (line of the 200-period moving average on 4-hour chart).

For more aggressive purchases, current levels are suitable, as well as a support level of 1517.00 (EMA200 on a 1-hour chart).

The fundamental background creates the prerequisites for maintaining the demand for gold and the further growth of XAU / USD. With the easing of the monetary policy of the Fed and other major global central banks, as well as amid geopolitical and trade tensions, demand for gold will grow.

So far, a strong positive momentum prevails. Above the support levels of 1474.00, 1485.00, long positions are preferred.

Only a breakdown of key support levels of 1354.00 (EMA200 on the daily chart), 1290.00 (EMA200 on the weekly chart) will resume the bearish trend, which began in 2012 near the mark of 1795.00.

Support Levels: 1517.00, 1495.00, 1485.00, 1474.00, 1452.00, 1440.00, 1413.00, 1380.00, 1354.00, 1290.00

Resistance Levels: 1555.00, 1585.00


Trading Recommendations


Sell Stop 1515.00. Stop-Loss 1556.00. Take-Profit 1495.00, 1485.00, 1474.00, 1452.00

Buy Stop 1556.00. Stop-Loss 1515.00. Take-Profit 1585.00, 1600.00

280819-XU-D.png


280819-XU-H4.png


*) For up-to-date and detailed analytics and news on the forex market visit Tifia Forex Broker website tifia.com
 
Back
Top