Tifia Forex Broker Daily Market Analytics, Analytics and trading recommendations by Tifia Company

EUR/USD: Current Dynamics

08/29/2019


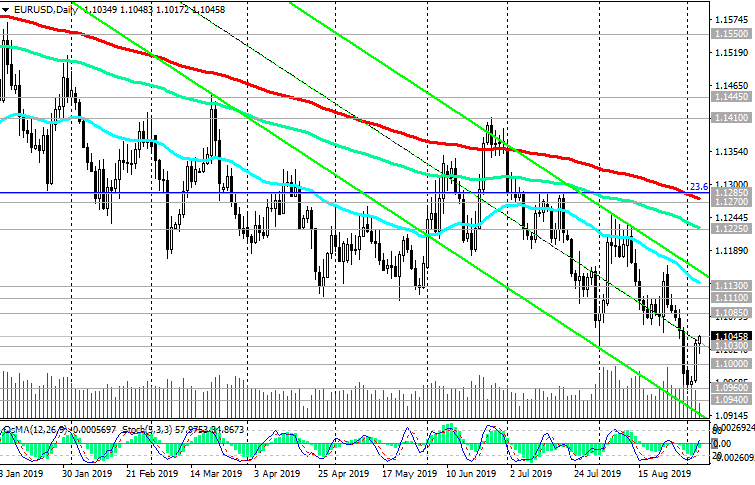
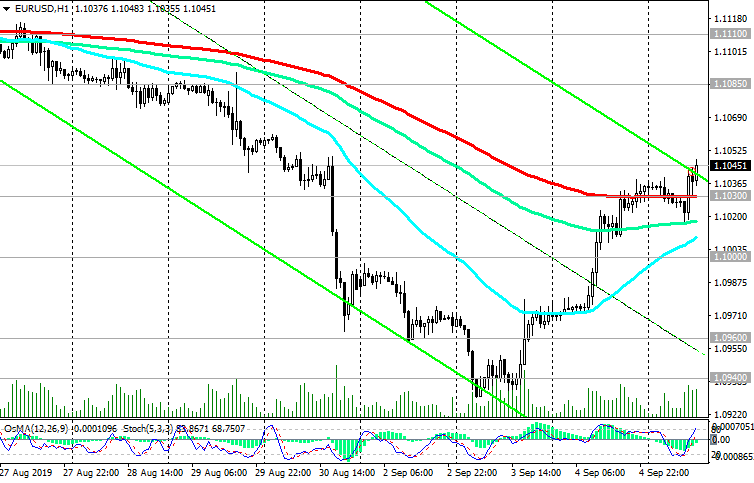
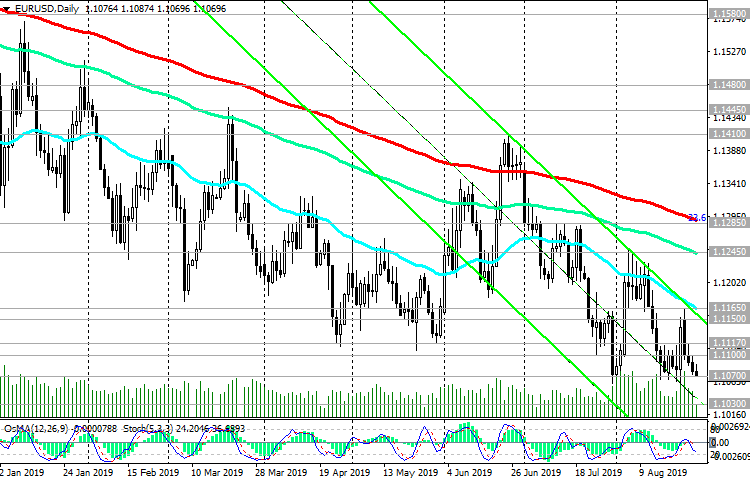
On Thursday, the EUR / USD pair is trading in the range near the local support level and the mark of 1.1070. The euro remains under pressure in anticipation of a significant easing of monetary policy at the ECB meeting on September 12. Olli Rehn, a member of the ECB's Governing Council, said in the middle of the month that the European Central Bank will announce a substantial stimulus package in September that will exceed investors' expectations.

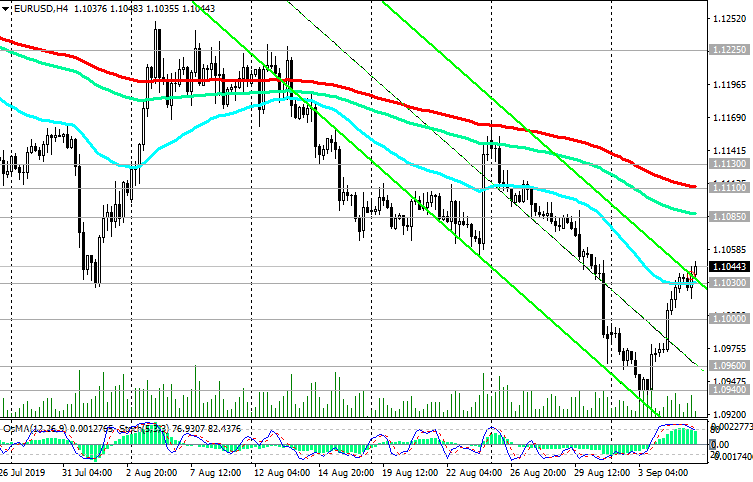
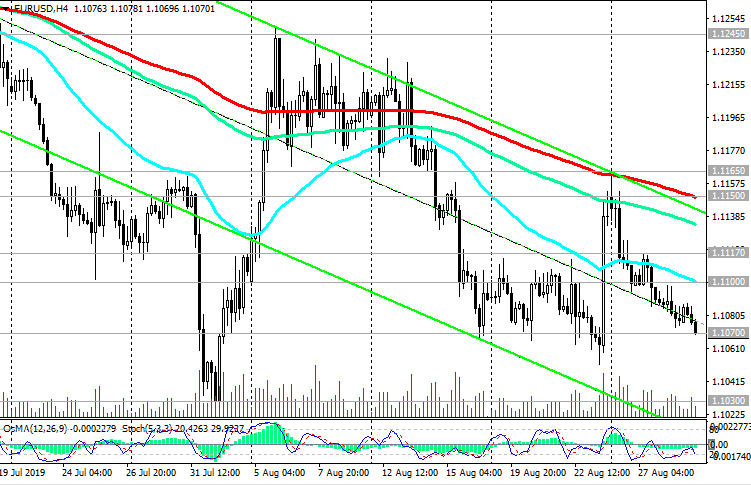
OsMA and Stochastic indicators on the 4-hour, daily, weekly charts recommend short positions, confirming the prevalence of downward dynamics.

The immediate goals in the event of a further decrease in EUR / USD will be the support levels of 1.1030 (local minimum), 1.1000.

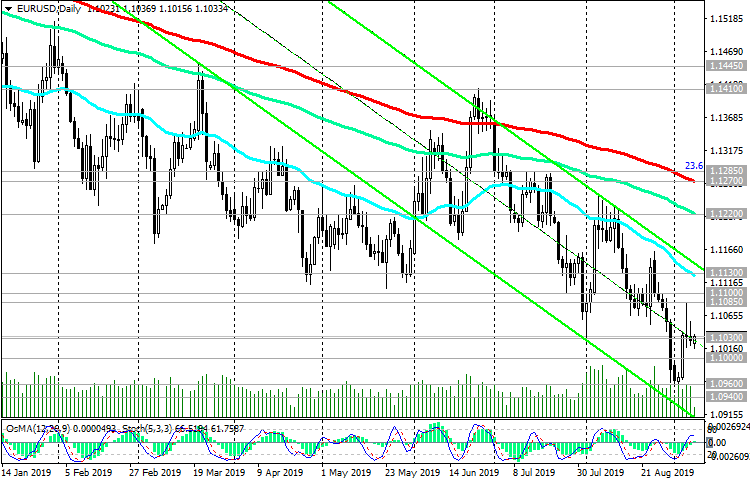
In an alternative scenario, a breakdown of the short-term resistance level of 1.1110 (ЕМА200 on a 1-hour chart) may become a signal to start an upward correction. The target is located at resistance levels 1.1150 (ЕМА200 on the 4-hour chart and the upper line of the descending channel on the daily chart), 1.1165 (local maximums and ЕМА50 on the daily chart).

However, this is an unlikely scenario. In the current situation, short positions are preferred.

At 12:00 (GMT) inflation indicators in Germany will be published. Recent data indicate weak inflationary pressures in Germany.

Forecast for August (preliminary estimate): + 1.2%. The growth of the Harmonized Consumer Price Index (HICP) is a positive factor for the euro. If the data for August turn out to be worse than the forecast or the previous value (+ 1.1%), then the euro will be under additional negative pressure.

Support Levels: 1.1070, 1.1030, 1.1000

Resistance Levels: 1.1100, 1.1117, 1.1150, 1.1165, 1.1200, 1.1245, 1.1285


Trading Recommendations


Sell by market. Stop-Loss 1.1120. Take-Profit 1.1030, 1.1000

Buy Stop 1.1120. Stop-Loss 1.1060. Take-Profit 1.1150, 1.1165, 1.1200, 1.1245

290819-EU-D.png


290819-EU-H4.png


*) For up-to-date and detailed analytics and news on the forex market visit Tifia Forex Broker website tifia.com
 
USD/CAD: Current Dynamics

08/30/2019


At the beginning of the European session on Friday, USD / CAD is trading at a short-term support level of 1.3290 (ЕМА200 on the 1-hour chart).

In the event of a breakdown of this support level and the development of a downward correction, USD / CAD may decrease to the support level of 1.3250 (ЕМА200 on the 4-hour chart, ЕМА200 on the daily chart).

Nevertheless, above this support level, long-term positive dynamics prevail. After the breakdown of the local resistance level of 1.3345 (August highs) USD / CAD will go towards the local resistance levels 1.3435, 1.3452 (Fibonacci level 23.6% of the downward correction to the pair's growth in the global uptrend since September 2012 and the level of 0.9700), 1.3465, 1.3520, 1.3560 (highs of the year).

Only a breakdown of the key support level 1.3250 and the local support level 1.3230 can trigger a further decline with targets at support levels 1.3020, 1.2880 (ЕМА200 on the weekly chart).

In general, the US dollar maintains a positive trend, and above the 1.3300 mark, long USD / CAD positions are preferred.

Futures on the DXY dollar index is trading at the beginning of the European session on Friday near 98.50, 11 points above the opening price of today's trading day. The growth for the week at the moment is already + 0.98%, which allows the DXY index to remain in positive territory by the results of the month.

From the news today, we are waiting for the publication (at 12:30 GMT) of a whole block of important macro statistics for Canada (Canadian GDP for June and for the 2nd quarter) and the United States (index of personal spending and personal consumption spending of Americans for July).

In view of the importance of the data published at 12:30 (GMT), one should be prepared for the growth of volatility in the USD / CAD pair during this period of time.

Support Levels: 1.3290, 1.3250, 1.3230, 1.3185, 1.3115, 1.3020, 1.2975, 1.2880

Resistance Levels: 1.3345, 1.3435, 1.3452, 1.3465, 1.3520, 1.3560, 1.3600, 1.3660


Trading Scenarios


Sell Stop 1.3265. Stop-Loss 1.3325. Take-Profit 1.3250, 1.3230, 1.3185, 1.3115, 1.3020, 1.2975, 1.2880

Buy Stop 1.3325. Stop-Loss 1.3265. Take-Profit 1.3345, 1.3435, 1.3452, 1.3465, 1.3520, 1.3560, 1.3600

300819-DXY.png


300819-UC-D.png


300819-UC-H1.png


*) For up-to-date and detailed analytics and news on the forex market visit Tifia Forex Broker website tifia.com
 
AUD/USD: Current dynamics and recommendations

09/02/2019


On Tuesday, the next meeting of the RB of Australia will be devoted to issues of monetary policy. The decision on the interest rate will be published at 04:30 (GMT).

On the eve of this event last Sunday, new duties on the import of Chinese goods into the United States entered into force. Fee of 15% on a number of goods used mainly in everyday life will be approximately 110-115 billion US dollars, according to economists.

The escalation of tension in US-Chinese trade relations overshadows the economic prospects of not only the United States and China, but also other countries, especially their trading partners. This contributes to growing expectations that the world's largest central banks will continue to soften their monetary policy.

At a previous meeting in August, the RBA left the key interest rate at a record low of 1%, but gave a pessimistic forecast for the economy. RBA managing director Philip Lowe lowered the forecast for Australia's GDP growth in 2019 to 2.5% from 2.75% and added that unemployment is expected to drop to about 5% in the next two years. According to the RBA management, for the growth of salaries and acceleration of inflation to the target range, an unemployment rate of 4.5% or lower is required. Now unemployment is above the 5% level and is gradually growing, but not decreasing, and the return of inflation to the middle of the target range of 2% -3% is not visible even on a distant horizon.

"It is reasonable to expect that a long period of low interest rates will be required for progress towards lowering unemployment and achieving steady progress towards the target inflation rate," Lowe said after an RBA meeting in August.

Probably, at a meeting on Tuesday, the RBA will not yet begin to change the interest rate, but signal such a decrease towards the end of the year.

If Lowe declares this, then the Australian dollar will again be under pressure, and the pair AUD / USD will continue to decline.

Today is a day off in the USA (Labor Day). US banks and exchanges will be closed. In this regard, trading volumes during the US trading session will be insignificant.

Meanwhile, AUD / USD has been declining since the opening of today. At the beginning of the European session on Monday, the pair AUD / USD is trading near the level of 0.6720. Negative dynamics prevails. The objectives of the decline are the support levels of 0.6680, 0.6600. The distant target is located at support levels of 0.6260, 0.6000 (lows of 2008 - 2009).

Support Levels: 0.6700, 0.6680, 0.6600, 0.6300

Resistance Levels: 0.6745, 0.6810, 0.6830, 0.6865, 0.6960, 0.7000, 0.7015


Trading Recommendations


Sell by market. Sell-Limit 0.6795, 0.6825. Stop-Loss 0.6870. Take-Profit 0.6700, 0.6680, 0.6600, 0.6300

Buy Stop 0.6840. Stop-Loss 0.6790. Take-Profit 0.6865, 0.6960, 0.7000

020919-AU-D.png


020919-AU-H4.png


*) For up-to-date and detailed analytics and news on the forex market visit Tifia Forex Broker website tifia.com
 
USD/CAD: American dollar is in demand

09/03/2019

Current Dynamics


The US dollar returns its previously lost positions, while commodity currencies are falling in price amid escalation of the trade conflict the USA with China.

On Tuesday, USD / CAD again tested the local resistance level of 1.3345, reached in August. Above the support level of 1.3250, the long-term positive dynamics of USD / CAD prevails. Long positions are preferred.

In the event of a breakdown of the local resistance level of 1.3345 (August highs) USD / CAD will go towards the local resistance levels 1.3435, 1.3452 (Fibonacci level 23.6%), 1.3465, 1.3520, 1.3560 (highs of the year).

In connection with the upcoming meeting of the Bank of Canada on Wednesday, you should also pay attention to the publication on Tuesday (at 13:30 GMT) of the PMI index of business activity in the manufacturing sector of the economy of Canada, provided by the Institute of Supply Management (ISM). This indicator is an important indicator of the state of the Canadian economy. A result above 50 is considered positive and strengthens the CAD, below 50 - as negative for the Canadian dollar. Forecast: 51.0 in August (against 51.2 in July). A relative decrease in the value (above 50) will have a short-term negative impact on the Canadian dollar. The data above the forecast will strengthen CAD.

Thus, most likely, the Bank of Canada on Wednesday will not reduce the rate from the current level of 1.75%, but will make it closer to the end of the year. Any hint from the Bank of Canada's management on this issue will put downward pressure on CAD.

In an alternative scenario, the signal for the resumption of short positions will be a breakdown of the short-term support level 1.3303 (ЕМА200 on the 1-hour chart).

The objectives of the decline are the support levels 1.3250, 1.3258 (ЕМА200 on the 4-hour chart).

The breakdown of these levels will trigger a further decline in the medium-term bearish trend with targets at support levels 1.3020, 1.2880 (ЕМА200 on the weekly chart).

Support Levels: 1.3303, 1.3258, 1.3250, 1.3230, 1.3185, 1.3020, 1.2975, 1.2880

Resistance Levels: 1.3345, 1.3435, 1.3452, 1.3465, 1.3520, 1.3560, 1.3600, 1.3660


Trading recommendations


Sell Stop 1.3285. Stop-Loss 1.3355. Take-Profit 1.3258, 1.3250, 1.3230

Buy Stop 1.3355. Stop-Loss 1.3285. Take-Profit 1.3400, 1.3435, 1.3452, 1.3465, 1.3520, 1.3560, 1.3600, 1.3660

030519-UC-D.png


030519-UC-H4.png


030519-UC-H1.png


*) For up-to-date and detailed analytics and news on the forex market visit Tifia Forex Broker website tifia.com
 
AUD/USD: Current dynamics and recommendations

09/04/2019


The weakening US dollar continues after the publication on Tuesday of weak PMI indices for the manufacturing sector.

Futures on the DXY dollar index fell again and traded at the beginning of the European session on Wednesday near 98.56, after earlier on Tuesday it reached a new multi-month high near 99.32.

At the beginning of today's European session, the AUD / USD pair is trading near the resistance level of 0.6783 (EMA144 on the 4-hour chart). A positive impulse may push the pair to the resistance levels of 0.6805 (ЕМА200 on the 4-hour chart), 0.6830. Further growth may be in doubt, and from these levels you can again enter into short positions.

Below the key resistance level of 0.7015 (ЕМА200 on the daily chart), a long-term negative trend prevails.

Australian GDP data released during the Asian session for the 2nd quarter showed the slowest growth since the global financial crisis. This makes it possible to further soften the RBA monetary policy by the end of the year, which creates a negative fundamental background for AUD.

In case of resumption of decline, the targets will be the support levels of 0.6680, 0.6600, 0.6260, 0.6000 (lows of 2008 - 2009).

Today is full of important news. During the US trading session, several Fed representatives are also expected to speak. In this regard, today we should expect an extremely volatile trading day. Also, today, the Bank of Canada makes a decision on the interest rate, which will be published at 14:00 (GMT), which will increase market volatility in this period of time.

Support Levels: 0.6700, 0.6680, 0.6600, 0.6300

Resistance Levels: 0.6745, 0.6810, 0.6830, 0.6865, 0.6960, 0.7000, 0.7015


Trading Recommendations


Sell by market. Sell-Limit 0.6805, 0.6825. Stop-Loss 0.6870. Take-Profit 0.6700, 0.6680, 0.6600, 0.6300

Buy Stop 0.6870. Stop-Loss 0.6790. Take-Profit 0.6900, 0.6960, 0.7000

040919-AU-D.png


040919-AU-H4.png


*) For up-to-date and detailed analytics and news on the forex market visit Tifia Forex Broker website tifia.com
 
EUR/USD: Eurodollar remains under pressure. Recommendations

09/05/2019


Despite today's and yesterday's corrective growth amid a weakening dollar, the Eurodollar remains under pressure, trading in downward channels on the daily and weekly charts.

The lower border of the descending channel on the weekly chart passes through the mark of 1.1000, and on the daily chart - near the mark of 1.0900.

Nevertheless, on the 1-hour chart EUR / USD broke through the resistance level of 1.1030 (ЕМА200) and continues to develop upward trend towards the resistance levels of 1.1100 (ЕМА200 on the 4-hour chart), 1.1130 (ЕМА50 and the upper border of the downward channel on the daily chart).

The OsMA and Stochastic indicators on the 4-hour, daily, and weekly charts turned to long positions, recommending purchases.

Nevertheless, growth above resistance levels 1.1110, 1.1130 is unlikely.

Below resistance levels of 1.1270 (ЕМА200 on the daily chart), 1.1285 (Fibonacci level 23.6% of the correction to the fall from the level of 1.3900, which began in May 2014), 1.1225 (ЕМА144 on the daily chart) is dominated by long-term negative dynamics.

The closest targets in case of resumption of EUR / USD decline will be levels 1.1000, 1.0960, 1.0940.

A signal to resume purchases will be a breakdown of the short-term support level of 1.1030 (ЕМА200 on the 1-hour chart).

Expectations of further easing of the monetary policy of the ECB put pressure on the euro and the pair EUR / USD.

Speaking on Wednesday at the European Parliament, Kristin Lagarde, who will be the next president of the European Central Bank, said that the ECB's monetary policy stimulus measures continue to have a beneficial effect on the Eurozone economy (Lagarde will replace Draghi as president of the ECB on November 1).

“The Eurozone economy has faced some short-term risks, mainly related to external factors, while inflation stubbornly remains below the target level set by the ECB”, she said. “Thus, I agree with the ECB Governing Council that stimulating monetary credit policy will remain appropriate for a long period of time".

Of the news for today, we are awaiting publication in the period from 12:15 to 14:00 (GMT) of a block of important macro statistics for the United States. Although there is usually no direct correlation with Non-Farm Payrolls, the ADP report is considered a harbinger of the official report of the US Department of Labor on the general state of the labor market in the country. Strong data has a positive effect on the dollar. An increase of 149,000 in the number of workers in the US private sector is expected (up from +156,000 in July). A decrease in the result may negatively affect the dollar.

The business activity index (PMI) in the service sector measures the state of the service sector in the US economy. A relative decrease in the indicator or data worse than forecast (54.0 in August against 53.7 in July) may have a short-term negative impact on the dollar.

Support Levels: 1.1030, 1.1000, 1.0960, 1.0940

Resistance Levels: 1.1085, 1.1110, 1.1130, 1.1200, 1.1225, 1.1270, 1.1285


Trading Recommendations


Sell Stop 1.1010. Stop-Loss 1.1055. Take-Profit 1.1000, 1.0960, 1.0940

Buy Stop 1.1055. Stop-Loss 1.1010. Take-Profit 1.1085, 1.1110, 1.1130, 1.1200, 1.1225, 1.1270, 1.1285

050919-EU-D.png


050919-EU-H4.png


050919-EU-H1.png


*) For up-to-date and detailed analytics and news on the forex market visit Tifia Forex Broker website tifia.com
 
S&P500: Current Dynamics and Recommendations

09/06/2019


Expectations of reaching an agreement in a trade dispute between the United States and China, easing the monetary policy of the Fed and positive macro statistics was coming from the US on Thursday contributed to the resumption of growth in major US stock indexes.

On Thursday in Beijing, they announced that they were aimed at significant progress in the October talks, while the US Presidential Administration announced that China’s readiness to conduct direct negotiations can be regarded as a positive signal.

This information eased investors' concerns about tensions in international trade, which contributed to a slowdown in the global economy.

On Thursday, precious metal prices plummeted, and the yield on 10-year US Treasury bonds rose amid news of a possible resumption of trade negotiations. Gold declined in price to $ 1518.00 per ounce, and the yield on 10-year US bonds rose to 1.565%.

A report by ADP and Moody's Analytics, also published Thursday, said the number of jobs in the US private sector increased more significantly in August than economists had expected. According to the data presented, the number of new jobs in the private sector for the reporting period amounted to 195,000 (the forecast was +140,000).

The ADP index has no direct correlation with Non-Farm Payrolls. Nevertheless, the ADP report is considered a harbinger of the official report of the US Department of Labor on the general state of the labor market in the country. An increase of 158,000 in the number of workers in the US private sector is expected (up from +164,000 in July), as well as an unemployment rate of 3.7% (same as in July).

Later Fed Chairman Jerome Powell will speak in Zurich at an event organized by the Swiss Institute for International Studies, where he can talk about the further development of monetary policy. His speech on the topic “Economic Prospects and Monetary Policy” will begin at 16:30 (GMT).

During this period, a surge in volatility in the financial markets is expected.

Meanwhile, the S&P500 index maintains long-term positive dynamics, trading above the key support levels of 2857.0 (ЕМА200 on the daily chart), 2865.0 (Fibonacci level 23.6% of the correction to the growth since December 2018 and mark 2335.0). In the event of a breakdown of the local resistance level of 2990.0 (the upper line of the ascending channel on the daily chart), the S&P500 will continue to move towards recent absolute highs near the 3028.0 mark.

In an alternative scenario and after the breakdown of the support level 2925.0 (ЕМА200 on the 1-hour and 4-hour charts, ЕМА50 on the daily chart) S&P500 will again go to the support level 2865.0. Above support level 2925.0, should be abstained S&P500 sales.

Support Levels: 2965.0, 2925.0, 2900.0, 2865.0, 2857.0, 2765.0, 2730. 2680.0

Resistance Levels: 2990.0, 3000.0, 3028.0


Trading Recommendations


Sell Stop 2920.0. Stop-Loss 2970.0. Goals 2900.0, 2865.0, 2857.0

Buy Stop 2992.0. Stop-Loss 2962.0. Goals 3000.0, 3028.0, 3100.0, 3200.0

060919-S-P500-D.png


060919-S-P500-H4.png


*) For up-to-date and detailed analytics and news on the forex market visit Tifia Forex Broker website tifia.com
 
EUR/USD: Current dynamics on 09/09/2019

Published last Friday, data on the number of jobs outside the US agriculture in August fell short of expectations. According to data released on Friday by the Department of Labor, the number of jobs outside the US agriculture in August rose by 130,000 (the forecast was +150,000). The dollar is falling at the start of a new week after the publication of NFP.

Now investors are waiting for the Fed meeting next week and take into account the 100% probability of lowering rates by 0.25%.

Expectations of a more aggressive easing of the Fed's monetary policy are holding back investors from buying the dollar.

On Thursday (at 11:45 GMT), the ECB's decision on rates will be published. The ECB is expected to announce a large-scale easing program, as well as emphasizing its commitment to maintaining low interest rates.

Thus, most likely, before the publication of the ECB's decision on rates, the EUR / USD pair will trade in the range near current levels and the level of 1.1030, but with a tendency to further decline.

The immediate objectives of the decline in the event of a breakdown of the local support level of 1.1000 will be otmeki 1.0960, 1.0940. In an alternative scenario, a breakdown of the short-term resistance level of 1.1100 (EMA200 on the 4-hour chart) may become a signal to start an upward correction. The target is located at the resistance level of 1.1130 (local maximums and ЕМА50 on the daily chart). Growth above these levels is unlikely. Long-term negative dynamics prevail. Expectations of further easing of the monetary policy of the ECB put pressure on the euro and the pair EUR / USD.

Support Levels: 1.1030, 1.1000

Resistance Levels: 1.1100, 1.1130, 1.1200, 1.1220, 1.1270, 1.1285


Trading Recommendations


Sell Stop 1.0990. Stop-Loss 1.1090. Take-Profit 1.0960, 1.0940, 1.0900

Buy Stop 1.1090. Stop-Loss 1.0990. Take-Profit 1.1100, 1.1130, 1.1200, 1.1220, 1.1270, 1.1285

090919-EU-D.png


[URL='https://i.postimg.cc/G2cQDnCQ/090919-EU-H4.png%5B/img']https://i.postimg.cc/G2cQDnCQ/090919-EU-H4.png[/img[/URL]]

[b][i][I][B]*) For up-to-date and detailed analytics and news on the forex market visit Tifia Forex Broker website tifia.com[/B][/I][/i][/b]
 
XAU/USD: growth is likely to resume

09/10/2019

Current Dynamics


After comments by US President Donald Trump regarding progress in negotiations with China on trade, and after reducing the threat of a “tough” Brexit, investors turned their attention to risky assets again. World and US stock indices have been rising in recent days.

American consumers and companies are still actively spending money, despite the slowdown in the global economy and increased tension in foreign trade, which indicates their confidence in the stable state of the US economy.

The escalation of tensions in US-China trade relations in recent weeks has overshadowed US economic prospects. This contributed to an increase in expectations that the Federal Reserve could resort to a more rapid reduction in interest rates, which would put pressure on the dollar.

Many market participants still believe that the Fed will lower interest rates by 0.25% as part of the September meeting.

If the Fed leadership expresses a tendency towards more aggressive easing of its policy, the stock markets will grow even more, but it will also contribute to the resumption of growth of gold quotes, since when the rate is reduced, the national currency usually becomes cheaper, making gold purchases attractive.

At the beginning of the European session on Tuesday, XAU / USD is trading near important support levels of 1495.00 (EMA200 on the 4-hour chart), 1485.00 (Fibonacci level 50% of the correction to the wave of decline since September 2011 and the mark of 1920.00).

Despite the corrective decline, the pair XAU / USD maintains long-term positive dynamics.

From current support levels, it is possible to resume purchases of the XAU / USD pair.

An alternative scenario suggests a decrease in XAU / USD to support levels of 1380.00 (Fibonacci 38.2% and highs of 2016), 1368.00 (EMA200 on the daily chart and the bottom line of the upward channel on the weekly chart).

A signal for sales will be a breakdown of the support level of 1474.00.

Above the support levels of 1474.00, 1485.00, 1495.00, long positions are preferred.

Support Levels: 1495.00, 1485.00, 1474.00, 1452.00, 1440.00, 1413.00, 1380.00, 1368.00, 1325.00, 1290.00, 1253.00

Resistance Levels: 1520.00, 1555.00, 1585.00


Trading Scenarios


Sell Stop 1469.00. Stop-Loss 1503.00. Take-Profit 1452.00, 1440.00, 1413.00, 1380.00, 1368.00

Buy Stop 1503.00. Stop-Loss 1469.00. Take-Profit 1520.00, 1555.00, 1585.00, 1600.00

100919-XU-D.png


100919-XU-H4.png


*) For up-to-date and detailed analytics and news on the forex market visit Tifia Forex Broker website tifia.com
 
GBP/USD: Current dynamics and recommendations

09/11/2019


The reduced risks of the “hard” Brexit positively affected the dynamics of the pound and the GBP / USD pair.

On Tuesday, the pound received additional support after the publication of positive macro statistics, indicating a decrease in unemployment in the UK in May-July to 3.8% from 3.9% in April-June. The average earnings excluding premiums in May-July increased by 3.8%, which is higher than the forecast of 3.7%.

Meanwhile, the threat of "hard" Brexit continues to dominate the pound, not allowing it to more rapidly develop the upward trend.

During his speech yesterday at the Council on Foreign Relations in New York, Bank of England Governor Mark Carney said the “tough” Brexit will slow the economy down and push inflation up.

Parliament blocked the possibility of Britain leaving the EU without a deal on October 31, which had a positive effect on the pound.

However, the pound may again come under pressure when discussions on the possibility of a general election resume after October 31.

Despite the current corrective strengthening of the pound, its long-term negative dynamics prevail.

So far, GBP / USD is trading above the short-term support levels of 1.2270 (ЕМА200 on the 1-hour chart), 1.2255 (ЕМА200 on the 4-hour chart).

The breakdown of these support levels will resume the long-term bearish trend of GBP / USD.

In an alternative scenario, a breakthrough of local 1.2360 will trigger an growth to the zone of resistance levels of 1.2480, 1.2530 (June lows), 1.2570 (EMA144 on the daily chart).

Nevertheless, preference should still be given to short positions, especially if GBP / USD drops to a zone below the support level of 1.2255.

Support Levels: 1.2300, 1.2270, 1.2255, 1.2200, 1.2175, 1.2150, 1.2100, 1.2000

Resistance Levels: 1.2360, 1.2480, 1.2530, 1.2570


Trading recommendations


Sell Stop 1.2250. Stop-Loss 1.2390. Take-Profit 1.2200, 1.2175, 1.2150, 1.2100, 1.2000

Buy Stop 1.2390. Stop-Loss 1.2250. Take-Profit 1.2480, 1.2530, 1.2570

110919-GU-D.png


110919-GU-H4.png


*) For up-to-date and detailed analytics and news on the forex market visit Tifia Forex Broker website tifia.com
 
Back
Top