Tifia FX
TifiaFx Representative
- Messages
- 30
NZD/USD: Current Dynamics
12/03/2019
According to the US Institute for Supply Management (ISM) on Monday, the manufacturing PMI index fell to 48.1 in November from 48.3 in October (the forecast was 49.2).
The manufacturing sector does not have such a significant effect on US GDP as consumer spending. However, it is an important indicator of the state of the American economy as a whole.
Index values below 50 indicate a decline in activity. At the same time, the value of the manufacturing PMI below this mark has been observed for the fourth month in a row.
New manufacturers were pressured by new import duties and uncertainty over the US-China trade dispute.
The DXY dollar index reached a new 7-week high last Friday near 98.50. However, on Tuesday, the DXY index is down for the second day in a row. At the beginning of today's European session, futures on the DXY dollar index was trading near 97.75, 45 points below the closing price last Friday.
This week, investors will be waiting for the publication of data on the US services sector (on Wednesday at 14:45 and 17:00 GMT), as well as a report on employment by the Department of Labor (on Friday at 13:30 GMT). In general, strong data are expected from the US labor market. At the same time, unemployment remained at a multi-year low of 3.6%.
If the data is confirmed or is better than the forecast, then the US dollar will quickly catch up.
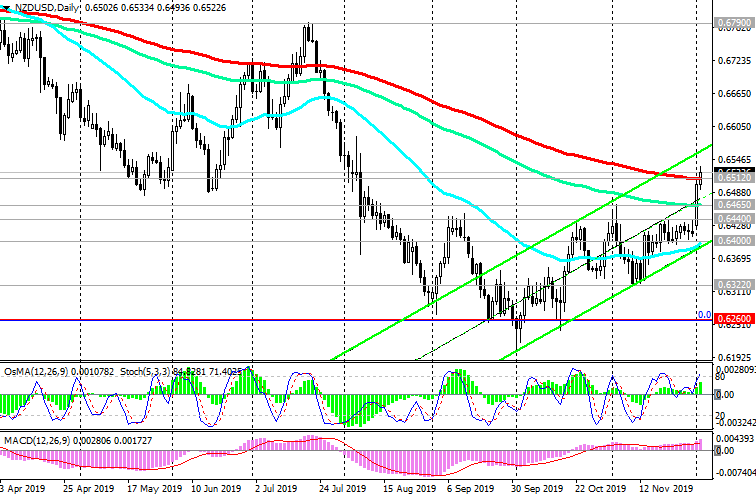
In the first half of the trading day on Tuesday, NZD strengthened, and the NZD / USD pair rose, and for the second day in a row. At the beginning of the American session, NZD / USD is trading near the 0.6512 mark, through which the key resistance level passes (ЕМА200 on the daily chart). At 0.6545, there is another strong long-term resistance level (EMA50 on the weekly chart). To pass these strongest levels, the NZD / USD pair needs additional drivers. If positive macro data begins to arrive from the USA, then NZD/USD can rebound from current levels and return into the global downtrend.
Below the support level of 0.6465 (EMA144 on the daily chart) short positions will again become relevant.
Support Levels: 0.6465, 0.6440, 0.6400, 0.6322, 0.6260, 0.6200, 0.6100
Resistance Levels: 0.6512, 0.6545
Trading Scenarios
Sell Stop 0.6490. Sell Limit 0.6545. Stop-Loss 0.6610. Take-Profit 0.6465, 0.6440, 0.6400, 0.6322, 0.6260, 0.6200, 0.6100
Buy Stop 0.6610. Stop-Loss 0.6490. Take-Profit 0.6700, 0.6790


*) For up-to-date and detailed analytics and news on the forex market visit Tifia Forex Broker website tifia.com
12/03/2019
According to the US Institute for Supply Management (ISM) on Monday, the manufacturing PMI index fell to 48.1 in November from 48.3 in October (the forecast was 49.2).
The manufacturing sector does not have such a significant effect on US GDP as consumer spending. However, it is an important indicator of the state of the American economy as a whole.
Index values below 50 indicate a decline in activity. At the same time, the value of the manufacturing PMI below this mark has been observed for the fourth month in a row.
New manufacturers were pressured by new import duties and uncertainty over the US-China trade dispute.
The DXY dollar index reached a new 7-week high last Friday near 98.50. However, on Tuesday, the DXY index is down for the second day in a row. At the beginning of today's European session, futures on the DXY dollar index was trading near 97.75, 45 points below the closing price last Friday.
This week, investors will be waiting for the publication of data on the US services sector (on Wednesday at 14:45 and 17:00 GMT), as well as a report on employment by the Department of Labor (on Friday at 13:30 GMT). In general, strong data are expected from the US labor market. At the same time, unemployment remained at a multi-year low of 3.6%.
If the data is confirmed or is better than the forecast, then the US dollar will quickly catch up.
In the first half of the trading day on Tuesday, NZD strengthened, and the NZD / USD pair rose, and for the second day in a row. At the beginning of the American session, NZD / USD is trading near the 0.6512 mark, through which the key resistance level passes (ЕМА200 on the daily chart). At 0.6545, there is another strong long-term resistance level (EMA50 on the weekly chart). To pass these strongest levels, the NZD / USD pair needs additional drivers. If positive macro data begins to arrive from the USA, then NZD/USD can rebound from current levels and return into the global downtrend.
Below the support level of 0.6465 (EMA144 on the daily chart) short positions will again become relevant.
Support Levels: 0.6465, 0.6440, 0.6400, 0.6322, 0.6260, 0.6200, 0.6100
Resistance Levels: 0.6512, 0.6545
Trading Scenarios
Sell Stop 0.6490. Sell Limit 0.6545. Stop-Loss 0.6610. Take-Profit 0.6465, 0.6440, 0.6400, 0.6322, 0.6260, 0.6200, 0.6100
Buy Stop 0.6610. Stop-Loss 0.6490. Take-Profit 0.6700, 0.6790
*) For up-to-date and detailed analytics and news on the forex market visit Tifia Forex Broker website tifia.com