Tifia Forex Broker Daily Market Analytics, Analytics and trading recommendations by Tifia Company

GBP/USD: the pound may also be under pressure

10/03/2020


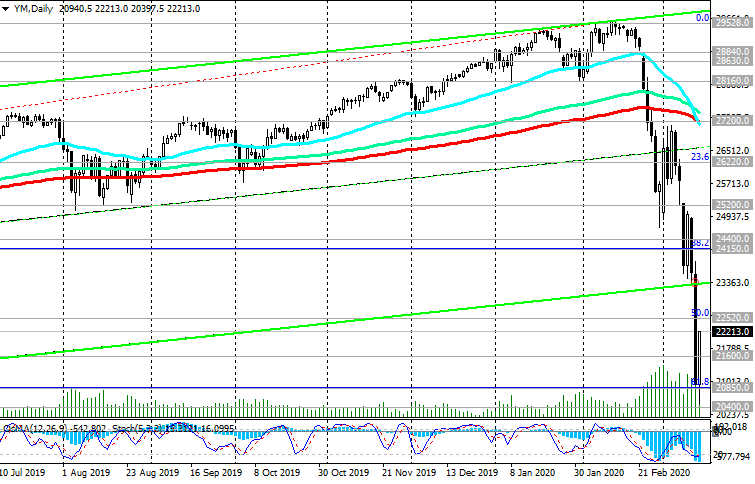
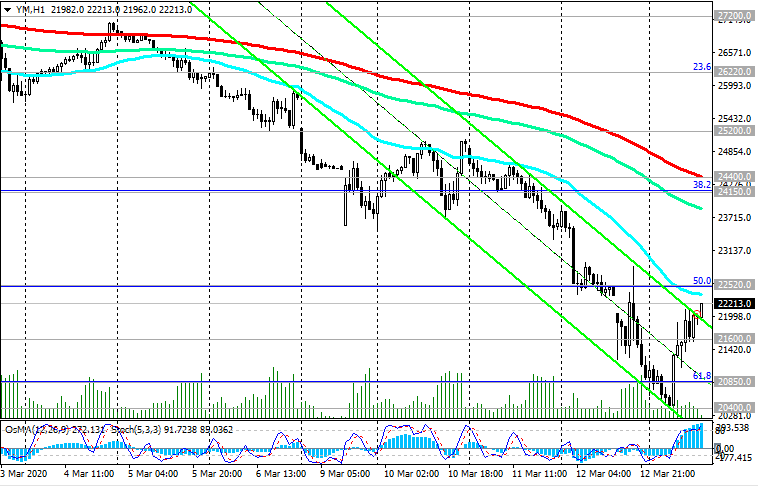
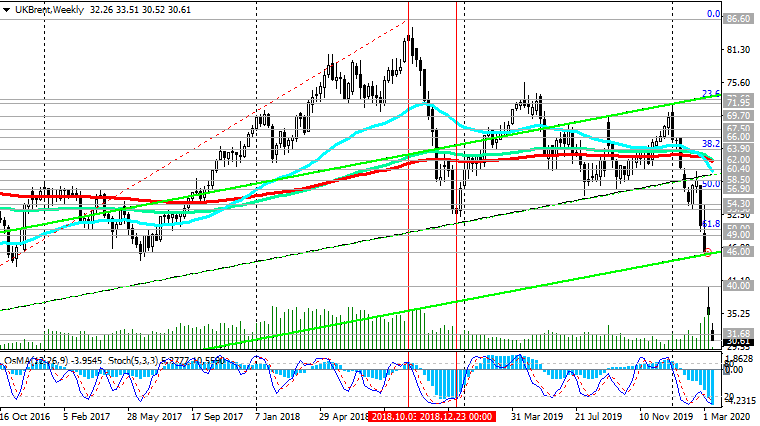
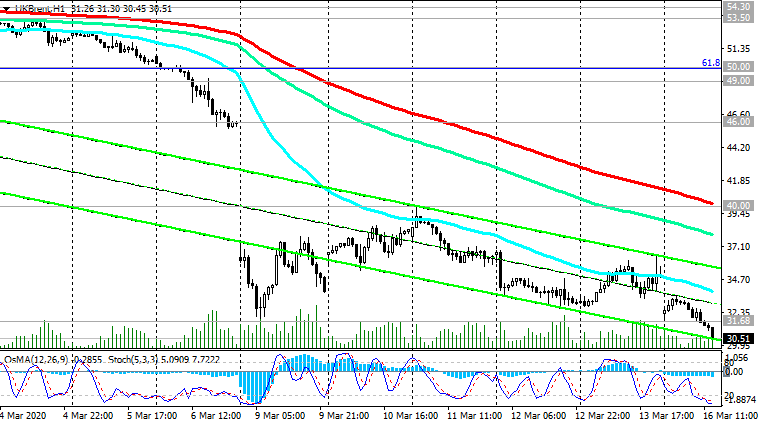
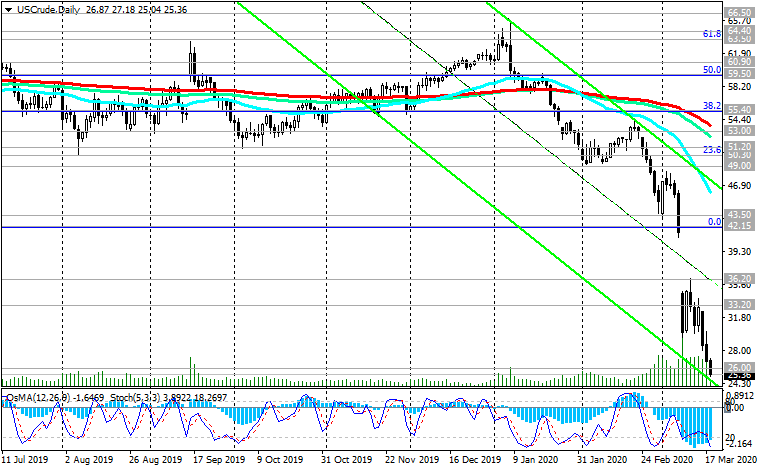
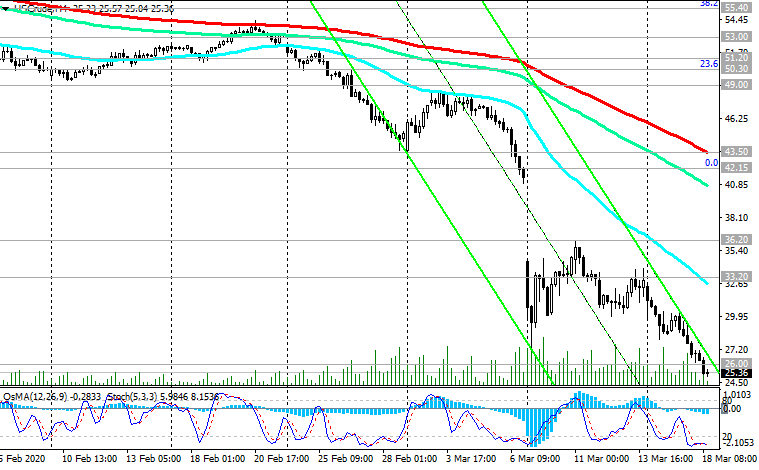
After sharp movements in the financial and commodity markets on Monday, caused by the collapse of stock indices and oil prices, a pullback occurs on Tuesday, although markets are still far from complete stabilization. It is possible that everything is just beginning and the worst is to come. Last Friday, OPEC and Russia were unable to reach an agreement to reduce oil production. In response to the failure of the deal, Saudi Arabia has lowered the selling price of oil and is going to increase the supply. The price war in the oil market may negatively affect other markets.

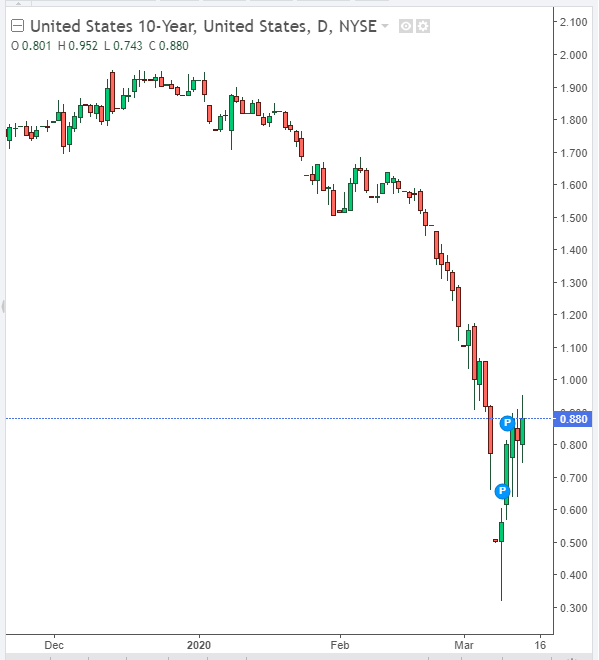
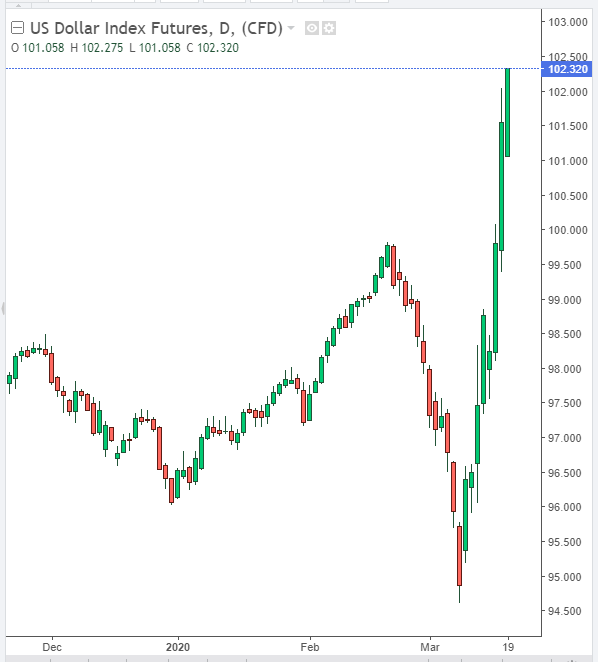
Negative sentiment prevails in the markets, triggered by investor fear over the coronavirus and price war, which could erupt in the oil market. Investors are forced to sell the dollar and risky assets, going into defensive assets such as yen, gold, government bonds. Yields on 10-year US bonds fell on Monday to 0.342%, the absolute minimum, and gold quotes last Monday exceeded $ 1,700.00 an ounce, although they subsequently declined to $ 1,680.00 an ounce. The dollar fell especially significantly against European currencies and the yen.

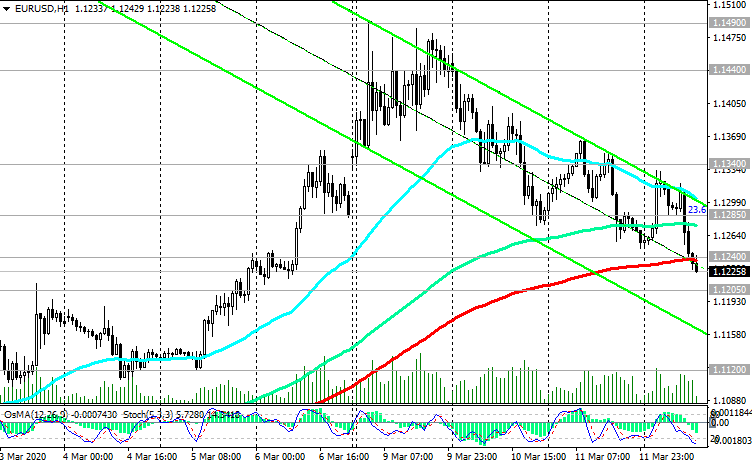
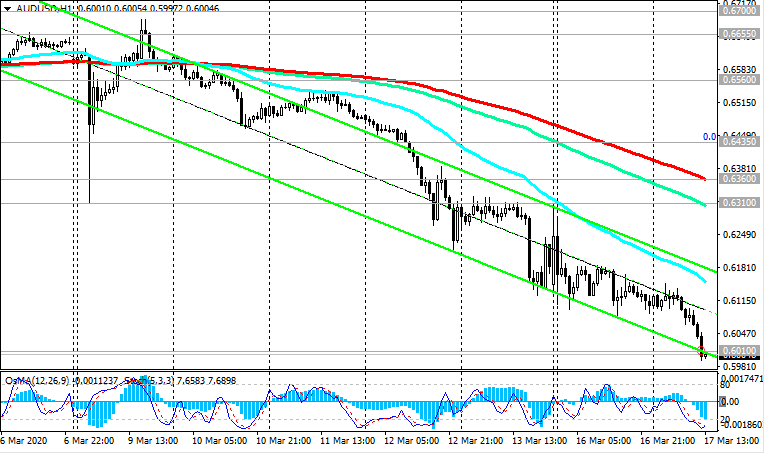
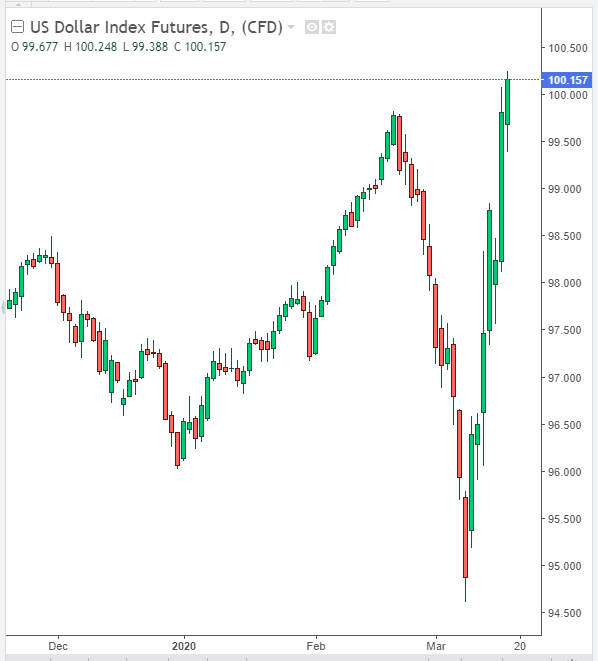
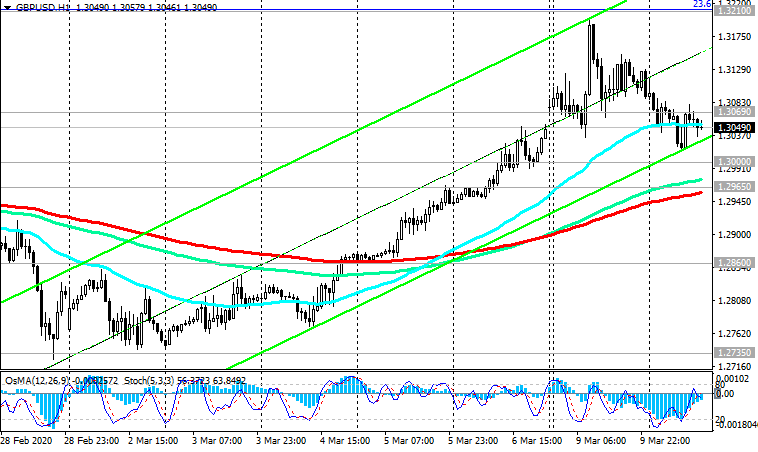
At the beginning of today's European session, GBP / USD is trading near 1.3050, while the dollar is gradually winning back the positions it lost on Monday, although it remains vulnerable on the eve of the Fed meeting on March 17-18.

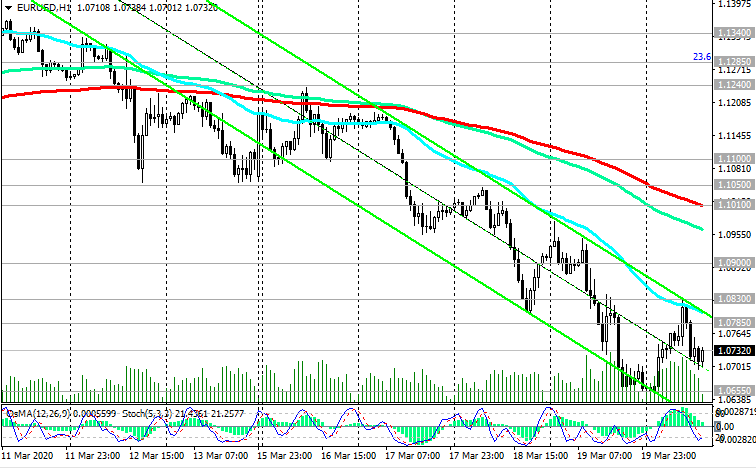
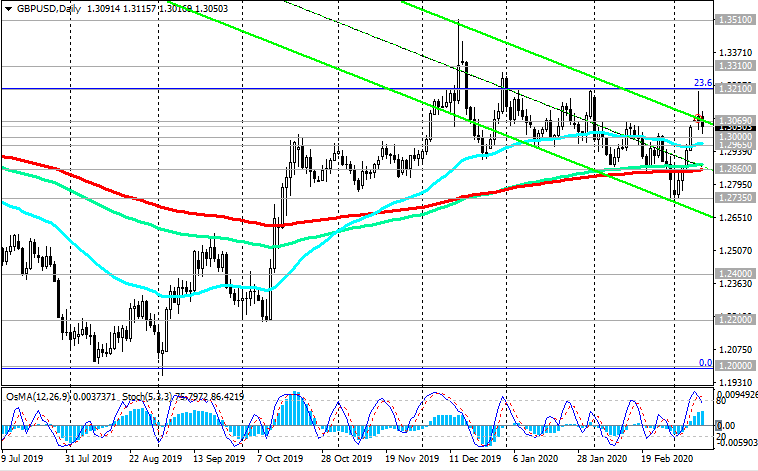
GBP / USD continues to trade in the zone above the important support level of 1.2860 (ЕМА200 on the daily chart). In case of breakdown of the resistance levels 1.3210 (Fibonacci level 23.6% of the correction to the reduce of the GBP / USD in the wave that began in July 2014 near the level of 1.7200), 1.3310 (EMA200 on the weekly chart) GBP / USD will resume the upward trend and head towards the levels resistance 1.3960 (Fibonacci level 38.2%), 1.4350 (highs of 2018), which will talk about breaking the bearish trend GBP / USD.

The first signal for the implementation of an alternative negative scenario will be a breakdown of the short-term support level of 1.2965 (ЕМА200 on the 4-hour and 1-hour charts). The reduction targets are located at the support levels of 1.2735 (lows of March), 1.2590 (lows of May 2019 and the lower border of the descending channel on the daily chart), 1.2400, 1.2200 (lows of October), 1.2000 (lows of 2019 and the Fibonacci level of 0%).

Bank of England future manager Andrew Bailey said last week that the central bank could take stimulus measures before the scheduled meeting (March 26) if it considers that the economy urgently needs support in the wake of the coronavirus epidemic. Many economists expect the UK central bank to lower its key interest rate to 0.5% from 0.75% this month. This may adversely affect pound quotes. If the Bank of England favors a further reduction in the interest rate, then the pound, which for the time being remains stable, may weaken sharply.

Support Levels: 1.3000, 1.2965, 1.2860, 1.2735, 1.2590, 1.2400, 1.2200, 1.2000

Resistance Levels: 1.3069, 1.3210, 1.3310, 1.3510, 1.3960


Trading Scenarios


Sell Stop 1.2955. Stop-Loss 1.3075. Take-Profit 1.2860, 1.2735, 1.2590, 1.2400, 1.2200, 1.2000

Buy Stop 1.3075. Stop-Loss 1.2955. Take-Profit 1.3210, 1.3310, 1.3510, 1.3960

100320-GU-H1.png


100320-GU-D.png


*) For up-to-date and detailed analytics and news on the forex market visit Tifia Forex Broker website tifia.com
 
AUD/USD: “gloomy” prospects

11/03/2020


Financial markets continue to be in a fever amid growing coronavirus epidemics and the risks of a significant slowdown in the global economy. Another negative factor unexpectedly added to the coronavirus factor last Friday, when the OPEC+ coalition practically collapsed. Russia and Saudi Arabia could not agree on a further reduction in oil production and export. Oil prices crashed down. They were followed by global stock indices and other commodity prices.

Last Monday, at the beginning of the trading day, the AUD / USD pair broke through the multi-year support level of 0.6435 for a short time (11-year low and Fibonacci level 0% of the correction to the decline wave, which began in July 2014 from 0.9500). And although AUD / USD subsequently rose, reaching an intraday high of 0.6680, the pair resumed its decline on Tuesday.

In early March, the Reserve Bank of Australia lowered its key rate by 25 basis points to a record low of 0.5%, which was the fourth rate cut in less than a year. “Ready for further easing of monetary policy”, the RBA said.

The Australian government is now preparing to announce fiscal stimulus measures in response to the economic damage from the epidemic. It seems increasingly likely that, because of the coronavirus, Australia's economy could go into recession for the first time in 28 years.

The prospects for the Australian dollar look depressing, given the sharp drop in commodity prices, including coal, oil and petroleum products, and iron ore, the main commodities of Australian commodity exports.

At the beginning of today's European session, the AUD / USD pair is trading near the 0.6525 mark, falling from an intraday high of 0.6535 reached earlier. With any upward correction of AUD, you should probably look for opportunities to enter short positions, including in the AUD / USD pair. Although, entering in the short positions "by the market" is likely to be appropriate too.

Below the key resistance level of 0.6830 (EMA200 on the daily chart), the downward global trend of AUD / USD prevails.

In the current situation and below the resistance level of 0.6655 (ЕМА200 on the 4-hour chart), only short positions should be considered.

Support Levels: 0.6500, 0.6435, 0.6400, 0.6310

Resistance Levels: 0.6575, 0.6655, 0.6700, 0.6755, 0.6790, 0.6830


Trading Recommendations


Sell Stop 0.6480. Stop-Loss 0.6580. Take-Profit 0.6435, 0.6400, 0.6310

Buy Stop 0.6580. Stop-Loss 0.6480. Take-Profit 0.6600, 0.6655, 0.6700, 0.6755, 0.6790, 0.6830

110320-AU-D.png


110320-AU-H4.png


*) For up-to-date and detailed analytics and news on the forex market visit Tifia Forex Broker website tifia.com
 
EUR/USD: contradictory dynamics

12/03/2020


Today, investors will follow the ECB meeting, which will end with the publication at 12:45 (GMT) of the decision on interest rates. At 13:30 a press conference of the ECB will begin, during which the head of the ECB Christine Lagarde will explain the decision of the bank, assess the prospects of the European economy and, probably, touch on further plans for the monetary policy of the bank, as well as answer questions from journalists.

Earlier this month, 4 of the world's largest central banks (RB of Australia, Bank of Canada, Fed, Bank of England) reduced interest rates. The Fed, the Bank of Canada and the Bank of England took unprecedented measures by cutting the interest rate by 0.50%, and the Fed and the Bank of England did this during an extraordinary meeting.

The ECB is also expected to expand the stimulus package and lower the key interest rate, which is already in negative territory, at -0.5%.

The markets are dominated by fear of the global coronavirus pandemic. Many global stock indices have already moved to the side of the bear market.

At the beginning of this week, the EUR / USD pair briefly exceeded the key resistance level 1.1440 (EMA200 on the weekly chart), which separates EUR / USD from the bullish trend.

At the beginning of today's European session, EUR / USD is traded near 1.1230, below the important short-term support level of 1.1240 (EMA200 on the 1-hour chart), indicating a tendency to further decline.

Above the important support level 1.1120 (ЕМА200 on the daily chart), the upward trend prevails. The return of EUR / USD into the zone above the level of 1.1240 will be a signal for the resumption of long positions, although probably the most cautious investors will prefer to stay out of the market today.

Support Levels: 1.1240, 1.1205, 1.1120, 1.1080

Resistance Levels: 1.1285, 1.1340, 1.1400, 1.1440, 1.1490


Trading Recommendations


Sell by market. Stop-Loss 1.1290. Take-Profit 1.1205, 1.1120, 1.1080

Buy Stop 1.1310. Stop-Loss 1.1220. Take-Profit 1.1340, 1.1400, 1.1440, 1.1490

120320-EU-W.png


120320-EU-D.png


120320-EU-H1.png


*) For up-to-date and detailed analytics and news on the forex market visit Tifia Forex Broker website tifia.com
 
DJIA: further decline is not ruled out

13/03/2020


Despite the correction of world stock indices observed today, it is still too early to start their purchases. The markets are dominated by investors' fears about the spread of coronavirus in the world and the slowdown of the global economy. World and US stock indices show the strongest decline over the past few years. Just 4 weeks ago, the DJIA was trading near the absolute maximum 29528.0. However, the collapse of the DJIA index crossed out almost all of its 3-year growth.

Donald Trump for 30 days banned the entry into the United States from Europe due to the coronavirus, which raised new concerns about the economic impact of the coronavirus.

A number of the world's largest central banks have taken a sharp decline in interest rates, with the Fed and the Bank of England cutting interest rates by 50 bp at once during their extraordinary meetings.

“Coronavirus poses a growing risk for economic activity”, the US Central Bank said.

Next week (March 17 - 18), the Fed will hold its next scheduled meeting. Investors and economists believe that the Fed will again lower the interest rate at this meeting, dropping it by another 50 bp to the level of 0.75%. Last week, when the Fed unexpectedly cut the rate by 0.50%, Donald Trump urged the Fed to lower it to zero.

Such a decision by the Fed could support the US stock market. However, to say that the worst is over is still too early. The spread of coronavirus in the world does not stop, covering all new regions.

The market is dominated by pessimistic sentiment, which can again bring down stock indices to new local lows.

At the beginning of today's European session, the DJIA is trading near the level of 22200.0, trying to adjust to the area above the level of 22520.0 (Fibonacci level 23.6% of the correction to the DJIA growth wave, which began in February 2016 from 15500.0). But you should still refrain from shopping.

A further index decline to the support levels 20850.0 (Fibonacci level 61.8%), 20400.0 (local lows and ЕМА144 on the monthly chart), 19700.0 (EMA200 on the monthly chart) is not ruled out.

The first signal for DJIA purchases may be its growth into a zone above the resistance levels 24150.0 (ЕМА200 on the weekly chart and the Fibonacci level 38.2%), 24400.0 (ЕМА200 on the 1-hour chart).

In case of negative developments, a breakdown of the support level of 19700.0 can break the DJIA long-term bullish trend.

Support Levels: 20850.0, 20400.0, 19700.0

Resistance Levels: 22520.0, 24150.0, 24400.0, 25200.0, 26220.0, 27200.0, 28160.0, 28630.0, 28840.0, 29528.0


Trading Scenarios


Buy Stop 22600.0. Stop-Loss 21600.0. Take-Profit 24150.0, 24400.0, 25200.0, 26220.0, 27200.0

Sell Stop 21600.0. Stop-Loss 22600.0. Take-Profit 20850.0, 20400.0, 19700.0

130320-10-Y.png


D-130320-DJIA-D.png


130320-DJIA-H1.png


*) For up-to-date and detailed analytics and news on the forex market visit Tifia Forex Broker website tifia.com
 
Brent: fall continues

16/03/2020


Having exceeded the limit of restrictions in the electronic trading system by 5%, at the opening of the trading day on Monday, futures for the US S&P 500 index fell to around 2568.0. Probably, at the opening of the American trading session, US stock indices will also begin with a sharp drop.

Last Sunday, the Fed held another emergency meeting and cut rates, this time by 100 bp, to a range of 0% - 0.25%, and also announced the allocation of $ 700 billion for the purchase of US government bonds and securities with a mortgage cover.

Global stock indices also continued to decline on Monday. The Australian S&P/ASX 200 fell by a record 9.7%, ending the session about 30% below the peak reached less than a month ago.

The British FTSE 100 in London fell another 7.5% after falling at the opening of electronic trading on Monday by 5%, the European Stoxx Europe 600 at the opening of trading fell by 4.7%. Indices of Hong Kong, Shanghai, South Korea and Japan fell by more than 3%.

Investors no longer pay attention to the Fed and are waiting for the actions of the federal authorities - more serious support to the economy. In the US, government measures may include tax cuts, direct payments to households, earmarked funding, increased federal spending, and other measures.

According to Jerome Powell, Chairman of the US Federal Reserve System, when the Fed decided to lower the rate last Sunday, one of the factors that influenced the central bank’s decision to soften its monetary policy was a sharp drop in oil prices.

WTI oil futures are trading at the beginning of today's European session at a price below $ 30.00 per barrel. Brent oil contracts also traded lower.

Oil market analysts believe that the unexpected increase in oil production due to the severance of partnership between Russia and OPEC, as well as the escalation of the price war between Russia and Saudi Arabia, will increase pressure on quotes, which threatens to reduce them further.

Last week, Saudi Arabia offered buyers from Europe some grades of oil at a price of $25 per barrel.

Brent crude declined on Monday to around 30.50. Probably, the fall in prices may continue.

At the beginning of today's European session, Brent crude is trading at $30.60 a barrel.

Technical indicators OsMA and Stochastic are on the side of the sellers on the 4-hour, daily, weekly, monthly charts, signaling the likelihood of a further price decline.

If the decline continues, then very soon it will be possible to see Brent oil near the price level of $27.00 per barrel. So low oil has not been traded since the end of January 2016, when it reached local multi-year lows.

In an alternative scenario, if the correction starts and after the breakdown of the local resistance level of 40.00 (EMA200 on the 1-hour chart), prices will rise to recent lows of 46.00 - 50.00 dollars per barrel. But only a breakdown of the key resistance level of 60.00 (EMA200 on the daily chart) will resume the bullish trend. Below this level of resistance, long-term negative dynamics prevail. Short positions are preferred.

Support levels: 30.00, 29.00, 28.00, 27.00

Resistance levels: 40.00, 46.00, 50.00, 53.50, 54.30, 56.90, 58.50, 60.00, 62.00


Trading Recommendations


Sell by market. Stop-Loss 33.60. Take-Profit 30.00, 29.00, 28.00, 27.00

Buy Stop 33.60. Stop-Loss 29.90. Take-Profit 40.00, 46.00, 50.00, 53.50, 54.30, 56.90, 58.50, 60.00, 61.00

160320-Brent-D.png


160320-Brent-H1.png


*) For up-to-date and detailed analytics and news on the forex market visit Tifia Forex Broker website tifia.com
 
AUD/USD: we expect further fall of the pair

17/03/2020


The pair AUD / USD updated on Tuesday the almost 12-year low, which is near the level of 0.6010, and continues to decline in the first half of the trading day.

The Australian dollar continues to fall amid growing investor fears about the coronavirus pandemic and the strengthening of the US dollar, as well as expectations of the next reduction in the interest rate of the RBA at an emergency meeting on Thursday.

The RBA lowered interest rates during the March meeting and is expected to lower them again at an extraordinary meeting on Thursday March 19, while introducing additional measures. Investors expect further action from the RBA, given in the quotes lowering rates by 0.25% and QE.

At the same time, the US dollar is likely to continue to be in demand amid stress on global financial markets, despite another urgent Fed rate cut of 100 bps last Sunday. Investors are waiting for governments to strengthen fiscal stimulus measures.

In this regard, the fall of AUD / USD below 0.6000 is probably inevitable. Assuming a further fall in AUD / USD the next target will be the support level of 0.4780 (lows of 2001).

In the current situation and below resistance levels of 0.6360 (EMA200 on the 1-hour chart), 0.6435 (the recent 11-year low and the Fibonacci level 0% of the correction to the decline wave, which began in July 2014 from 0.9500), only short positions should be considered.

Support Levels: 0.6010, 0.5490

Resistance Levels: 0.6310, 0.6360, 0.6435, 0.6560, 0.6655, 0.6700, 0.6740, 0.6790


Trading Recommendations


Sell by market. Stop-Loss 0.6150. Take-Profit 0.5900, 0.5800, 0.5700, 0.5600, 0.5500

Buy Stop 0.6150. Stop-Loss 0.6000. Take-Profit 0.6310, 0.6360, 0.6435

170320-AUW.png


170320-AUD.png


170320-AUH1.png


*) For up-to-date and detailed analytics and news on the forex market visit Tifia Forex Broker website tifia.com
 
WTI: prices are falling rapidly

18/03/2020


At the end of today's Asian session, WTI crude oil broke through the psychologically important support level of 26.00, updating the 4-year low. At the beginning of the European session on Wednesday, WTI oil

was traded near $25.30 a barrel, the new local low since February 2016. This is 295% below the local maximum of October 2018, when WTI crude oil was traded near the level of 76.80 dollars per barrel. Over the past 3 incomplete months, WTI crude oil has fallen in price by 235%, collapsing from 61.25.

The aggravating investor pessimism associated with the coronavirus pandemic is pushing global stock indices and commodity prices, including oil, towards multi-year lows.

According to media reports, Saudi Aramco confirmed the intention of Saudi Arabia to increase production to a maximum level of 12 million barrels per day. Last week, Saudi Arabia offered buyers from Europe some grades of oil at a price of $25 per barrel. An increase in production a week earlier was also reported in Kuwait and Iraq. Russia also intends to increase oil production from April, when the deal between Russia and OPEC finally ceases to operate, Bloomberg reported.

Most likely, oil market participants are selling oil futures, given in quotes the upcoming sharp increase in supply. It is possible that oil may continue to decline until the price "finds" new levels of support.

Today, oil market participants will pay attention to the publication (at 14:30 GMT) of the weekly data of the Energy Information Administration (EIA) of the US Department of Energy. The data is expected to indicate an increase of 3.256 mln barrels of oil in the US last week after an increase of 7.664 mln barrels in the previous weekly reporting period. This will only increase pressure on oil quotes.

A stronger dollar is also a negative factor for oil prices.

The DXY dollar index, which reflects the value of the US dollar against a basket of 6 other major currencies, is at 100.15 in the first half of today's trading day, near an almost 3-year high.

A strong negative impulse prevails, pushing oil quotes down. In the same time,

the most cautious investors are likely to prefer to stay out of the heavily oversold market for now. But for those who want to take a chance, as always - our trading recommendations:


Trading Recommendations

Sell by market. Stop-Loss 34.10. Take-Profit 25.00, 24.00, 23.00, 20.00

Buy Stop 34.10. Stop-Loss 24.90. Take-Profit 36.20, 42.15, 43.00

DXY-180320-DXY.png


180320-WTI-D.png


180320-WTI-H4.png


*) For up-to-date and detailed analytics and news on the forex market visit Tifia Forex Broker website tifia.com
 
USD/CAD: strong positive momentum

19/03/2020


Given the strengthening US dollar, as well as expectations of a further drop in oil prices, the USD / CAD pair, which reached on Thursday a new high since February 2016 near 1.4668, is likely to maintain positive momentum, at least this week.

Last Friday, the Bank of Canada unexpectedly lowered its key interest rate by 0.50% to 0.75%.

The Bank of Canada said that "lowering the key rate between meetings is necessary due to the coronavirus pandemic, falling oil prices". At the same time, the Bank of Canada has confirmed that it is ready to continue to adjust the monetary policy, "if necessary".

Speaking on Wednesday at a joint press conference with Finance Minister Bill Morneau, Bank of Canada head Stephen Poloz said he did not rule out the possibility of another urgent cut in the key interest rate or any other measures aimed at protecting the economy from the effects of the coronavirus pandemic.

Thus, it cannot be ruled out that before the end of this week the Bank of Canada will again lower its interest rate, bringing it as close as possible to zero.

At the same time, the US dollar continues to strengthen against other major currencies, taking advantage of the status of a protective asset against the backdrop of the coronavirus pandemic. And, the demand for the dollar is likely to continue for the time being, despite the energetic actions of the Fed and the White House aimed at supporting the US economy and weakening the dollar.

Above the short-term support level of 1.4000 (EMA200 on the 1-hour chart), only long positions should be considered.

Despite being overbought, in the event of a breakdown of the local resistance level of 1.4665, USD / CAD growth is likely to continue.

Support Levels: 1.4370, 1.4300, 1.4200, 1.4100, 1.400, 1.3790, 1.3660, 1.3560, 1.3520, 1.3380, 1.3330, 1.3300

Resistance Levels: 1.4600, 1.4665, 1.4700


Trading Scenarios


Sell Stop 1.4360. Stop-Loss 1.4520. Take-Profit 1.4300, 1.4200, 1.4100, 1.400, 1.3790, 1.3660, 1.3560, 1.3520, 1.3380, 1.3330, 1.3300

Buy Stop 1.4675. Stop-Loss 1.4360. Take-Profit 1.4700, 1.4800, 1.4900, 1.5000, 1.6000

190320-DXY.png


D-190320-UCD-D.png


190320-UCD-H1.png


*) For up-to-date and detailed analytics and news on the forex market visit Tifia Forex Broker website tifia.com
 
EUR/USD: negative dynamics

03/20/2020


Despite the aggressive and concerted actions of the world's largest central banks, a turning point on global stock exchanges has not yet occurred.

Last Thursday, the two largest world central banks (the RB of Australia and the Bank of England) again held extraordinary meetings and relaxed their monetary policies. For the second time this month, the RBA lowered its key rate, bringing it to a record low of 0.25% from 0.50%, and launched a quantitative easing program, including in the form of lending to the banking system for at least 90 billion Australian dollars. Earlier, the country's finance minister, Josh Fridenberg, announced additional support for small businesses in the amount of 15 billion Australian dollars.

The Bank of England also took additional extraordinary measures yesterday, in the form of lowering the interest rate to 0.1% (from 0.25%) and announcing additional quantitative easing measures in the form of bond purchases worth £ 200 billion. Thus, the total volume of purchases of bonds will be 645 billion pounds.

The European Central Bank, for its part, also strengthened support for the European economy by presenting on Wednesday a new program for the purchase of European bonds in the amount of 750 billion euros in addition to the two ongoing quantitative easing programs - a regular monthly purchase of assets in the amount of 20 billion euros and announced last week “antivirus” tranche of purchases with a budget of 120 billion euros to be spent before the start of summer.

The US Federal Reserve said Thursday that it would provide billions of dollars to other central banks with a dollar deficit at a rate close to zero.

Nevertheless, investors are still in a state of shock, and the situation with coronavirus is deteriorating.

It is too early to speak about a reversal of the negative trend in the markets. This fully applies to the EUR / USD pair. During today's Asian session, EUR / USD strengthened by attempting to break through the local resistance level of 1.0785 (February lows). However, with the start of the European session, the decline in EUR / USD resumed. A breakthrough of the local support level of 1.0655 (yesterday and 3-year lows) will signal the likelihood of a further decline in EUR / USD.

In an alternative scenario, a signal for purchases may be a break of EUR / USD into the zone above the short-term resistance level of 1.1010 (ЕМА200 on the 1-hour chart).

Support Levels: 1.0655, 1.0600, 1.0580, 1.0530

Resistance Levels: 1.0785, 1.0830, 1.0900, 1.1010, 1.1050, 1.1100


Trading Recommendations


Sell by market. Stop-Loss 1.0840. Take-Profit 1.0700, 1.0830, 1.0900, 1.1010, 1.1050, 1.1100

Buy Stop 1.0840. Stop-Loss 1.0770. Take-Profit 1.0900, 1.1010, 1.1050, 1.1100

200320-EU-D.png


200320-EU-H1.png


*) For up-to-date and detailed analytics and news on the forex market visit Tifia Forex Broker website tifia.com
 
S&P 500: fundamental background is negative

23/03/2020


Having completed the past week with the largest losses since October 2008, futures on major US stock indexes began a new trading week on Monday with a gap down about 3%. Investors are under stress amid the coronavirus pandemic and the fall of the global economy.

The Dow Jones Industrial Average, S&P 500 and Nasdaq Composite fell from record highs reached in February by about 30%. At the same time, the Dow Jones Industrial Average, S&P 500 indices returned to levels of more than 3 years ago (November - December 2016).

At the same time, the fall of stock indices occurs against the background of a sharp decline in oil prices, which is caused both by expectations of a sharp drop in world oil consumption due to the coronavirus and fears about a price war between the world's largest oil producing countries.

At the same time, the dollar continues to enjoy strong demand, strengthening its position in the foreign exchange market. The DXY dollar index rose 5% last week, and continues to rise on Monday. At the beginning of today's European session, the DXY dollar index futures were traded near 103.59, 9 points above the closing price last Friday.

Nevertheless, at the reached critical levels, a local bottom may form, and further growth of indices is possible.

This point of view is supported by the technical aspect of our analysis. On the monthly chart, the S&P 500 futures reached a strategic long-term support level at around 2240.0, through which a 200-period moving average passes.

A growth into the zone above the resistance levels of 2520.0 (ЕМА200 on the 1-hour chart), 2600.0 (Fibonacci level 50% of the downward correction to the growth since February 2016 and the level of 1807.0) may be a signal for the beginning of the stock market recovery and further growth of the S&P 500.

At the same time, below the resistance levels of 2319.0 (ЕМА144 on the monthly chart), 2415.0 (Fibonacci level of 61.8%), only short positions should be considered.

The long-term reduction target is located at the support level of 1900.0 (February 2016 lows).

Downward prevailing amid strong negative fundamental background.

Support Levels: 2240.0, 2180.0, 2020.0, 1900.0, 1807.0

Resistance Levels: 2319.0, 2415.0, 2520.0, 2600.0, 2685.0


Trading Recommendations


Sell Stop 2180.0. Stop-Loss 2320.0. Goals 2100.0, 2020.0, 1900.0, 1807.0

Buy Stop 2320.0. Stop-Loss 2180.0. Goals 2415.0, 2520.0, 2600.0, 2685.0, 3020.0

230320-s500.png


230320-s500-D.png


230320-s500-H1.png


*) For up-to-date and detailed analytics and news on the forex market visit Tifia Forex Broker website tifia.com
 
Back
Top