Tifia Forex Broker Daily Market Analytics, Analytics and trading recommendations by Tifia Company

AUD/USD: Support and Resistance Levels

19/04/2019


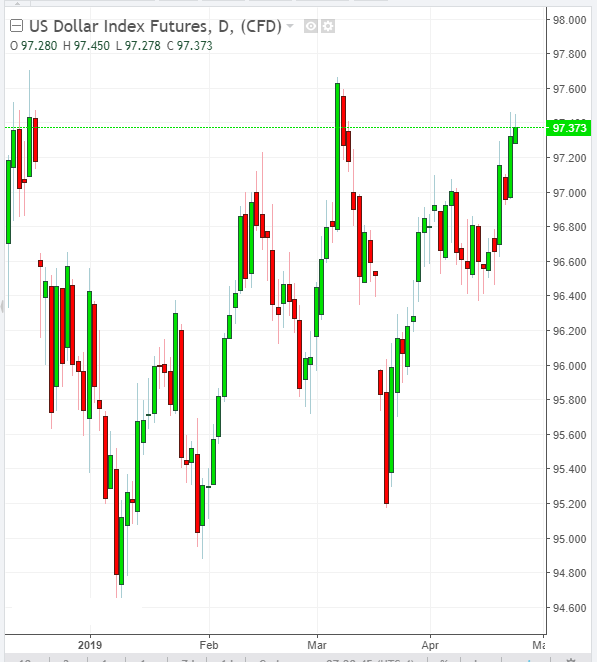
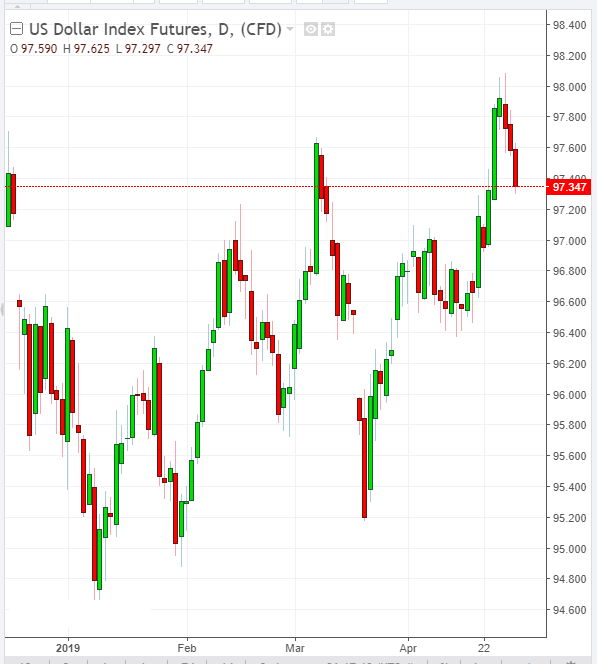
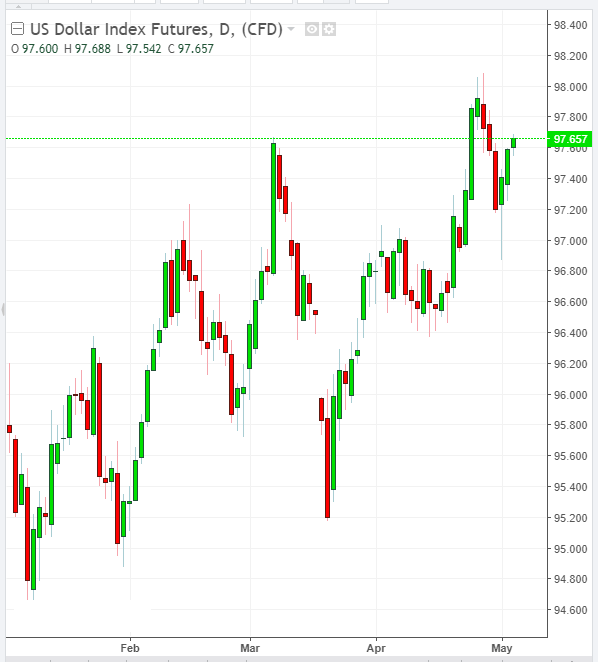
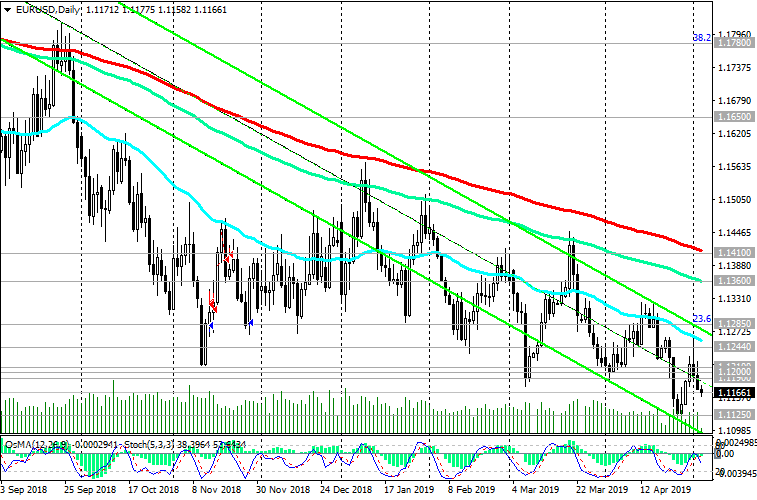
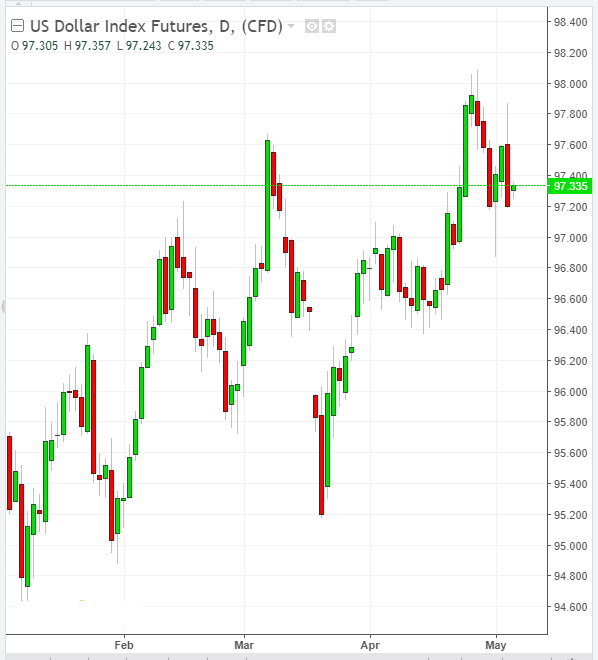
The US dollar strengthened sharply last Thursday. The strengthening of the dollar was triggered by the fall of the euro on weak macro statistics, which came from the Eurozone at the beginning of the European session on Thursday. In the afternoon, the dollar continued to strengthen on positive statistics from the US.

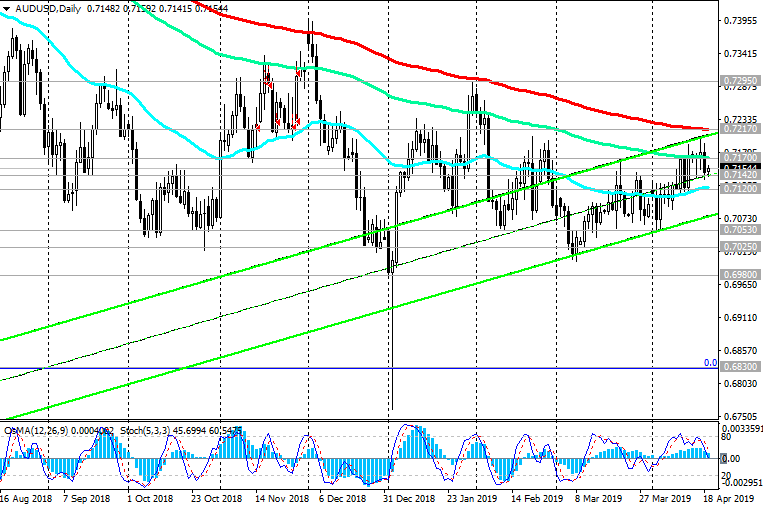
The AUD / USD pair dropped on Thursday by 0.44% to 0.7148. Financial market participants fear that European problems may spread to other regions, weakening demand for commodities.

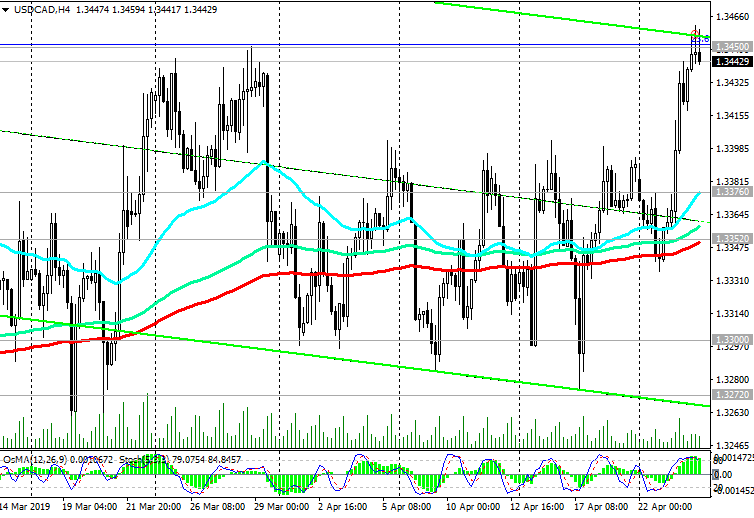
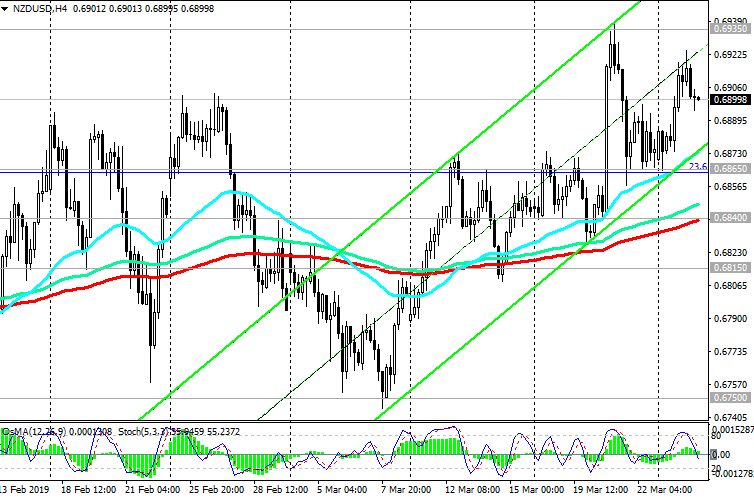
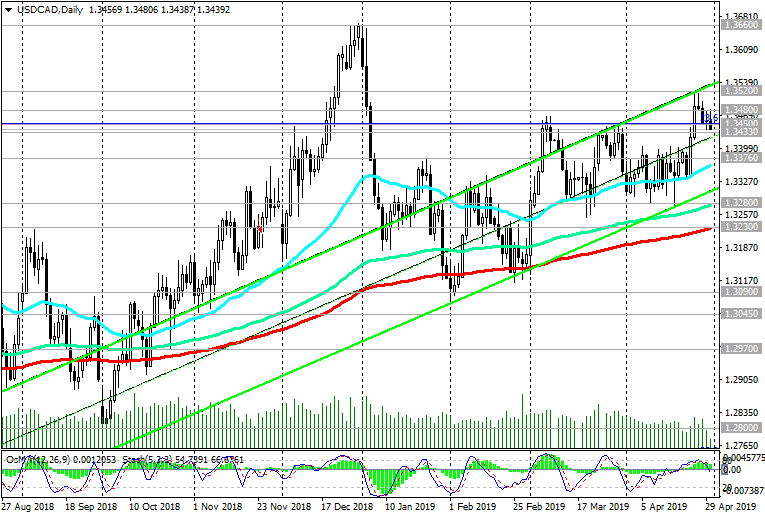
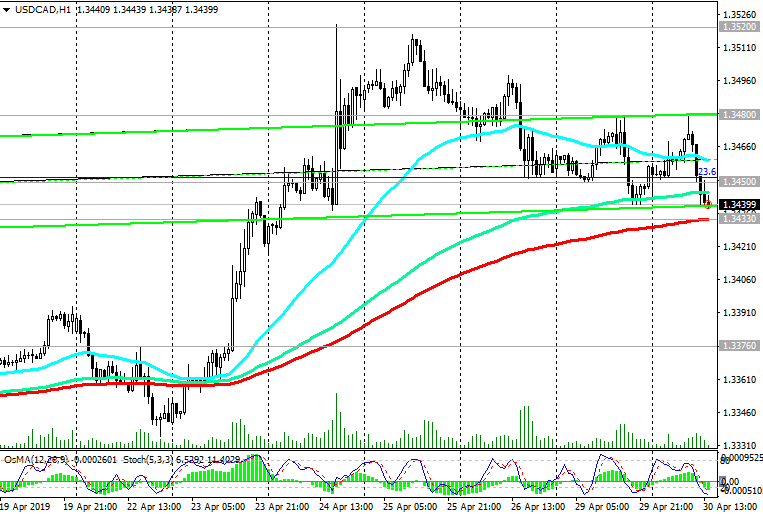
Nevertheless, the indicators OsMA and Stochastic on the 1-hour, 4-hour charts turned to long positions. The resumption of corrective growth can direct the pair AUD / USD to resistance levels of 0.7170, 0.7217. However, growth above the level of 0.7217 is unlikely.

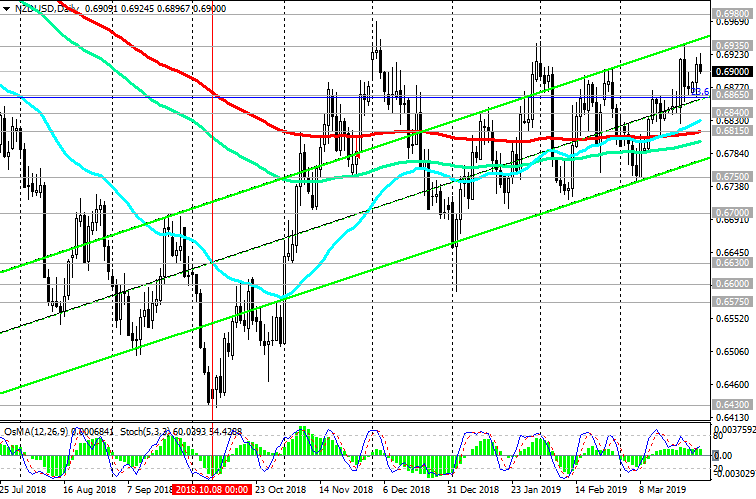
Below resistance levels 0.7170 (ЕМА144), 0.7217 (ЕМА200 on the daily chart) short positions are preferable.

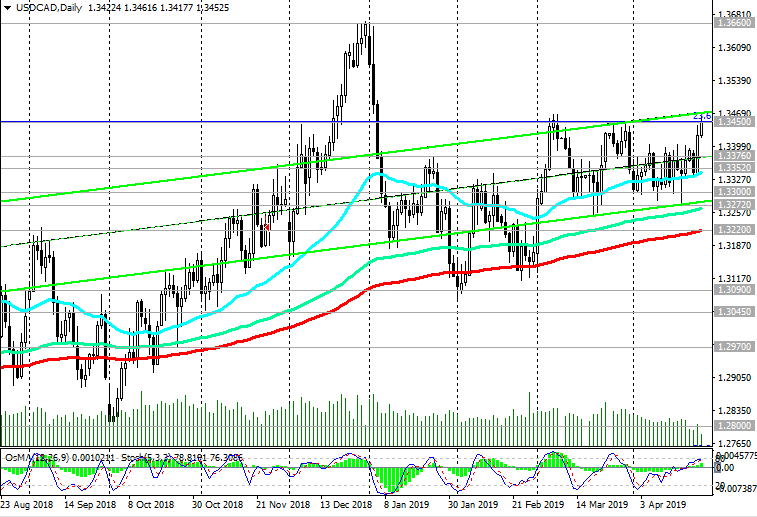
In the event of a breakdown of the support level of 0.7142, AUD / USD will move to the support level of 0.7127 (ЕМА200 on the 4-hour chart, ЕМА50 on the daily chart).

Break of this level will increase the risk of a return to the global bearish trend. In this case, AUD / USD will go towards the support levels of 0.7025, 0.6980, 0.6910 (lows of September 2015), 0.6830 (lows of 2016).

Support Levels: 0.7142, 0.7120, 0.7100, 0.7053, 0.7025, 0.6980

Resistance Levels: 0.7170, 0.7200, 0.7217, 0.7295


Trading recommendations


Sell in the market. Stop Loss 0.7230. Take-Profit 0.7120, 0.7100, 0.7053, 0.7025, 0.6980

Buy Stop 0.7230. Stop Loss 0.7160. Take-Profit 0.7295

190419-AU-D.png


*) For up-to-date and detailed analytics and news on the forex market visit Tifia Forex Broker website tifia.com
 
WTI: Current Dynamics

04/22/2019


In view of the celebration of Catholic Easter (today is the Second Day of Catholic Easter - Easter Monday), the activity of participants in the financial market is small, and the exchanges and banks in Catholic countries are closed.

However, it is worth noting the sharp increase in oil prices from the opening of today's trading day on the background of the news regarding the possible cancellation of indulgences by the US on Iranian sanctions.

At the beginning of the European trading session, the price of WTI crude oil is near the mark of 65.46 dollars per barrel.

Against the background of geopolitical risks that are gaining momentum in the supply of oil, the rally in oil prices may continue. A further rise in oil prices is likely, despite the achievement of new local maxima.


Long-term positive dynamics persist above the key support level of 59.50 (ЕМА200 on the daily chart, Fibonacci 50% level of the upward correction to a fall from the highs of the last few years near the 76.80 level to the support level near the 42.14 mark). Mostly upward trend in the price of WTI crude oil. Long positions are preferred.

Support Levels: 63.50, 61.70, 59.50, 56.50, 55.40

Resistance Levels: 66.00, 68.00


Trading Scenarios


Sell Stop 62.80. Stop Loss 66.20. Take-Profit 61.70, 59.50, 56.50, 55.40

Buy Stop 66.20. Stop Loss 62.80. Take-Profit 68.00, 73.00, 76.00

220419-WTI-D.png


220419-WTI-H1.png


*) For up-to-date and detailed analytics and news on the forex market visit Tifia Forex Broker website tifia.com
 
S&P500: stock index growth slowed

04/23/2019

Current situation


After many days of growth today, the major US stock indices are trading in a narrow range, while maintaining a positive trend.

On Monday, the indices received an additional positive impetus due to the growth of shares in the oil and gas sector due to the jump in oil prices at the beginning of the week.

Oil prices rose sharply after the White House announced that it cancels exceptions to the sanctions on imports of Iranian oil.

Nevertheless, the growth of the indices in recent days has slowed. Investors are waiting for new drivers. On Friday, data on US GDP for the 1st quarter will be published. It is expected that GDP growth slowed down in the 1st quarter to +1.8% versus +2.2% in the 4th quarter of last year. This is negative information for the stock market.

If the data will be even weaker, then this may cause a fall in stock indices.


On Tuesday, the S&P500 is trading in a narrow range near the level of 2905.0. Long-term positive dynamics remains above the key support level of 2753.0 (ЕМА200 on the daily chart).

However, any negative macroeconomic information or weak reporting by large American companies, which is expected later this week, may cause a decrease in indices.

The first signal for the resumption of sales will be the breakdown of the short-term support level of 2898.0 (ЕМА200 on the 1-hour chart).

Support Levels: 2898.0, 2883.0, 2860.0, 2830.0, 2753.0, 2676.0

Resistance Levels: 2918.0, 2936.0


Trading scenarios


Sell Stop 2879.0. Stop Loss 2918.0. Objectives 2860.0, 2830.0, 2753.0, 2676.0

Buy Stop 2918.0. Stop Loss 2879.0. Objectives 2936.0

230419-s500-D.png


230419-s500-H1.png


*) For up-to-date and detailed analytics and news on the forex market visit Tifia Forex Broker website tifia.com
 
USD/CAD: Market Expectations

24/04/2019


On Wednesday, the US dollar continued to strengthen after last week's strong data on US retail sales and after the publication of weak Australian inflation figures on Wednesday, which caused a sharp drop in AUD.

On Wednesday, the decision on rates is made by the Bank of Canada. It will be published at 14:00 (GMT). It is expected that the rate of the Bank of Canada will remain at the same level of 1.5%.

In March, the Bank of Canada did not change its monetary policy. Earlier this month, the head of the Bank of Canada Stephen Poloz again touched upon the monetary policy of the Bank of Canada, recalling that "in March, following the next meeting of the Bank of Canada, we stated that the economic outlook still requires maintaining interest rates below the neutral range".

The April report of Statistics Canada pointed to a slowdown in the Canadian economy in 4Q. Canada's GDP declined in December by -0.1% and grew in the 4th quarter by only 0.4% (the forecast was +1.2% and +2.0% in the 3rd quarter).

In their accompanying statement and report on changes in monetary policy, representatives of the Bank of Canada will explain the position of the bank and assess the current economic situation in the country. The hard tone of the accompanying statement of the Bank of Canada regarding rising inflation and the prospects for further monetary tightening will cause a strengthening of the Canadian dollar. If the Bank of Canada signals to extend the period for maintaining a soft monetary policy or the possibility of a rate cut, the Canadian currency will decline.

*)An advanced fundamental analysis is available on the Tifia Forex Broker website at tifia.com/analytics


USD / CAD increased during the Asian session. In case of a successful breakdown of the resistance level 1.3450 (Fibonacci level 23.6% of the downward correction to the growth of the pair in the global uptrend since September 2012 and 0.9700) USD / CAD will go towards the resistance levels 1.3660 (2018 highs), 1.3790 (2017 highs of the year).

Sales can be renewed after the breakdown of short-term support levels of 1.3376 (ЕМА200 on the 1-hour chart), 1.3352 (ЕМА200 on the 4-hour chart) with targets at the support levels of 1.3272, 1.3220. So far, long positions are preferable.

Support Levels: 1.3400, 1.3376, 1.3352, 1.3300, 1.3272, 1.3220

Resistance Levels: 1.3450, 1.3600, 1.3660, 1.3790


Trading Recommendations


Sell Stop 1.3350. Stop Loss 1.3460. Take-Profit 1.3300, 1.3272, 1.3220

Buy Stop 1.3460. Stop Loss 1.3350. Take-Profit 1.3500, 1.3600, 1.3660, 1.3790

240419-DXY.png


240419-UCD-D.png


240419-UCD-H4.png


*) For up-to-date and detailed analytics and news on the forex market visit Tifia Forex Broker website tifia.com
 
EUR/USD: Current Dynamics

04/25/2019


While disappointing macro data continue to come from Europe and from other countries with the largest global economy, indicating slower economic growth and inflation, more and more investors prefer the dollar.

On Wednesday, the IFO published another block of macro data for Germany, according to which the German business sentiment index IFO in April was 99.2 against 99.6 in March and the forecast of 99.9.

“The German economy continues to lose momentum", says IFO President Clemens Fust.

The slowdown of the German economy, in turn, raises concerns about the weak growth of the entire economy of the Eurozone, and the European Central Bank may be required to further mitigate monetary policy.

On Wednesday, the EUR / USD pair reached another multi-month low near the 1.1140 mark, and on Thursday its decline continues. At the beginning of the European session, the Eurodollar trades near the 1.1130 mark.

Meanwhile, the US dollar is growing, and futures for the DXY dollar index is trading at the beginning of the European session, near the 97.96 mark, 90 points higher than the opening price of the current week.


If the US GDP index for Q1, which will be published on Friday at 12:30 GMT, coincides with the forecast (+ 2.1%) or turns out to be better than it, then the strengthening of the dollar and the fall in EUR / USD will continue. Otherwise, we can expect a rebound of EUR / USD and the beginning of an upward correction with targets at resistance levels of 1.1190, 1.1210, 1.1230 (ЕМА200 on the 1-hour chart), 1.1270 (ЕМА200 on the 4-hour chart), 1.1285 (Fibonacci level 23, 6% of the correction to a fall from 1.3900, which began in May 2014).

Further growth of EUR / USD is unlikely. Most likely, further weakening of EUR / USD with targets located at support levels of 1.1100, 1.1000.

Support Levels: 1.1120, 1.1100, 1.1000

Resistance Levels: 1.1190, 1.1210, 1.1230, 1.1270, 1.1285, 1.1370, 1.1425


Trading recommendations


Sell in the market. Stop-Loss 1.1190. Take-Profit 1.1120, 1.1100, 1.1000

Buy Stop 1.1210. Stop Loss 1.1170. Take-Profit 1.1230, 1.1270, 1.1285

250419-DXY.png


250419-EU-D.png


250419-EU-H4.png


*) For up-to-date and detailed analytics and news on the forex market visit Tifia Forex Broker website tifia.com
 
NZD/USD: Current Dynamics

04/26/2019


As reported at the start of the Sydney trading session on Friday (22: 445 GMT) by the Statistics Bureau of New Zealand, New Zealand’s foreign trade surplus in March was 922 million New Zealand dollars against a deficit of -68 New Zealand dollars in February (the forecast was 131 million New Zealand dollars). New Zealand exports rose by NZ $ 99 million, while imports declined by NZ $ 1 million.

The publication of positive statistics on foreign trade led to the growth of the New Zealand dollar, which also strengthened against the USD.

However, the focus of traders on Friday is the publication of data on US GDP (at 12:30 GMT). It is expected that GDP grew in Q1 by 2.1% (against a growth of + 2.2% in the previous quarter).

GDP data can support the dollar and lower expectations for the Fed to cut rates in December 2019. But the dollar may fall sharply if GDP data turns out to be much weaker than the forecast. The likelihood of such a scenario cannot be excluded, since usually growth in the 1st quarter is the weakest for the year.

In this case, profit will begin to be fixed in long positions for USD, which will cause its decline at the end of the trading week.


NZD / USD is growing for the second day in a row, developing an upward correction after a significant decline this month. A break of the nearest short-term strong resistance level of 0.6666 (ЕМА200 on the 1-hour chart) may trigger a further rise to the resistance level of 0.6745 (ЕМА200 on the 1-hour chart) and to the balance zone near the key level of 0.6800 (ЕМА200 on the daily chart) with the prospect of further growth to resistance levels 0.6865 (Fibonacci level 23.6% of the upward correction to the global wave of the pair's decline from the level of 0.8800, which began in July 2014; the lows of the wave are near the level of 0.6260), 0.6935, 0.6980 (EMA144 on the weekly chart), 0.7060 (EMA200 on the weekly chart).

An alternative scenario implies a breakdown of the local support level of 0.6575 and a decline to the support levels of 0.6510, 0.6430.

Support levels: 0.6630, 0.6575, 0.6510, 0.6430

Resistance levels: 0.6660, 0.6700, 0.6745, 0.6780, 0.6800, 0.6935, 0.6980, 0.7060


Trading recommendations


Sell Stop 0.6620. Stop Loss 0.6670. Take-Profit 0.6600, 0.6575, 0.6510, 0.6430

Buy Stop 0.6670. Stop Loss 0.6620. Take-Profit 0.6700, 0.6745, 0.6780, 0.6800, 0.6935, 0.6980, 0.7060

260319-10-Y.png


260319-NU-D.png


260319-NU-H4.png


*) For up-to-date and detailed analytics and news on the forex market visit Tifia Forex Broker website tifia.com
 
WTI: Current Dynamics

04/29/2019


On Monday, oil prices are rising again after a strong fall the day before. Investors were frightened by Donald Trump’s statement on Friday that he once again offered OPEC to lower oil prices. “Gasoline prices are falling. I called OPEC and said that we need to lower them (oil prices). You (OPEC) need to lower them”, Trump said.

Earlier, President Trump repeatedly appealed to OPEC (on his Twitter account) to increase production and thereby help lower prices. And every time the oil market reacted to this by falling quotes. Also happened this time.

However, Saudi Arabia refused to give an obligation to increase production, and OPEC reported that Trump no longer turned to this organization with new calls with an increase in oil supplies.

According to Baker Hughes’s Friday data, the number of drilling rigs in the United States last week fell by 20 and reached an annual minimum of 805. These data, indicating slowing production in the United States, along with risks of disruptions in oil supplies from Libya and Venezuela, should also support oil quotes.

On Wednesday, May 1 (14:30 GMT) the next weekly report of the Energy Information Administration of the US Department of Energy will be published. Stocks are expected to increase by 2.093 million barrels. This is negative information for oil prices. If the forecast is not confirmed, then the price of oil expects another wave of growth.

Since November, Iranian oil exports have declined from 2.3 million barrels per day to 1.2 million barrels per day in March. The new US approach to solving the problem of reducing the export of Iranian oil (last Monday, the White House announced that the US will not extend temporary permits to import Iranian oil, which expires on May 2) could trigger a new reduction in Iranian oil exports, from 1 million barrels per day up to 500,000 barrels per day.


On Friday, the price dropped sharply, breaking through the strong support level of 63.50 (Fibonacci level 61.8%). Earlier, the price of WTI crude oil reached $66.50 per barrel, a new multi-month high.

The price maintains a positive trend, being above the key support level of 59.50 (ЕМА200 on the daily chart, Fibonacci 50% of the upward correction to a fall from the highs of the last few years near the 76.80 mark to the support level near the 42.14 mark). From a strong short-term support level of 61.95 (EMA200 on the 4-hour chart) a rebound and renewed growth is possible.

Only a breakdown of support levels of 56.50 (ЕМА200 on the weekly chart), 55.40 (Fibonacci 38.2%) will revive the bearish trend.

Above the support level of 61.95 long positions are preferable.

Support Levels: 61.95, 59.50, 56.75, 55.40

Resistance Levels: 63.50, 64.40, 66.50, 68.00


Trading recommendations


Sell Stop 61.60. Stop Loss 63.60. Take-Profit 59.50, 56.75, 55.40

Buy Stop 63.60. Stop Loss 61.80. Take-Profit 64.40, 66.50, 68.00

290419-WTI-D.png


290419-WTI-H4.png


*) For up-to-date and detailed analytics and news on the forex market visit Tifia Forex Broker website tifia.com
 
USD/CAD: Before Important Events

30/04/2019


According to data published at the beginning of today's Asian session, the official Purchasing Managers Index (PMI) for the non-manufacturing sector in China fell to 54.3 in April from 54.8 in March. The index for the non-production sphere reflects the dynamics of activity in such areas as retail, air travel, software development, real estate market and construction. The decline was due to a weakening of demand and activity in construction.

The official PMI for the manufacturing sector in China also fell in April, to 50.1 from 50.5 in March. The decline in the index was due to the weakening of production and domestic demand.

According to Caixin, PMI for China's manufacturing sector in April was 50.2 against 50.8 in March. Unlike the official index, which reflects the dynamics of activity of large state-owned companies, PMI Caixin pays more attention to the status of private producers.

The data presented caused a short-term strengthening of the US dollar, primarily against the RMB and commodity currencies, including the Canadian dollar.

In the course of the European session, the dollar is falling again. Investors are switching their attention to future important events. On Wednesday (18:00 GMT) the decision of the Fed on the interest rate will be published, and on Friday (12:30 GMT) - data from the US labor market.

Some economists expect the Fed to cut rates in December due to lower US inflation rates. Comments by Fed officials and labor market data will provide insight into the current state of the US economy and give the dollar a new impulse, either for growth or for decline.


Despite the current decline, USD / CAD maintains a long-term positive trend, trading above key support levels of 1.3280 (EMA144), 1.3230 (EMA200 on the daily chart). The breakdown of local resistance levels of 1.3480, 1.3520 will be a signal for the resumption of long positions with targets at resistance levels of 1.3660 (highs of 2018), 1.3790 (highs of 2017).

Support Levels: 1.3433, 1.3400, 1.3376, 1.3300, 1.3280, 1.3230

Resistance Levels: 1.3480, 1.3520, 1.3600, 1.3660, 1.3790


Trading Scenarios


Sell Stop 1.3425. Stop-Loss 1.3490. Take-Profit 1.3400, 1.3376, 1.3300, 1.3280, 1.3230

Buy Stop 1.3490. Stop Loss 1.3425. Take-Profit 1.3520, 1.3600, 1.3660, 1.3790

300419-DXY.png


300419-UCD-D.png


300419-UCD-H1.png


*) For up-to-date and detailed analytics and news on the forex market visit Tifia Forex Broker website tifia.com
 
EUR/USD: Current Dynamics

Eurodollar continues to decline. At the beginning of the European session on Friday, EUR / USD is trading at 1.3020. Pending publication (12:30 GMT) of a report from the US labor market, trading volumes are declining. If the report (average hourly wage, the number of new jobs created outside the agricultural sector, the unemployment rate) will be better than the forecast (+ 0.3% (against + 0.1% in March) / 180,000 (against 196,000 in March ) / 3.8% (against 3.8% in March)), then the strengthening of the dollar and the fall of EUR / USD will continue.

The alternative scenario implies a rebound and the beginning of an upward correction of EUR / USD with targets at resistance levels of 1.1190, 1.1200 (ЕМА200 on the 1-hour chart), 1.1210, 1.1244 (ЕМА200 on the 4-hour chart). A more distant goal of the correction is resistance levels of 1.1255 (ЕМА50 on the daily chart), 1.1285 (Fibonacci level 23.6% of the correction to the fall from the level of 1.3900 started in May 2014), 1.1360 (ЕМА144), 1.1410 (ЕМА200 on the daily chart). Below resistance level 1.1285 short positions are preferable.

Support Levels: 1.1125, 1.1100, 1.1000

Resistance Levels: 1.1190, 1.1200, 1.1210, 1.1244, 1.1285, 1.1360, 1.1410


Trading recommendations


Sell in the market. Stop Loss 1.1220. Take-Profit 1.1125, 1.1100, 1.1000

Buy Stop 1.1220. Stop-Loss 1.1155. Take-Profit 1.1244, 1.1285, 1.1360, 1.1410

030519-DXY.png


030519-EU-D.png


030519-EU-H4.png


*) For up-to-date and detailed analytics and news on the forex market visit Tifia Forex Broker website tifia.com
 
XAU/USD: current dynamics

06/05/2019


US President Donald Trump once again shocked the markets with his statement. On Sunday, he tweeted: “For 10 months, China paid the US $ 50 billion in high-tech products at a rate of 25% and 10% in other products worth $ 200 billion. These payments partially explain our huge economic success. These 10% will increase to 25% on Friday". He also wrote about the imminent imposition of duties in the amount of 25% on imports of goods that were not subject to duties from China in the amount of $ 325 billion.

Chinese yuan and Chinese stock indexes collapsed at the opening of the trading day on Monday.

Quotes of gold again crawled up. The pair XAU / USD at the beginning of the European session was trading near the mark of 1282.00, above the key support level of 1275.00 (ЕМА200 on the daily chart).

Above the key support levels of 1277.00 (Fibonacci level 61.8% of the correction to the wave of decline since July 2016), 1275.00 (EMA200 on the daily chart), the upward trend prevails. The XAU / USD growth targets are resistance levels of 1312.00, 1323.00, 1345.00 (highs of February and 2019).

An alternative scenario involves the breakdown of the support level of 1268.00 and

decrease of XAU / USD in the direction of the important support level of 1248.00 (Fibonacci 50%). Breakdown of this level will return XAU / USD to the global bearish trend with targets at support levels of 1197.00 (November lows), 1185.00 (Fibonacci 23.6%), 1160.00 (2018 lows).

Support Levels: 1279.00, 1277.00, 1275.00, 1268.00, 1248.00

Resistance Levels: 1288.00, 1296.00, 1312.00, 1323.00, 1345.00, 1357.00, 1365.00, 1370.00


Trading Scenarios


Sell Stop 1274.00. Stop Loss 1288.00. Take-Profit 1268.00, 1248.00, 1234.00, 1220.00, 1197.00, 1185.00, 1160.00

Buy Stop 1288.00. Stop Loss 1274.00. Take-Profit 1296.00, 1312.00, 1323.00, 1345.00, 1357.00, 1365.00, 1370.00

060519-DXY.png


060519-XU-D.png


060519-XU-H4.png


*) For up-to-date and detailed analytics and news on the forex market visit Tifia Forex Broker website tifia.com
 
Back
Top