• Please try to select the correct prefix when making a new thread in this folder.

    Discuss is for general discussions of a financial company or issues related to companies.

    Info is for things like "Has anyone heard of Company X?" or "Is Company X legit or not?"

    Compare is for things like "Which of these 2 (or more) companies is best?"

    Searching is for things like "Help me pick a broker" or "What's the best VPS out there for trading?"

    Problem is for reporting an issue with a company. Please don't just scream "CompanyX is a scam!" It is much more useful to say "I can't withdraw my money from Company X" or "Company Y is not honoring their refund guarantee" in the subject line.
    Keep Problem discussions civil and lay out the facts of your case. Your goal should be to get your problem resolved or reported to the regulators, not to see how many insults you can put into the thread.

    More info coming soon.

Trade-Vantage.com

. . . So, any updates? Think Dustin will offer to join the FPA's Performance Test Program? :)
Pharaoh, Admnistrators, Phantoms, FPA Members, Suckers, and Scammer(s),
.
Today I launch a full-blown 90-day forward test of TradeVantage AUE V1.0 from Herr Dustin Pass and Konstantin.
I have spent two weeks on and off, studying and implementing this complex Neural Network System.
I will attempt to explain what this is really about, what was omitted, and what was mis-stated during marketing; and together we shall see if this method is useful or not.
.
To start, I wish to thank Konstantin for providing me with the opportunity to perform this test. I wish it understood, as I have already stated several times, I am uncertain as to the degree to which Konstantin is a knowing participant in this appauling marketing fiasco. All I can say is that he has provided me with access to it and offered his support. I can also add that as I originally expected, Konstantin appears to be a knowledgeable programmer and computer scientist of high order, with weak English skills, which may have contributed to his being abused in business. However, I have no insight into his motivations, or his knowledge of securities law or business ethics.
.
The NN system Konstantin developed and Dustin Pass marketed obtains simple, raw daily OHLCV data from their dedicated, private server. It is accumulated and continuously updated for local user updates. The local user's client is to refrain from performing these updates except at three specific times each trading day, geared toward the convenience of forex traders around the globe. The client system expects and requires this once-a-day "Updating" to be done manually, at a very specific time. Failure to observe this restriction results in a partial current day bar that unduly influences the signaling. I consider this to be a design weakness. This updating should be automated in any future version upgrade releases. In addition, the server should not provide partial daily bars to the client, to avoid the likelihood of inaccurate calculations.
.
Users have a choice of executing daily trades on daily bars that close at the top of these (GMT-4) hours:
8am ET, the NY Market Open
3am ET, the London Market Open, or
7pm ET, the Asian Market Open.
.
Once a Time Zone is selected, the local client price bars will be generated based only on that chosen market's Close/Open time. Therefore, trading the system on three different time zones with differing results is entirely possible. This is a normal condition of trade for any Daily Charting system, including this one.
.
For this test I have chosen to use the Asian Open at 19:00 (7pm ET) for several reasons:
1- The trading week begins on Sunday at 5pm ET and ends at 5pm on Friday. This should produce 5 nearly equally lengthy time bars per week; Monday - Friday, plus a 2-hour bar for Sunday. This bar will emphasize weekend gaps of importance with high volume for analysis purposes, and be small and unremarkable in the calculations at all other times. Monday will be a 22 hour bar, as will be Friday. In my opinion, any other time zone choice would produce more compromised structures.
.
2- The majority of the world's daily forex trading volume on any given day will be fully contained within these daily bars. In addition, trade volume and price movement is generally minimal between rollover time (5pm ET) and the Asian Open, which really doesn't get underway until 8pm ET when Japan opens.
.
3- News events are very often scheduled for precisely 3am and 8am. This means added variability and uncertainty of obtaining consistent, non-chaotic updates of the daily bar charts close/open at the very moment all pairs are to undergo updating, analysis, and order entry. Ed: I consider this a serious design flaw in this program. The 7-8pm ET hour avoids almost all news, and provides the end-user a sufficient time window to accomplish the manual batch update and calculation process, plus time to consider and enter the daily trades with minimal slippage.
.
4- I have too much else going on at those other market opens to worry about this daily system.
.
Once the data is obtained, the newly minted system needs to receive its initial training. The system knows nothing about prediction without self-training. NNs work by breaking the problem of prediction down into a series of simpler questions, assigning a process to analyze each item, then combines the results from all the subordinate processes to find the best result. To the best of my understanding this system utilizes 3 Moving Averages, a Zig-Zag reversal pattern, plus preference inputs: expected trade frequency, trading style, and desired noise filtration. The number of layers and the number of neurons is adjustable, with the known trade-off being the computing time necessary to work all the elements is proportional to the required granularity.
.
Konstantin provides one basic "Type 1 Default" condition set, plus 4 additional pre-packaged Types for a total of 5 stock models, all with reasonably quick learning times of about 10 minutes per pair for 1-yr historical data sets. Together these 5 models yield better or worse results once learned on a given data range, due to the differing nature of the particular pairs being tested. The idea is to train each pair on all models ranging from "Inert" through "Chaotic", then select the model that can be said to have performed best over the input data period, for each pair.
.
Now here in lies the LIE!
Once calculated, the models reveal how they would have signaled during the learning period had each model indeed known this precise future data in advance! That is all a NN can do; find the best curve fit! The presumption is, that the past is prologue, and should this pair behave in the future as it did in the past, the curve fit strategy should be profitable. Therefore, it signals you to trade in the anticipated direction; but, possibly right into a brick wall (Roadrunner: Beep-Beep).
.
Ed: Now in physical systems like vibration analysis, fluid dynamics, aero-dynamics, such curve-fit methodologies have a strong correlation with reality, simply because the laws of physics are presumably immutable, and well studied molecules can be expected to behave in a predicatable manner. However, when it comes to chaotic, irrational, human behavior, these methods often have no known corollary in the physical world, behavior approaches random, and thus the basic theorem brakes down.
Therefore, those signals generated and displayed that occurred during the training period have no real relevance at all, either past or future. Only in the limit, as volatility approaches zero (calmest waters) does future reality approach the models' predictive result. Any market movement at all forces the model to later take the new information into account, and therefore, it is always certain to be wrong to some degree. That error is inversly proportional to the the complexity of the model, increases with the time that has elapsed since the last learning cycle, and with the quantity, accuracy, and length of the historical data included in the learning cycle, and with the current price volatility relative to the typical volatiltiy experienced during the learning cycle.

.
So it was on those retroactively optimized, curve-fitted, psuedo-results, that Herr Dustin and Company marketed this hope-filled product to you; touting phantom "learned curves" as "Past Performance"; as though these signals had actually occured in real time. Nothing could be further from the truth.
What a sin.
.
One might ask: "How certain can we be that the future will resemble the past"? My answer: "Not very certain at all". However, in order to permit a fair and proper test on each model's predictive results, NN program designers by design, provide a mechanism to Learn on a "Range of Data" from the past; but most importantly, also allow for the intentional exclusion of the most recent data from the "Learning Process". These excluded bars are intentionally held in reserve, so the finished, educated model can later be asked to make predictions on the "Real and most Recent" future data, without having had any prior exposure to it.
So certain recent daily bars can, and should be held "Out-of-Sample" during the learning process; then later used to confirm how well the model performs, had it been trained in the recent past and then allowed to signal its way forward into the future.
Later re-learning brings into the model all that data that was previously excluded, yet still leaves an unincorporated "Tail" for again projecting forward; and on you go, over and over again.
.
Ed: Konstantin and Dustin Pass certainly know all this in detail, for Konstantin indeed wrote it into the program! Furthermore, K openly suggests retraining the model every two to three weeks, a normalcy for this type of analysis. Yet, none of this was even hinted at in the sales presentations; and worse, was openly denied by their intentionally "kept ignorant" support team.
.
This Test.
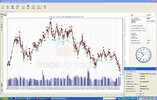
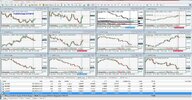
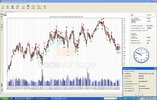
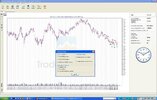
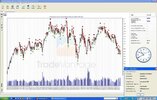
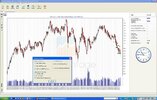
In order to obtain the best results possible, I selected only the 12 most liquid and poorly correlated pairs from the 23 available on their server (~50%). I then built 60 learned models (5 for each pair), training for "The best combination of winning trades and profitability", rather than for "Maximum Profits" as was used in the public marketing. See the illustrated attachments. Also, the public reveal was done using the Default Model (Type 1), and with just 1-year of historical data.
.
In order to obtain even better results, I utilized 18 months of backdata; and initially excluded the last 30 days from the learning process. I then reviewed the 60 learned models for performance and drawdown. More importantly, I then pushed the models to predict over the latest 30 days. The results in every case were nowhere near as good as the models' learned outputs suggested they might be. I compared results from each group of 5 tests, and for 10 of the 12 pairs, I selected the most desireable model. Two pairs, had results so poor, that I chose to invoke the NN program's Advanced Function, enabling me to build deeper models, with more layers and neurons, and incorporating the better testing characteristics gleaned from the 5 basic runs. You will see these marked as type "Custom B" in the screenshots I have attached. Once I finished building the 12 most reasonable models, I then built 12 identical new models using these results and trained them on the full 18 months of data, right up thru the current date (June 2).
.
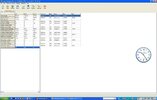
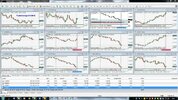
At 7pm tonight I "Updated" the models with the Sunday, June 3 Bar of 2 Hours, precisely at 19:00; and within the next 30 minutes I entered positions on 4 trades, signaled as new opens for tonight, or where I could enter those trades already in progress as signaled earlier, where I could get price advantage over the original entry price, and which were not too deep in the hole. Some existing trades in progress, where they were in extended gains or in deep drawdown, I ignored. Soon I will be synced up, as trades open and close day-over-day.
.
The demo test account is running at ATC Brokers, an ECN/STP provider clearing FXCM, and which charges commission. See my review of ATC on the Brokers Review page.
This daily trading model should be very insensitive to broker spreads. Stop Loss is placed at 2 times the max drawdown seen during the learning period, which can be quite large, so I am limiting position size to 0.10 standard lot per position on a $40K account. With 12 pairs, our max position size will be 1.2 lot at any one time, with an average size likely below 1 lot.
As of tonight, 4 trades are open. Again, see attached screenshots.
.
I hope everyone involved will benefit from this precision test.
 

Attachments

  • Opening Trades 20120603.jpg
    Opening Trades 20120603.jpg
    250.9 KB · Views: 13
  • AUDCAD 20120602-1.jpg
    AUDCAD 20120602-1.jpg
    250.2 KB · Views: 12
  • AUDCAD 20120602-2.jpg
    AUDCAD 20120602-2.jpg
    207.8 KB · Views: 7
  • AUDUSD 20120602-1.jpg
    AUDUSD 20120602-1.jpg
    248.1 KB · Views: 8
  • AUDUSD 20120602-2.jpg
    AUDUSD 20120602-2.jpg
    232 KB · Views: 9
Last edited:
TradeVantage Pro AUE V1.0 Forward Test
.
THE FINAL RESULTS ARE IN !
HALLELUJAH, this test is finally DONE ! August 10, 2012.
I proffer this Opus shall stand as definitive and unassailable, unless proven otherwise.
.
After 68 days trading 13 pairs, the TradeVantage results have proven indistinguishable from those expected from a "Random Walk" (Dartboard, Coin-Flip, Daisy Petal Pluck).
.
As far as I am concerned TradeVantage is Dead and Buried. Not only did the model prove unable to meet the challenge I posed to produce just 50% of the claimed performance; but, it turned out to be a net loser, despite my best efforts to train and execute the trades it recommended with rigor. That came as a surprise to me. Had Dustin Pass had the guts to accept my challege, he would now owe me $10,000. Not one word has been transmitted to me from this sleazeball, since day one.
.
Find the MT4 Detailed Account Statement plus the Tracking Excel Spreadsheet attached, for a full analysis.

.
Updated July 31, 2012 1:48am EDT (GMT-5).
Most of the smallish %loss experienced was attributable to a combination of my missing a single day of timely executions on July 26th; plus the typical drag of spreads and commission costs incurred on the total 92 positions. This Neural Network Model known as "TradeVantage" written by Russian programmer Konstantin and marketed by Herr Dustin Pass, to a plethora of numbskulls for a freakin' fortune ($2,000 a pop); has shown Absolutely no indication of having any underlying merit.
I spent at least 1.5 hrs per day on this project for the past 3 months, plus the time to write and carefully edit this post daily.
I can honestly report to all at this point: TradeVantage V1.0 AUE is a fabulous waste of time, effort, and capital.
.
I will post my Final Test Report, its trade-by-trade analysis spreadsheet, and the Demo Account Detailed Statement, once the entire current cycle of open trades closes-out, sometime in the near future. I will also copy Konstantin and ask for any rebuttal he might wish to offer, independently of Herr Dustin Pass. If he permits, I will publish his remarks here. If not, I will post his non-response or his denial to permit his response to be published here, as well.
.
I again extend every opportunity for Konstantin to contibute and defend his model here at every turn.
Herr Dustin has achieved no increase in credibility off his -10 rating with me, following this exhaustive proof (poor boy).
I only wish he had accepted my $10,000 challenge to demonstrate this model could be profitable; for the program has indeed proved itself an absolute loser, not just a limping weak performer. Indeed it underperformed even my expectations!

Had he accepted my challenge, I would have been fully victorious on my prediction of total failure; and would now be due from him the compensation I deserve to somewhat reimburse me for my time and effort in performing this extensive, precision test. Oh, well; did I expect anything else from this creep? Not me. Instead, I must content myself with the simple knowledge that I have completely, definitively, and fatally debunking this signifigant fraudster; even though it was a costly exercise for me personally, to do so.
.
Drop dead, Dustin. I am embarrassed and ashamed to say I have lived to bury some far more professional crooks than the likes of you; but, you have added another new little notch to my belt of decency over shame.
AI
==========================================================================

ANNOUNCEMENT:
THE TEST PARAMATERS WERE ALTERED FROM CONSERVATIVE TO MODERATE FOR JULY.
EQUITY GAIN(LOSS)% WILL BE TRACKED FOR EACH MONTH, AND ALSO IN THE AGGREGATE.
SPECIAL NOTE:
I WAS UNABLE TO EXECUTE TRADES FOR JULY 26. THIS HAS RESULTED IN A SLIPPAGE LOSS OF ~ $1,000.00.
ATTEMPTING TO MANAGE THE DISCREPANCIES TO RECOVER THE LOSSES THAT HAVE OCCURRED AS A RESULT.
=====================================
DAILY SUMMARY
DATE & TIME (Broker Server Time, GMT+3)
20120810 02:45
.
CLOSED TRADES
CLOSED TRADES GAIN(LOSS)
$(-1,384.68)
.
OPEN TRADES
CURRENT GAIN(LOSS)
$ 0.00
.
AGGREGATE EQUITY GAIN(LOSS)
$(-1,384.68)
.
ACCOUNT BALANCE
$ 39,171.67
.
ACCOUNT EQUITY
$ 39,171.67
.
AUGUST EQUITY GAIN(LOSS)
(-0.74)%
.
AGGREGATE EQUITY GAIN(LOSS)%
(-3.41)%


.
=====================================
JUNE RISK PARAMETERS - Conservative
MAX OPEN POSITIONS
13 x 0.10 = 1.3 Std. Lot ($130,000)
MAX LEVERAGE
3.25:1
TYPICAL LEVERAGE [Considering trade correlation offsets and ~ 80% open positions at any one time]
(2.0 +/- 0.5):1
TYPICAL RISKLEVEL [Based on Stop Loss always = 2 x Max Drawdown for each pair's history during prior its 18-month NN training]
2.5% +/- 1.0%
.
JULY RISK PARAMETERS - Moderate
MAX OPEN POSITIONS
13 x 0.30 = 3.9 Std. Lot ($390,000)
MAX LEVERAGE
10:1
TYPICAL LEVERAGE
(6.0 +/- 1.5):1
TYPICAL RISKLEVEL [Based on Stop Loss always = 1.5 x Max Drawdown for each pair's history during prior its 18-month NN training]
5.5% +/- 2.25%
.
AUGUST RISK PARAMETERS - Aggressive NEVER IMPLEMENTED.
MAX OPEN POSITIONS
13 x 0.60 = 7.8 Std. Lot ($780,000)
MAX LEVERAGE
20:1
TYPICAL LEVERAGE
(12.0 +/- 3.0):1
TYPICAL RISKLEVEL [Based on Stop Loss always = 1 x Max Drawdown for each pair's history during prior its 18-month NN training]
7.5% +/- 3.0%
.
=====================================
JUNE
STARTING DATE
20120603
STARTING BALANCE
$ 40,556.35
ENDING BALANCE
$ 40,774.50
JUNE EQUITY GAIN(LOSS)%
+0.18%
JUNE PIPS (COMBINED CLOSED AND OPEN)
+338
.
JULY
STARTING DATE
20120701
STARTING BALANCE
$ 40,774.50
ENDING BALANCE
$ 39,461.91
JULY EQUITY GAIN(LOSS)%
(-5.24)%
AGGREGATE EQUITY GAIN(LOSS)%
(-4.62)%
.
=====================================
PLEASE NOTE: THE EMBEDDED LINKS THAT MAY HAVE BROUGHT YOU HERE FROM THE SCAM FOLDERS ARE DESIGNED TO HIT POST# 52 (THIS ONE).
AS FOLKS ADD COMMENTS, YOU WILL FIND THEM AS LATER POSTS. USE THE PAGE SELECTOR LINKS AT THE TOP RIGHT OF THIS PAGE TO FIND THEM.
.
Beginning June 12, I have implemented a 2-day delay in the weekly Detailed Statement updates.
This was done after the first week of real-time posts in fairness to the developer, to inhibit anonymous trade copying by poachers.

.
Download the attached "TradeVantege Test.zip" file below, to get the latest Detailed Statement.
.
The Detailed Statement will be uploaded here weekly on Tuesday, after the 7pm ET update.
It will include the results and open positions thru the prior:
Sunday Open at 5:00pm ET Sunday, where trades projected from the Friday Bar Close will have been executed, plus the
Monday Open at 7:00pm ET Sunday, where trades projected from the Sunday Bar Close will have been executed.
[Note: The Sunday Daily Bar is just 2-Hours in length when viewed on the Asian Daily TimeFrame.]
.
Calculations for the Sunday 5pm ET Open are done over the weekend before the forex markets open for the week.
Those Sunday trade signals are then manually executed within 30 minutes of the Sunday Open, as liquidity best provides.
Another round of calculations are then done for the Monday Open @7pm ET Sunday, just 2Hrs later, and manually executed within the next 30 minutes.
The Friday Bar is just 22Hrs in length, since the market week closes at 5pm ET.
.
This ultimately results in 6 Daily Bars (Sun-Fri) per week: 2Hr Sunday + (4 * 24Hrs) + 22Hr Friday) = 120Hrs (equivalent to 6*24) per week.
.
In addition to the weekly Detailed Statement, the above "Summary Report" will be updated daily, soon after that daily trades have been executed, at 7pm ET.
The Summary's "Date and Time" are referenced to the Broker Server Time, where Rollover time is defined as 00:00 (on GMT+3).
.
 

Attachments

  • EURUSD 20120602-1.jpg
    EURUSD 20120602-1.jpg
    124.4 KB · Views: 15
  • EURUSD 20120602-2.jpg
    EURUSD 20120602-2.jpg
    251.5 KB · Views: 9
  • 20120605.jpg
    20120605.jpg
    245.7 KB · Views: 10
  • TradeVantage Test.zip
    14.1 KB · Views: 5
  • TradeVantage Forward Test.zip
    28.5 KB · Views: 5
Last edited:
Big T1, I had tradevantage for a little while, and i too did forward testing of one month, but my time was running out for my refund so i cashed in as i didn't have enough time for further analysis. One of the things i did find was that when you train a pair with a certain model and test it, when you train it again you can get entirely different results. This is true even if all the settings are exactly the same. Konstantin pointed out that their will always be small differences, however, i found even on retraining the new model again and again got entirely different results each time it was trained even though all the criteria are the same. When i was testing i was hoping to hide the 30 days from it, forward test it on the hidden 30 days, obtain the best results and then use those settings and just add the new 30 days to the training and your complete. However, when you add the next 30 days to the training the entire results are wildly different. and if you just train it again (with the same settings) you get an entirely different result again. So in the end you have no clue to how it will trade at all.

Dave
 
Big T1, I had tradevantage for a little while, and i too did forward testing of one month, but my time was running out for my refund so i cashed in as i didn't have enough time for further analysis. One of the things i did find was that when you train a pair with a certain model and test it, when you train it again you can get entirely different results. This is true even if all the settings are exactly the same. Konstantin pointed out that their will always be small differences, however, i found even on retraining the new model again and again got entirely different results each time it was trained even though all the criteria are the same. When i was testing i was hoping to hide the 30 days from it, forward test it on the hidden 30 days, obtain the best results and then use those settings and just add the new 30 days to the training and your complete. However, when you add the next 30 days to the training the entire results are wildly different. and if you just train it again (with the same settings) you get an entirely different result again. So in the end you have no clue to how it will trade at all. Dave.

Hello Dave [gibbon]. Glad to make your acquaintance.
.
I am delighted to have you respond to my review and test, publicly. I have heard from a few other users privately, who were too embarrassed to reveal themselves here. Let me just say, you are not alone in your experience. I think I can help you understand what your keen observations revealed to you in your own testing, which I confirm are all correct; but which do not necessarily invalidate the accuracy or usefulness of the NN approach, nor indicate a coding error.
.
First, let me applaud your good sense in demanding a refund within the allowable time limit. I hope you received your money back. Were you a full-price buyer at $2K or did you get one of Herr Dustin's "Dinged - preowned, returned goods models" offered for $997 a week later? You know, Herr Dustin claims to have been a grease monkey prior to becoming a failed, unlicensed, forex 'money manager' (with small 'M's) and Internet Scammer (with Caps). I think his Used Car Salesman background kicked in here, as his high-pressure marketing effort backfired in his face.
But I digress. Please forgive my self-indulgence in bashing this creep. I enjoy it so much, and he makes it so easy.
.
In order to fully comprehend what you accurately observed, you really need a strong understanding of Calculus. I reached my personal limit in mathematics beyond the sixth dimension, and at Bessel Functions. In spite of this, and for the benefit of the typical reader I will try to explain verbally, some very complex concepts.
.
Most traders are familiar with market "Indicators" that are all based on varying length historical periods, to suggest how this particular herd of animalae will likely behave next. But in each and every case, common indicators always lag the leading edge data.
Imagine you are driving your car with your driver's seat facing rearward, knowing that in Manhattan, the distance between many Blocks and Avenues are built on a fixed dimensional grid. So you could conceivably approach each intersection with caution, know where the curb and cross-traffic likely are ahead, even though you can't see it.
It can be done, but you'd better drive slowly and hope there are no baby carraiges, cabs, or open manholes in your path. You might be able to get from 3rd Ave and 17th St to 8th Ave at 42 St by just watching your distance to the curbs, and knowing where it is likely you can turn and still be in the street. Many have pondered this problem, and some smart allic math majors decided to take an entirely different approach.
.
Enter Neural Networks.
In the 17-19 centuries, several key mathemeticians and scientists came to understand how to describe the physical universe, prior to Einsteinian Relativity and Quantum Mechanics (which again changed the world in new ways). Using the mathematics of the classical world, it has been proven that any "continuous" waveform as seen relative to any one dimension, can be accurately described by a series of Sine Waves in that dimension of varing Amplitude and Frequency, when added together in various Phase Relationships against each other.
So any seemingly random squiggly line you can draw that doesn't double-back on itself can be resolved into a group of pure sine waves, as long as you don't lift the pencil from the paper while drawing it. If you lift the pencil, you create a "Discontinuity", which can't be handled with this methodology. In the natural world discontinuities are rare, and when they do occur, things die. Like your local Sun star explodes, or an Asteroid crashes into Earth and makes Dinasaurs extinct. But for designing a pipe organ, an airplane, or predicting the approximate orbit of Venus, these classical methods are very useful. Indeed it was the observed deviations from these classical predictions that led Einstein to conceive his Theory of General Relativity.
.
Markets (humans) however, provide discontinuities all the time. Every market close and open forms a discontinuity. In forex these occur weekly. These discontinuities along with scheduled news announcements are known in advance, and therefore can be dealt with in predictive modeling. But Breaking News events, technical malfunctions, and crooked brokers cause unpredictable discontinuities.
.
In an attempt to handle these problems, Mathemeticians analyze these waveforms by deconstructing them, performing the analysis and reassembling the results into a psuedo-waveform that as closely as possible mimics the original. By the use of "Fast Fourier Transforms", information that is stored in the curve existing in our world of linear time (the Time Domain"), is transformed
into an other worldly linear "Frequency Domain". The transformed components are no longer constrainted by the discontinuities that exits in real time, therefore the classical mathematics work flawlessly, and are freed to manipulate the information without the errors normally experienced in the Time Domain we live in. Once useful tests and analysis in the Frequency domain are accomplished, the $20 Floating Point Processor in your CPU (once reserved for military radar imaging, Cat Scan & MRI image creation), reverses the deconstruction previously accomplished there, reconverting the results back from the Frequency Domain into a resultant that exists in the Time Domain. Whew, what a mouthful.
.
As I mentioned this mathematical science is all around you. It makes possible Digital Imaging of all kinds, phased array radar, the Moog synthesizer, sonar, supersonic transport, silent submarines, spread-spectrum digital cellphones, and Cher's latest album; plus modeling of all kinds, like architectural and materials stress analysis, pharmaceutical and food additive design, DNA genome modeling, creation of super seeds, and so many others you basically take for granted; all the way to rockets and rovers on Mars and the Search for Extra-terestial Life. So take it from me, it is an advanced, valid technique; made possible by DaVinci, Newton, Kepler, Pascal, Bernoulli, Maxwell, LaPlace, Boole, and a host of other intellectual giants largely forgotten and unknown to most.
.
Back to Earth
It was not until the development of high speed digital computers that the computational power necessary to explore the usefulness of these mathematical techniques became practical. To accomplish just one Fourier Transform when I was in college in 1967, would have taken a team of graduate students working with slide rules or calculators, months of manual computation to resolve just one grainny small image. The rate of increase in speed of this kind of calculation has risen by approximately 1 Quadrillion (a Billion Billions) since then. Now, in just one second, a billion calculations can be done on a $500 home PC, each of which would have taken me 10 minutes in 1967. Using high speed military computers, you can multiply that by 10,000 or more. So it is unimaginably complex for me to actually illustrate the detail of these calculations, though they are well understood by scientists.
Ed: FYI, I will post later a digital image outputed from an early CT Brain Scanner in diagnostic mode, that will give you some visual perspective on this modeling process. But, more on that later.
.
With this perspective now in hand, please understand in TradeVantage you are seeing the results of modeling just 5 data points per day, OHLCV in your training period of just 365 days. This results in the equivalent of a very grainny image, when this type of analysis is performed. Yet the results, as variable as they seem, are not really very different at all. When you step back and examine the total results dsiplayed for the entire training period, even though the tail in most recent days appears to be quite different after each attempt at relearning; in aggregate, the model performs equally well over the entire training period each time it is retrained.
.
That is the only input criteria the NN is given for the training process; it is ordered to create "A" model with the best total period result, not "THE" model. Due to the grain, there are any number of possible solutions to that problem, all leading to very similar total results, but with wildly differing internal paths to get there. This a classic case of "There are many ways to skin a cat!"
.
As it is said in the mathematical jargon of Calculus: In the Limit, as the number of data points approaches infinity, and the depth of the calculation process approaches inifinity, the resulting model approaches Unity (consistency) after each training attempt on the same data.
.
In the practical world, it would take an infinitely sophisticated and infinitely speedy processor, with tick data from all participants over all time, to get to that point in accuracy of the predictive model. Only then, would retraining produce the exact same result each time. But that kind of result is a practical impossibility. This method knowingly produces a variable output model, that is to be relied upon regardless of your opinion about its next signal. If one retraining run says to open a Long today, and the next retraining run says to open a Short today, that is perfectly fine from a theoretical point of view. As long as the results of the training show similar total period results, you can jump into trading on today's new signal with equal confidence on either run's result. Just don't change the model design, or retrain it on that pair until you are again Flat. This requires Total Trust in the methodology; like flying by wire and on autopilot and letting the plane land itself. It's counter-intuitive, and goes against the grain of many control-freak traders to trust and employ such a technology. But it is what it is. Ask any US Fighter Pilot today, if he would prefer to dog fight a Mig manually, without the aid of his Floating Point Processor driven guidance systems.
.
By diversifying over a number of pairs, each seperately trained on differing models, then selecting the best models based soley on each pair's total period performance on the best model; your end results, theoretically, should closely resemble each other. This is true regardless of which training run you ultimately chose to rely upon on that winning model! Your combined portfolio results from multiple pairs, should further increase that ideal approach to Unity. Your future results shall be mostly dramatically affected by the degree to which the characteristics of the pairs' "tomorrows" resembled their prior training periods' "yesterdays". Thus, the need to continuosly retrain, slowly and methodically, over time.
For this 90-day test, I will be retraining each pair on a rolling basis after two weeks, and as trades close in each pair.
.
I hope this sheds some light on the delemma you posed Dave, on how to proceed both for you, and for other end-users who are readers here.
.
Meanwhile
I have been in contact with Konstantin who has agreed to implement 7 changes to his methods that will improve many things for TradeVantage. Some of these are to improve the user friendliness of the client experience, while others will greatly affect the ability to get better consistency for each user and to resolve differing experiences amongst differing users. These improvements will likely be included in a new version K is planning to release some time soon.
The most important improvement I suggested would greatly improve the predictive power, but will require a server side rewrite, that must wait. This improvement in predictive results would come from doing the analysis for daily signals on 4-hour charts, which will increase the number of data points in the calculations by a factor of 6. Ultimately, this will have big implications for the computing time and power required of the client's hardware system, but will also greatly improve the accuracy of the output models. K is considering it.
 
Last edited:
Hi again Big T1
I did buy the first expensive version. To be honest, i am a bit of a technology freak and was fascinated with the product rather than making a quick buck on forex. So to answer the next question i'm not bothered at all that i bought it as i bought it solely on the fact that it can be returned. The sad thing is i was really impressed with the AUE version as you could dabble with it yourself. Unfortunately, they were very slow on releasing any information on it which caused a huge delay as my time was running out. I was also very impressed with Konstantin, and made this clear to the support staff. I would have said goodbye to my 2k if i could get info on the aue system and provided there was no further cost (the monthly payment after the first year). However, you had to pay for a higher support for the AUE system. At this point i realised i was flogging a dead horse and politely requested my money back. They were very prompt at returning my funds but it came with a kind of threat that i could no longer purchase any of thier products in the future as it was the third one i returned. I pointed out that this was incorrect and mistakes were made at their end and they replied to me saying that i could have any of their previous products at half price. Quite good really but i already had the product i was most interested in and they wouldn't release any info on it (Perhaps god's looking after me), especially after reading the other blogs on this site.

Personally i like to see an intent to really produce something that works or helps in the forex market, and that's all. It is really clearly difficult to do, as there are so many products out there and a huge demand for them. I have purchased a few products in the past and have been very impressed with a lot of the content within them. So i kind of think of the whole thing as a learning process and you can't waste money on education, provided it's worthwhile of course and if it isn,t then its worth giving back. Tradevantage for me was a very different animal as i don't like black box systems anyway. I like to know how and why things work. So far i like the psychological approach mostly as the markets are controlled by fear and greed. With tradevantage it suited my sceptical and analytical side of me, so i just had to dabble and try it out. To be honest i would still like to dabble with now as i didn't have time to get bored with it.

As for your explanation of Tradevantage, i think my heads going to explode (only joking). I did understand some of it. I also realise that it comes to conclusions more like a human than a computer in the sense that it is not following strict code and will kind of estimate outcomes. My problem is that when you train it for the 30 days you didn't tell it about, you look for the results over that 30 days as an indication of how good it is. The trouble is that the results are usually about 3 to 5 trades and on re-learning with the same criteria you can have a negative result or a very positive result with the same learning criteria. This leaves you with the problem that you don't know what model to select, let alone trust it to trade. It is true that possibly overall it will all work out as roughly the same result. The problem is your judgement for the final model your going to use is based on three to five trades and although the variation may be minor in it's decisions the difference over just 5 trades can differ marginally, giving you no clue to what model to use.

Thanks for your detailed help though, it's a shame i didn,t have you around at the time as you may have been some help in deciding which model to use. Like yourself, i didn't choose maximum profit either, and i also had a biased towards minimal draw down as my main criteria as well as ignoring 100 percent results as it doesn't indicate how quickly it would get out of a losing trade (ie. it may hang on to it forever waiting for it to be a positive trade. As silly as it sounds i met an ea that works like this and as you would imagine the equity curve is perfect, until it trades on the wrong day of course).

All the best to you ... Dave
 
Hello again Dave,
Thanks again for your contributions to this discussion, which I think is one of the more important and instructive discussions regarding predictive modeling I have ever seen on FPA; enabled only by the hap-hazard workmanship of our dubious friend K, as presented by Herr Dustin.
.
A Tale of 2 Cities
John John Kennedy crashed his twin engine plane into the shallow ocean off my beloved coast of Long Island where I have lived my entire life, killing himself and his family. This occurred primarily for 3 reasons:
1 - He had an indominable, noble spirit and a sense of invincibility, based solely on his birthright and breeding;
2 - He had more money to waste than brains in his head; and
3 - A mere wisp of a fog appeared on a summer night's dusk, where HE was!
.
Dave, I strongly urge you not to approach trading with the same credentials.
If you randomly flit from system to system, uncertain of your path, with no knowledge or understanding, no belief system at your core, and with no truly urgent need to succeed; you are destined to follow in JJ's path.
.
I was 14 when I watched Lee Harvey Oswald executed on national TV, as I survived hand-to-mouth on the earnings of my bankrupt butcher father; while holding the hand of my mother, dying of cancer.
Treat not your ecstatic foray into the forex market with such a glib, nonsensical attitude.
For many of us battle weary vets, me included; life and death is currently and immediately, on the line.
.
Please reread and rethink every word of what I wrote to you and re-examine your reply. I am here to help you if and when you need.
I am not to be your friend, but rather your grave old Austrian physics professor (or math & science teachers), who gave you the lowest marks of your life, which in your heart you knew you deserved due to your own lack of serious intent.
.
My main purpose here, is to distill a methodology that holds true promise in trying to improve the lives of those who need it most.
Let me repeat:
My main purpose here, is to distill a methodology that holds true promise in trying to improve the lives of those who need it most.
.
Think about it; why else would I put my NFA License, my personal reputation, and my true identity on the line? Just to beat up a slimeball like Dustin Pass?
.
What Dustin or K have done in the forex marketplace may be considered merely slimmy, unethical business practice.
As a registered entity, if I were to have done the same in the regulated markets of Stocks, Options, Futures, or Options on Futures; I would have promptly lost my license, been stripped of my assets, and been sentenced to jail.
So sober up Dave, and begin to listen to some sound advice.
.
I urge all concerned to stay tuned, as I attempt to validate the correct way to configure and utilize this simple but competent NN mechanism within the forex environment, in a very uncertain world.
.
My best to all,
Anthony Ingrassia, CTA
NFA ID#: 0278164
 
Last edited:
Hi Again, The truth is, if i'm honest, I don't have an approach other than price action, trendlines, sup/res lines etc. So i have to face facts, although i've managed to trade the same 5k account for nearly three years now without any real loss (not including my purchases of course). I consider myself to have done reasonably well when you hear the horror stories out there. I'm also in a very stable and quite well paid job which i would like to leave but there is no real urgency. I have earned a lot less in the past so it's sort of an investment in myself. This is what i understand so far, tell me if i'm wrong. You need to find a good system and use good money mangagement, Your main objective should be to protect your account keeping losses to a minimum while allowing the trade to play out. Your stops should be in a logical place, behind support etc. and should not be placed just to suit risk. ie if the stop is too close too your entry then you must reduce lot size to allow you to place your stop somewhere more suitable. You must trade the system and trust in it knowing it may endure many losses but overall the account will be positive over the long term. Here lies the problem. How much time do you give a system and how many accounts do you have to lose over the long term to find the right system. I suppose in reality i've probably already found it with my own price action methods. This has brought my account back to 5k when i have endured a few losses with other methods. However, even my system is a bit haphazard and gives me constant reminders of how easy it is to lose your shirt. I do only trade money that i'm prepared to lose, so my trading is minimal, mainly on Daily and four hour charts (as i work full time). I am also a big fan of divergence and more currently fib. I don't find them very accurate but the information they give can be a good guide and they don't lag like other indicators. I suppose i know deep down, there are people that know more about this than i do, Like yourself, so who am i to decide that i have the best system and go on to trade it. I'm not looking for the fullproof system as i know there isn't one, but i know that there are people out there who have a better idea than i do. Because of this i search for what snippets work for me from other peoples methods. Not ideal, but what is the answer and who do i trust. The truth is, like some people like crosswords, i like forex, i really do enjoy it, and find it very challenging. But if you have any ideas to put my way Big T1 i would be glad to hear them.

Thank you very much for your advice, you didn't beat around the bush did you. In reality, i like good advice and believe me, my weaknesses in forex are fundamental to why i search for answers. My problem is i don't truly know what direction to go in, although i always fall back to price action as it's saved me before.

Bye for now ... Dave
 
Dave,
That's more like it. You have already accomplished more than most who come to this venue.
The proof of this is that you have traded sideways; something which is indeed an accomplishment.
From what you describe, you:
1 - Trade only what you can afford to lose,
2 - Adjust your position size based on your SL, which in turn is based on a fixed money management schema, and not the other way around,
3 - Take trades only when your TP will provide better than a 2:1 Reward-to-Risk Ratio; and
4 - Have a core belief in your price action system.
.
This is all you will ever need, if you have the discipline to stick with your plan.
.
Many traders can learn and master steps 1 - 3; but, become disheartened when their trading system disappoints.
Truly believing in #4 in my opinion, is the challenge [The search for the Holy Grail].
.
What we are doing here, is investigating whether or not K's models are worthy of trust.
This can only be accomplished by a disciplined forward test, the results of which I am publishing here.
.
To answer your other question, I may indeed have something of quality to offer you and others in the near future; but for now, please content yourself with following this investigation; to see just where it takes us.
You may also read some of my other posts, such as for ATC Brokers and Million Dollar Pips, for some additional insight as to where I might be going.
T.
 
Last edited:
Back
Top