TradeProfits TradingLog and Signals

tradeprofits

Private, 1st Class
Messages
35
I have been trading on and off for the last 6 years, roughly. I have tried a dozen of different strategies, services, signal providers, expert advisors, etc. There are a few good ones out there, but the majority is nothing but hot air. During these 6 years, I have lost money from trading and buying useless products and services; a frustrating period which I consider as an “educational fee”. I have learned a lot in this period, and my approach to trading has changed a lot since the day I started out. One thing I know for sure, is that no system, strategy, EA or service will make you rich within the end of the week. I no longer believe in “secrets”, or extremely complicated strategies.

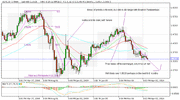
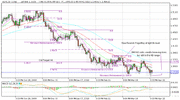
I try to keep my trading as simple as possible. Basically, it is mostly based on technical setups, but I try to keep fundamental aspects in mind too. I use candlestick charts, and I set it up starting from drawing support and resistance levels from a monthly, weekly, daily and 4-hour chart. I look for technical patterns in the same timeframe (sometimes the 1-hour as well). I then base my entry on a close of either the 1-hour of 4-hour candle above or below certain levels, and only enter if is possibility to get a good risk:reward ratio. I only trade when I see a good setup, which obviously means that I don’t trade every single day.

I also trade other strategies, but as I plan on sharing my trades, I will stick to this type as I can get the word out in time. I have been posting signals in the last couple of month but due to some different projects, it has been rather quiet lately. I will also keep this log updated so people here can follow me.

I will be posting more information shortly.
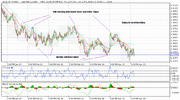
 
Hi guys,

Trading has been a bit slow lately, as I am working on a bunch of different projects. But yesterday we had a perfect setup, which I want to share with you all. Take a look on the picture below. This a simple Symmetrical Triangle, and I was looking for a break out. I simply waited for the pair to close below the pattern, of at least a 1 or 4 hour candle. This picture is a weekly chart, so you can see the pattern. Now look at the picture below that one. This is a one-hour chart. I took a trade when I had the first one-hour candle close below the support level right at 0.8693. My stop loss was some 26 pips above at a decent resistance level and my take profit was open. I closed the trade right after we got some news today so it gave a total of some 50 pips. My stop loss was moved to break even after the initial 30 pips were reached. This is a good example of my typical type of trades. Stay tuned for more updates.

Forums1.jpg


Forums2.jpg
 
Last Friday we had a typical crazy day with a lot of whipsaws and contradicting news. We got worse than expected news from UK, which could have pushed the GBP/USD lower and dragged the EUR/USD further down, however just in the same seconds Greece shocked the European market by accepting the financial aid package offered by the Euro zone and the international monetary fund. This pushed the EUR/USD back up about 170 pips, right after it had made as first new low for about one month. The low of March 25th at 1.3263 was broken and at one point it looked like the pair could have dropped significantly on this day. However, it went back up to 1.3372 and closed for the weekend. It should not be a surprise that concerns over the situation in Greece has contributed to the greenback´s gains in the last week. However the acceptance of the financial aid package obviously gives some kind of hope for the country, but also confirms that the nation is in deep trouble. My apparent guess is that we will see further downside to the EUR/USD, but who knows. I have looked at a couple of possible setups, and keep in mind that we might get a gap when the market opens and this might mess around with my plans. I will mainly follow EUR/USD and base my trades in other pairs on this pair, in terms of correlation. The EUR/USD did cross the recent trendline, and even had a close of the one-hour candle above it. However, one hour later, it was back down, below the trendline, giving us a strong reversal setup, on the 4-hour chart. My bias is bearish for the moment, but if we get a close of the 4-hour candle above the trendline (and no more than 30-50 pips above) I will consider taking a long trade with a tight stop loss just below the trendline. However, if we get a close of the next one-hour candle below the trendline (but no more than 30-50 pips below) I will look to take a short trade with a stop loss above the recent high (fake out above trendline). I would prefer to see a short trade. I will not look for these signals right at the open of the market, but most likely wait until the London session Monday morning (GMT). Follow me on Facebook for real time trades.

EU1HOUR.jpg


EU4HOUR.jpg
 
Eur/usd

Hi

Thanks for the pics

I was reviewing the long term setups on the EUR/USD from the weekly, to the daily then downward see images.

Check out the weekly charts, shrink to see the long term downward moves/waves of the EUR/USD

I'll post a few images, but I think your right about the EUR/USD moving lowers still

Last week had housing numbers increased and core indexes which likely helped the USD against the dollar in spite of the spike upward with Greece bailouts etc.
 

Attachments

  • MGForex-Chart-EURUSD-W-2010.04.26.06.18.44.gif
    MGForex-Chart-EURUSD-W-2010.04.26.06.18.44.gif
    30.1 KB · Views: 16
  • MGForex-Chart-EURUSD-1D-2010.04.26.06.24.23.gif
    MGForex-Chart-EURUSD-1D-2010.04.26.06.24.23.gif
    27.4 KB · Views: 16
Last edited:
Hi Agent86,
Thank you for your comment. It´s nice to see that I am not talking to myself here :) Yes, well then we have the same thought! However, EUR/USD sure is spiking up in these minutes. Getting close to Tokyo session, and it seems like there is a lack of liquidity and this is what is pushing the pair up. Anyhow, here is my new pick:

The picture below is a print-screen of EHR/GBP on a 4-hour chart. The break of the support level was one of my recent trades where I went short, and closed it right before it retraced back up, just above the level and then back down. Now this pair has setup for a perfect double bottom; if and when this pair closes the next one- or four hour candle above 0.8719 I will probably enter on a long trade. I don’t want to see it close more than 50 pips above this level, as this will greatly reduce my chances for an appropriate risk:reward ratio. Normally I would place my stop loss below the two bottoms, but in this case, that would be 120 pips, and I think it will be difficult to get a risk: reward ratio of even 1:2 with such a stop loss. However, if we get a close above 0.8719, the pair is also back in the triangular pattern, and I would then feel comfortable with a stop loss some 10 to 20 pips below the support level (green line). I will be heading to bed with an hour or two, so hopefully we won’t get a break before I am back in front of the screen tomorrow morning. If I enter on a trade, all the details will be posted on facebook in real time.

EURGBP5.jpg
 
It's something to do

Hi,

It's something to do while trading, interesting read while waiting for setups etc.etc.

I see the spike upwards on EUR/USD during your post, and looking at also now spikes downward.

The general direction on larger times is pressure downward still at least until there is some breaks of the of the 1.3262 level with a solid confirmation candle, otherwise we could see extended periods of ranging


But it's going to be intesting watching the regulations unfold that may confirm or reverse the direction.

Here is my 4hr chart - really shrunken down.

Also the moves have been a bit slow and seem to creep instead of just retrace and GO like they should.

Oh well, happy trading.
 

Attachments

  • MGForex-Chart-EURUSD-4H-2010.04.27.11.00.24.gif
    MGForex-Chart-EURUSD-4H-2010.04.27.11.00.24.gif
    33.3 KB · Views: 17
Never noticed this but images on login only

Hi

I never noticed this until today, but funny the images I posted only show up when your logged in to FPA I never new that ?

If I'm not logged in then I just get a icon thing that says loading, but can't access the image ?

But your images shows up fine when not logged in, I wonder why ?
 
Hi Agent86,

Yes that´s true. This is because I have uploaded the pictures to my server and not used the picture function from the forum. I will be back with more setup´s in the upcoming days.
 
Back
Top